Experimental investigation of ice load on a hull surface
Copyright © The Korean Society of Marine Engineering
This is an Open Access article distributed under the terms of the Creative Commons Attribution Non-Commercial License (http://creativecommons.org/licenses/by-nc/3.0), which permits unrestricted non-commercial use, distribution, and reproduction in any medium, provided the original work is properly cited.
Abstract
The rapid reduction in Arctic sea ice cover has increased the opportunities for shipping activities on Arctic shipping routes. Nevertheless, ice forces on a ship hull around the waterline area can be a significant threat to ship operations in polar waters. This study investigates the dynamic characteristics of ice loads when a vessel sails in ice water. Ice model tests were conducted at the Korea Research Institute of Ships and Ocean Engineering (KRISO) ice model basin to further understand the magnitude distribution of ice-induced loads on a hull. To understand the ice load characteristics under continuous icebreaking, level ice conditions were considered, and the magnitudes of ice loads for the friction and submersion components were identified under pre-sawn ice conditions. Finally, a pressure ridge penetration test was conducted to determine ice load distribution. The ship–ice interaction was investigated with respect to the impact loads through the model test results, and the distributions and magnitudes of the ice loads obtained from the tactile sensors attached to the model ship are discussed.
Keywords:
Arctic shipping routes, Ice load, ship–ice interaction, Tactile sensor1. Introduction
Ice-class ships are designed to enhance structural safety and effectively withstand ice loads. Consequently, ensuring the safety of structures and improving icebreaking efficiency are primary concerns in the design of modern ice-capable vessels. Understanding the ice loads acting on a hull surface can provide valuable insights for enhancing the performance and safety of ships in harsh environments. These loads significantly influence the hull structure and overall ship performance in ice-covered waters. Therefore, the design concept requires a thorough understanding of the magnitude and distribution of forces exerted on a hull surface that considers the interactions between the ice and ship.
Many studies have focused on ice loading due to ship and ice interactions. Johnston et al. [1] presented an ice-induced global load prediction method using an inertial measurement unit called MOTAN (MOTion Analysis) based on whole ship motion analysis for the U.S. Coast Guard Healy and Canadian Coast Guard Louis S. St-Laurent. Johnston and Gagnon [2] performed model-scale tests to validate the MOTAN system using a ship model of the Canadian Coast Guard heavy icebreaker Terry Fox. This system demonstrated good feasibility for predicting the global loads on ships. Leira et al. [3] investigated the prediction method of ice loading using hull strain on the Norwegian Coast Guard vessel KV Svalbard during the 2007–2008 winters. Kujala and Arughadhoss [4] explored the local ice pressure acting on a model ship to improve the knowledge of the icebreaking process during model-scale tests. Kotilainen et al. [5] investigated the load characteristics of the bow area of the South African icebreaking ship Agulhas II. They adopted a hierarchical model with a Gaussian process to identify variations in ice load distribution parameters under diverse ice conditions.
Ship navigation through pressure ridges is challenging in the Arctic; therefore, several researchers have focused on this issue. Kärnä et al. [6] developed a numerical model based on a soil mechanical approach to estimate the global structural response of ice loads in ice ridges. Myland [7] conducted model-scale ice ramming tests under six ice ridges and developed a model for estimating ship speed in first-year sea ice ridges. Kramers [8] thoroughly analyzed the distribution of ice loads under ridge ramming tests using the Swedish icebreaker Oden. Kuuliala et al. [9] examined the ice performance of a ship in a ridge and developed a performance prediction method to determine the resistance of the ship in ice ridges.
This study enhances the understanding of ice load distributions on ships and their interactions. Three model-scale ice tests, including level ice, presawn ice, and pressure ridge, were performed in the Korea Research Institute of Ships and Ocean Engineering (KRISO) ice model basin using a ship model of the Korean icebreaking research vessel Araon. The results are thoroughly discussed to analyze the distributions and magnitudes of ice-induced loads on a hull surface. The results provided quantitative and physical characteristics of ice loads during the icebreaking process.
2. Preparation of Model Tests
In general, ice model tests can be used to predict the icebreaking performance of vessels in the early design phase to provide valuable data, such as the load distribution around the waterline and ice resistance. In this study, model-scale tests were performed with Araon’s icebreaker model ship using a 1:18.667 scale in the KRISO ice model basin to evaluate the loads on the ship. She was the first Korean icebreaking research vessel with a Korean Register (KR) class designation Icebreaker POLAR-10. The principal parameters are summarized in Table 1.
Mode-scale tests were conducted in level ice, pre-sawn ice, and pressure ridge conditions to investigate the ice loads during the icebreaking process. The model ship had a bare hull without any propulsion units. Six tactile sensors were installed on the hull surface around the waterline on the port side. The sensors converted the pressure into an electrical signal and identified the physical magnitude of the load distribution, and a dynamometer was installed in front of the bow to measure ice resistance under towing conditions.
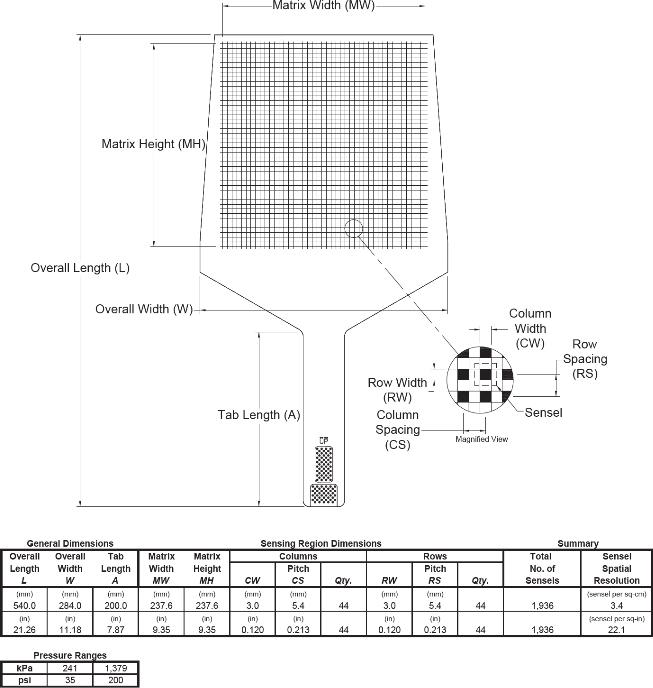
Before the ice tests, the tactile sensors were calibrated, and the calibration factors were obtained. In a previous study, the calibration results showed that the sensors were accurate under loading conditions (Jeong et al., [10]). The tactile sensor had a sensing area measuring 237.6 mm by 237.6 mm, consisting of 1,936 sensels. Its pressure range was 241 kPa. Figure 1 illustrates the tactile sensor used in the ice model tests.
In this study, three ice model tests were conducted, and the mechanical characteristics of the model ice were measured according to the recommended procedures of the International Towing Tank Conference (ITTC) [11]. The friction coefficient between the ship and ice was 0.05, and the model ice density ranged from 870 to 880 kg/m3. The sensor installation locations and test conditions are shown in Figure 2 and listed in Table 2. In addition, according to the ITTC guidelines [11], the model scale ice load is converted to full scale by multiplying the scale ratio by the ice load derived from model scale experiments based on Froude scaling principles.
3. Model Test Results and Discussion
3.1 Ice Load Characteristics under Level and Pre-Sawn Ice Conditions
When a ship passes through level ice, the interaction between the ship and ice is intricate. One of the primary aspects is the rapid increase in the ice load when the ice interacts with a vessel during the continuous icebreaking process. In such cases, ice sheets can fail due to bending stress. Subsequently, broken ice floes can be submerged along the hull surface; thus, the clearing resistance (Rc) and buoyancy resistance (Rb) can increase. In this process, load distribution along the ship hull is crucial during the design phase. Therefore, level ice tests were performed to obtain the distribution pattern of ice loads along the length of the ship. The icebreaking resistance component is the most significant portion of the total resistance in ice. The icebreaking component (Rbr) can be obtained by subtracting the pre-sawn ice resistance components (Rps) from the net ice resistance (RI).
| (1) |
| (2) |
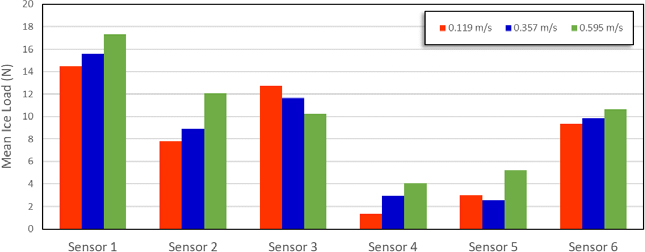
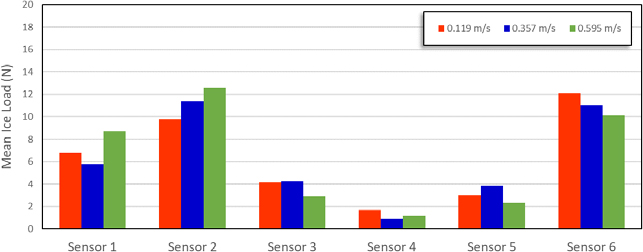
During the model tests, a pre-sawn ice channel was prepared according to the ITTC recommended procedure [11], and the model ship speeds were 0.119, 0.357, and 0.595 m/s (corresponding to full-scale speeds of 1, 3, and 5 kts, respectively). Figures 3 and 4 show the model scale tests for the level ice and the pre-sawn ice channels. Figures 5 and 6 show the ice-load distributions.
As shown in Figure 5, high ice loads occurred at the bow and shoulder sections (Sensors 1, 2, 3) in the straightforward mode. The mean ice loads primarily increased with an increase in the ship speed, except for the results of Sensor 3, and relatively high ice loads were observed in the stern section (Sensor 6). Moreover, the friction characteristics between the broken ice and the model hull influenced the ice loads at the midship section (Sensors 4 and 5). However, the magnitudes of these loads were sequential during the model tests. The magnitude of the ice loads exhibited a downward trend along the longitudinal direction of the ship, except for the results for the stern section (Sensor 6). The differences in the ice loads between the bow (Sensor 1) and midship (Sensor 4) were 13.2 N, 12.6 N, and 13.2 N, respectively, according to the increasing model ship speed.
Figure 6 shows the ice load distributions in the pre-sawn ice channel, where the ice load distributions were generally lower than those of level ice, primarily because of the infrequent bow icebreaking phenomena around the model hull. This resulted in a 49.6 % higher magnitude of ice loads in the bow section in level ice than that in a pre-sawn ice channel at a speed of 0.595 m/s. The ice loads in the shoulder area were slightly higher than those in the bow area due to the submersion of the ice floes. Moreover, the magnitude of the pre-sawn ice resistance component was 35.6 N, 55.1 N, and 75.6 N at model speeds of 0.119 m/s, 0.357 m/s, and 0.595 m/s, respectively, and that of the icebreaking component calculated with these results was 24.2 N, 24.5 N, and 24.7 N, respectively. The ice loads measured by the tactile sensors represent the normal forces acting on them. The force component along the ahead direction can be calculated based on the information regarding the waterline entrance angle and flare angle of the model ship where the sensor was installed. Therefore, the total force can be assumed as the ice resistance acting on the ship.
In this regard, the total ice loads measured by all sensors accounted for approximately 57.8 % of those measured by the dynamometer, assuming that an identical load acted on both sides.
This indicates a significant potential application of the tactile sensor for predicting the icebreaking resistance component when the tactile sensors cover a large area. These results highlight that the tactile sensor can be adapted to determine the icebreaking resistance component without pre-sawn ice tests if installed on the waterline area of the port side or starboard.
3.2 Ice Load Characteristics in a Pressure Ridge
An essential design issue for vessels operating in ice-covered waters is the ramming of pressure ridges. Generally, ridge penetration is a ship’s operational ability to pass through ice ridge fields, and estimating these forces is challenging. As a ship passes through a pressure ridge, the ice forces on the ship hull are affected by the force acting on the breaking of the consolidated layer and the interaction with the rubble ice around the keel. Therefore, the magnitudes of ice loads due to ridge penetration can affect the global and local strength of the hull structure. This study investigated ice load characteristics by performing ridge penetration tests. The ship’s speed is crucial for assessing its advancing capability during the ridge penetration test. Typically, when evaluating a ship’s performance in an ice ridge, the ramming speed is around 5 to 10 knots. However, this study reduced the speed to 1 knot (corresponding to 0.119 m/s in model scale) to analyze the distribution of ice loads acting on the hull as the ship moves through the ice ridge during continuous icebreaking operations. During the ice model tests, the model ship was towed over ridge fields by a carriage system, and the ice ridge formation was modeled according to the recommendations of the ITTC [12]. The geometric information of the ridge is summarized in Table 2, and the internal shear strength of the unconsolidated ridge was determined using in situ punch tests. Figure 7 shows a schematic of the first-year ice ridge used in the model tests. Figure 8 shows the underwater images when the model ship penetrated the ridge.
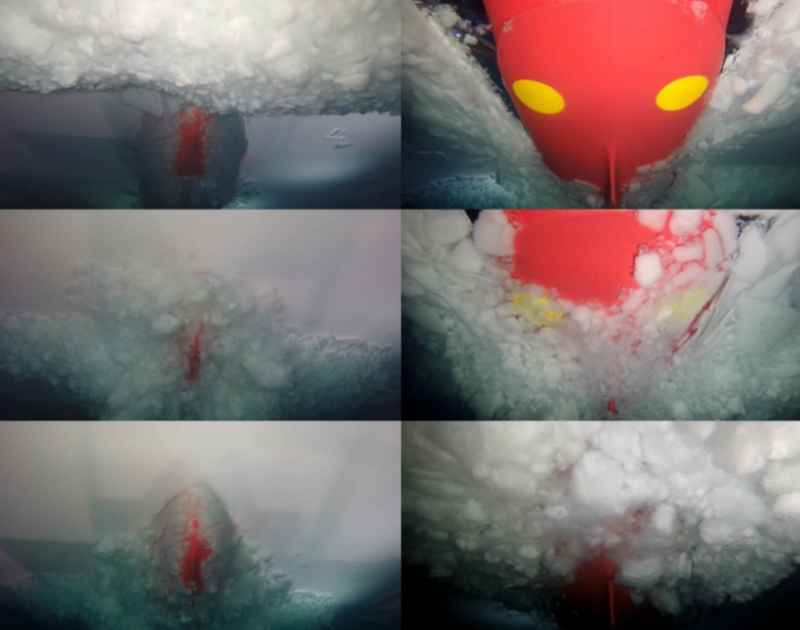
Fish eye's view (top: entering ice ridge; middle: penetrating ice ridge; bottom: after passing through ice ridge)
From the model test, the maximum and average ice load acting on the model hull are summarized in Table 3.
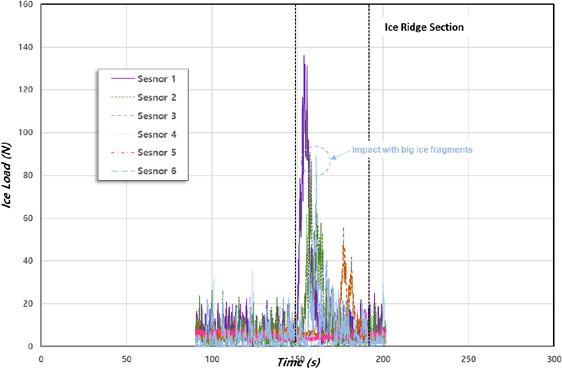
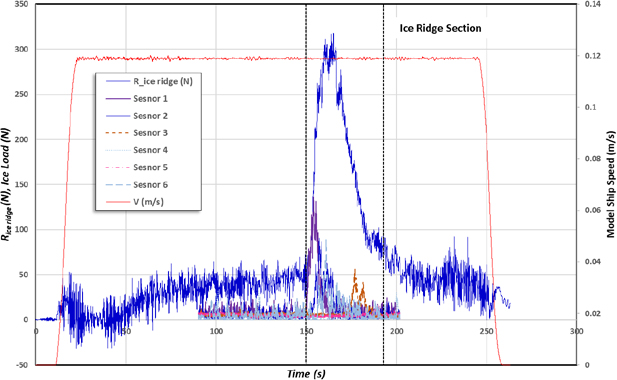
Herein, the duration of ridge penetration was approximately 43 seconds. The magnitude of an ice load is generally influenced by the size of ice fragments and the spacing between ridge keels. As illustrated in Figure 8, the ice fragments were split and submerged beneath the bottom of the ship during ridge penetration. Consequently, the magnitude of an ice load depends on the position of the ship along the ice ridge cross-section. Figure 9 shows the magnitudes of the ice load distributions measured by the tactile sensors.
Large ice loads occur during beaching, and the highest ice loads occur when the bow penetrates the deep-seated point of the ridge keel. Therefore, the bow impact can significantly influence ice loads. The highest ice load at the bow section (Sensor 1) was approximately 136.2 N, which occurred while the ship penetrated the ice ridge at a model ship speed of 0.119 m/s (1 kt at full scale). High ice loads of 91.0 N and 56.4 N also occurred in the shoulder areas at Sensors 2 and 3, respectively. The ice loads in the parallel area of the ship model at Sensors 4 and 5 were approximately 25.9 % and 12.8 %, respectively, of the ice load in the bow area at Sensor 1. Furthermore, the partial impact of rubble ice was observed in the stern section at Sensor 6; however, the magnitude of the ice load was smaller than that at the other locations, except for the large ice fragment impact cases shown in Figure 9.
Ice loads can be represented as a measure of ice resistance; thus, the ship’s resistances during ridge penetration are shown in Figure 10. Ship resistance in an ice ridge occurs mainly by breaking the consolidated layer and penetrating the ridge keel. As shown in Figure 10, the ice resistance at the ridge was eight times higher than that of level ice.
4. Conclusion
This study investigated the ice load characteristics acting on a ship’s hull on ice. Ice model tests were performed in the KRISO ice model basin. The following presents the primary conclusions drawn from the model test results.
The first two tests revealed that the highest ice loads occurred at the bow in level ice. The measured mean ice loads increased with an increase in the ship speed. In contrast, the magnitude of the ice load decreased along the length of the ship. Relatively high ice loads were observed in the shoulder and stern areas owing to shoulder crushing, buoyancy, and frictional forces from the interaction between the ship’s hull and broken ice floes. The magnitude of the ice loads on the bow section in level ice was approximately 49.6 % higher than that in pre-sawn ice at a model ship speed of 0.595 m/s.
When a ship navigates a pressure ridge, it experiences significant ice loads on its longitudinal section. The distribution of these ice loads within the ridge is primarily influenced by a ship’s cross-sectional area, keel volume, and the rubble ice mass. Additionally, the size of the pressure ridge may affect the performance of a ship on ice. As illustrated in the ridge penetration test, when the ship broke through the pressure ridge, the highest ice loads occurred in the bow region due to crushing and shearing failures of the consolidated and rubble layers. In such a case, the peak ice load reached 136.2 N, approximately 3.1 times the average at the bow (Sensor 1), whereas the minimum ice load was observed at the midship (Sensor 4), and the ice load then increased toward the stern (Sensors 5 and 6). In addition, the maximum ice load at the stern (Sensor 6) was 89.3 N, which is 65.6 % of the maximum ice load at the bow. Several large ice load spikes occurred at the shoulder and midship sections owing to the buoyancy and frictional forces between the ship’s hull and the mass of the ice fragments. From the viewpoint of the ship’s navigation in pressure ridge fields, the keel volume, thickness of the consolidation layer, and strength of the keel are significant parameters for predicting the ice loads on a ship; therefore, further studies should consider these properties to understand how ice loads affect a ship’s hull.
Acknowledgments
This research was supported by a grant from the Endowment Project of "Development of Evaluation Technology for Ship Performance in Extreme Environments (PES5091)" funded by the Korea Research Institute of Ships and Ocean Engineering.
This paper is extended and updated from the Proceedings of the 26th International Conference on Port and Ocean Engineering under Arctic Conditions (POAC 2021), held in Moscow, Russia, on June 14-18, 2021.
Author Contributions
Conceptualization and Methodology, S.-Y. Jeong; Writing-Original Draft Preparation and Writing-Review & Editing, S.-Y. Jeong.
References
- M. Johnston, R. Frederking, G. Timco, and M. Miles, “Ice-induced global loads on USCGC Healy and CCGS Louis S. St-Laurent as determined from whole-ship motions,” Technical Report, National Research Council of Canada, Canadian Hydraulics Centre, Canada, 2003.
- M. Johnston and R. Gagnon, “Validating MOTAN: Results from model-scale impact tests with the CCGS Terry Fox,” Proceedings of the 18th International Conference on Port and Ocean Engineering under Arctic Conditions, pp. 409-420, 2005.
-
B. Leira, L. Børsheim, Ø. Espeland, and J. Amdahl, “Ice-load estimation for a ship hull based on continuous response monitoring,” Proceedings of the Institution of Mechanical Engineers, Part M: Journal of Engineering for the Maritime Environment, vol. 223, no. 4, pp. 529-540, 2009.
[https://doi.org/10.1243/14750902JEME141]

-
P. Kujala and S. Arughadhoss, “Statistical analysis of ice crushing pressures on a ship's hull during hull–ice interaction,” Cold Regions Science and Technology, vol . 70, pp. 1-11, 2012.
[https://doi.org/10.1016/j.coldregions.2011.09.009]

-
M. Kotilainen, J. Vanhatalo, M. Suominen, and P. Kujala, “Predicting local ice loads on ship bow as a function of ice and operational conditions in the Southern Sea,” Ship Technology Research, vol. 65, no. 2, pp. 87-101, 2018.
[https://doi.org/10.1080/09377255.2018.1454390]

- T. Kärnä, C. -H. Rim, and K. -N. Shkhinek, “Global loads due to first-year ice ridges,” Proceedings of the 16th International Conference on Port and Ocean Engineering under Arctic Conditions, pp. 627-638, 2001.
- D. Myland, “Ships breaking through sea ice ridges,” Internal Journal of Offshore Polar Engineering, vol. 24, no. 1, pp. 28-34, 2014.
- J. Kramers, Global Ice Ridge Ramming Loads Based on Full Scale Data and Specific Energy Approach, Master's thesis, Delft University of Technology, Netherlands, 2016.
-
L. Kuulialaa, P. Kujala, M. Suominen, and J. Montewka, “Estimating operability of ships in ridged ice fields,” Cold Regions Science and Technology, vol. 135, pp. 51-61, 2017.
[https://doi.org/10.1016/j.coldregions.2016.12.003]

- S. -Y. Jeong, K. Choi, J. -S. Ha, K. -J. Kang, and E. -J. Cheon, “Distribution of ice load acting on model hull due to ship–ice interaction,” Proceedings of the 23rd International Conference on Port and Ocean Engineering under Arctic Conditions, pp. 1-6, 2015.
- International Towing Tank Conference, 2017. Resistance Tests in Ice, ITTC, 7.5-02-04-02.1 [Online]. Available: http://www.ittc.info, .
- International Towing Tank Conference, 2017. Guidelines for modelling of complex ice environments, ITTC, 7.5-02-07-01.3 [Online]. Available: http://www.ittc.info, .


