A proposal for robust control performance on cascade control using IMC-based PID control and genetic algorithm
Copyright © The Korean Society of Marine Engineering
This is an Open Access article distributed under the terms of the Creative Commons Attribution Non-Commercial License (http://creativecommons.org/licenses/by-nc/3.0), which permits unrestricted non-commercial use, distribution, and reproduction in any medium, provided the original work is properly cited.
Abstract
In most processes, robust control performance is required even if a disturbance occurs to ensure stable performance in the steady-state operation. Cascade control needs to be applied to ensure control performance even during disturbances. However, when cascade control is applied, the design and tuning of the primary controller involves the secondary control loop and the primary process and becomes a form of a higher-order equation. The purpose of this paper is to propose a simple method of the design and tuning for controllers without any complicated structures. In this proposal, the secondary control loop was designed and tuned by the IMC-based PID control considering the cancellations of the poles and zeros between a controller and the process. A genetic algorithm was used to design the best performance in the primary controller. For the performance comparison of the proposal, controllers tuned by the IMC-based PID control and direct synthesis and the fine-tuned controller by the Tyreus–Luyben method were applied in the simulation. Simulations were carried out to confirm the control performance using these controllers. As results of the simulation, this proposal presented better results with nominal models, ±10% parametric uncertainties for the processes, and a disturbance with a twice gain, for both setpoint tracking and disturbance rejection.
Keywords:
Cascade control, Genetic algorithm, IMC-based PID control, Uncertainty, Performance indices, PID control1. Introduction
Many investigations on tuning Proportional–Integral–Derivative (PID) controllers, especially in a single-input and single-output (SISO) system, have been carried out [1]-[7]. However, the SISO system often does not provide a satisfactory performance in processes when stringent process requirements are required with slow actions and strong disturbances [8]. One of the main reasons is that the disturbance must be detected by a process variable before a control system response occurs. To clear this issue, multiple measurements are necessary to improve the response to a disturbance. Cascade control is commonly used with multiple measurements and a single manipulated input in processes to control the temperature, flow, and pressure and is frequently applied to processes where disturbances are expected [8]-[9].
Since the cascade control strategy was introduced, many studies have been conducted to improve its closed-loop performance. Some of these have proposed advanced structures for cascade control. Kaya et al. [10] suggested a new approach with a Smith predictor in the primary cascade control loop. In addition, they provided an improved cascade structure for cascade control [11]. Dola [12] et al. described how to tune for unstable time delay processes in the cascade control loops using a modified Smith predictor. Mukherjee et al. [13] proposed an advanced dead-time compensator-based series cascade control structure for unstable processes.
Some researchers have focused on how to easily tune the PID controllers in the cascade control system. Skogestad et al. [14] provided a simple method using a half rule for simplifying the complicated transfer functions of the processes and the application of the IMC-based PID control. Lee et al. [15] suggested simultaneously tuning the PID controllers both for the primary and secondary control loops. Jeng [16] presented both primary and secondary controllers to be tuned at the same time by directly using setpoint step-response data without resorting to process models. However, cascade control with complex structures is difficult to apply in industrial plants and LNG carriers with many controllers to be tuned. Furthermore, it may be necessary to consider that some variables are omitted in the process of simplifying the controller, making it vulnerable to disturbances.
The main contribution of this paper is to present a controller tuning method that can lower the order of the transfer function of the entire system and guarantee optimal performance when tuning the primary controller of the cascade control loop. In other words, the IMC-based PID control was applied to lower the overall transfer function order of the secondary control loop by pole-zero cancellation between the plant and the controller in the secondary control loop. In the primary control loop, the genetic algorithm (GA) was used to show optimal performance. It also has the goal of providing a method to show good control performance even with uncertainties, such as the degradation of equipment performance, over time.
First, we cite the transfer functions in other papers to verify the performance of the controller tuning method proposed in this paper [17]. However, the transfer function of a valve is newly created by the system identification approach, since it can be normally presented for its characteristics well using a first-order transfer function. After selecting all models used in the processes, each controller for the primary and secondary control loops was tuned by the proposed method using the GA and the IMC-based PID control. Some comparative controllers were tuned by the Tyreus– Luyben method and methods using direct synthesis and the IMC-based PID control.
Then, the reference tracking performance for the proposed controllers and the comparative controllers are reviewed. After checks for the reference tracking performance, the disturbance rejection performances of the controllers were confirmed by the uncertainties occurring through degradation, such as aging and the changes in the disturbance magnitude. For these confirmations, simulations were used.
2. System configuration and models
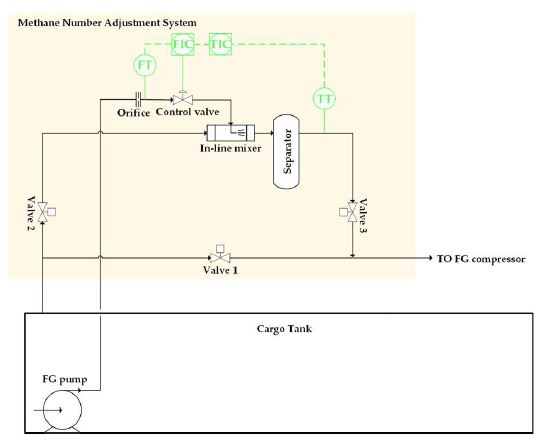
The system used in this paper was configured with the goal of lowering the temperature of the fuel gas by spraying the LNG into the natural boil-off gas (NBOG) through an in-line mixer to raise the methane number. Specifically, the purpose was to lower the temperature of NBOG from −80 to −100 °C. The purpose of lowering the temperature of the NBOG is to avoid the knocking phenomenon in the Otto cycle engines. Figure 1 explains how this system named as the methane number control system was configured [18].
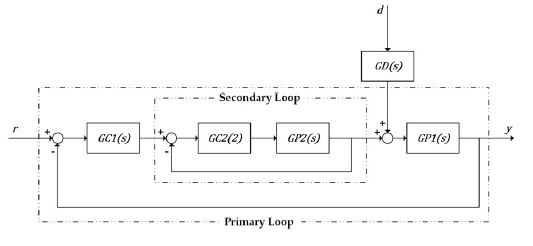
Figure 2 shows the block diagram of this system based on the system configuration of Figure 1 [18]. In Table 1, the units representing the input–output relationships with the transfer function and details used in the block diagram are identified.
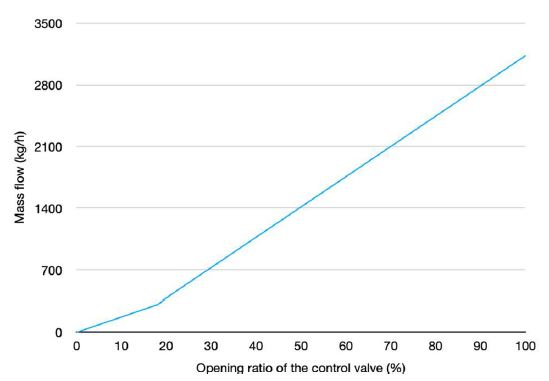
For the control valve indicated as GP2(s), the modeling accuracy was ensured without using a higher-order equation; so, the first-order transfer function of the control valve was newly obtained in this study. Figure 3 shows the characteristic curve of the control valve used for the system identification [17].
The system identification using MATLAB Simulink provides estimates of the model parameters by minimizing the errors that occurred between the model outputs and the measured results. The least-squares method is one of the best methods available to lower the errors between the measured values and the model output values [19]-[24]. The regression model used for the mathematical structure is explained as Equation (1). These vectors explained in Equation (1) can be indicated as Equations (2) and (3):
| (1) |
| (2) |
| (3) |
where y(i) represents the measured values, x represents the parameters at the model, and βn(i) represents the regressors.
The parameters written in Equation (3) should be minimized by the least-squares loss in Equation (4). The residual ε(i) is presented in Equation (5).
| (4) |
| (5) |
| (6) |
The model for the control valve was obtained by the solution to the least-squares equation considering that the matrix, β(i)Tβ(i), was nonsingular. The first-order transfer function for the control valve created by Equations (1) to (6) showed 98.66% consistency with the measured values.
All parameters for the transfer functions of the models used in this paper are summarized, including for the control valve, in Table 2. The general structures of the first- and second-order transfer functions are shown in Equations (7) and (8).
| (7) |
| (8) |
3. Controller design and tuning
As a practical controller with a history of more than 70 years, the PID controller, one of the most widely used controllers in actual engineering projects, was applied as the basic controller in this study [25]. The basic parallel PID is presented in Equation (9):
| (9) |
where u(s) is the control output, e(s) is the error, kp is the proportional gain, is the integral time, and is the derivative time.
In the case of IMC-based PID control, it leads to tune a single parameter, the IMC filter λ. As the same context, the direct synthesis provides a desired closed-loop response with a single tuning parameter. Given that there is one tuning parameter, it is advantageous for tuning of these controllers in a cascade control loop with a rather complex structure, so these tuning methods were adopted in this paper. The Tyreus-Luyben method is a popular method for tuning the controller because it is easily tuned while ensuring stable performance. The genetic algorithm was applied in this article because it can ensure better control performance.
3.1 Case A: Combination of the genetic algorithm and the IMC–based PID control
Designing and tuning the cascade controllers involve two steps [26]. First, the secondary controller needs to be designed and tuned to have a faster speed than the primary controller. Then, the transfer functions of the primary control loop and secondary controller are included to design and tune the primary controller.
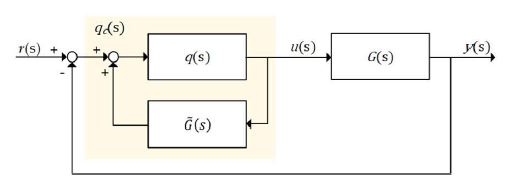
The secondary controller was designed and tuned by the IMC–based PID control. This method included a unique feature of the IMC structure as explained in Figure 4 [26]-[27].
In Figure 4, the , which was defined as the process model, was replaced by to design and tune the secondary controller. The G(s)describes an actual process. The q(s) indicated in Figure 4 represents an internal model controller including the filter f(s). This can be expressed as in Equation (10).
| (10) |
The qc(s) in Figure 4 means the GC2(s) represented by Equations (11) to (13).
| (11) |
| (12) |
| (13) |
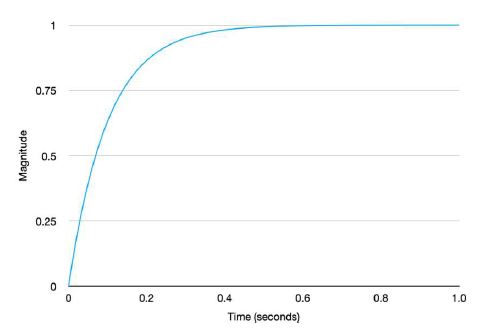
A single tuning parameter, λ, in relation to the response speed of the closed-loop system was selected as 0.1. The result of the reference tracking with the secondary control loop is shown in Figure 5. As shown in Figure 5, the selected λ value guaranteed a sufficiently fast response and good result.
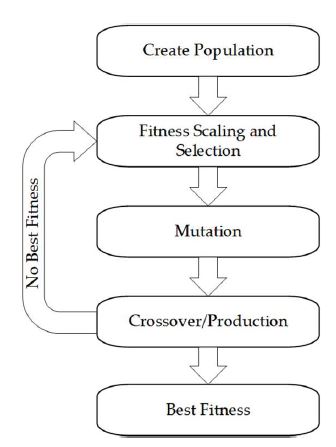
Even when the poles and zeros are cancelled from the secondary control loop by the IMC-based PID control method, it is difficult to design and tune the primary controller. This is because when the secondary control loop and primary process are combined for designing and tuning the primary controller, it becomes a third-order or higher-order transfer function. The genetic algorithm (GA) was used to find parameters that can perform optimally under these conditions. The GA is one of the search and optimal techniques reflecting the process of natural selection where the fittest individuals are chosen for reproduction to produce offspring [28]-[31]. Figure 6 illustrates the methodology of the GA [32].
The parameter values and methods used for GA are summarized in Table 3. The GA starts from a set of individuals defined as a population. Each individual is a solution to be solved. The selection chooses the fittest individuals, allowing them to pass their genes to the next generation. The crossover is the most important phase for randomly mating each pair of parents. At a certain level to form offspring, some of the genes are mutated to maintain diversity within the population. Finally, this procedure is terminated when the population has converged.
Table 4 shows the parameter values of the PID controllers obtained using the IMC-based PID control and GA.
3.2 Case B: Combination of direct synthesis and IMC–based PID control
Direct synthesis was introduced for designing and tuning the primary controller [18]. In the case of the secondary controller tuned by the IMC–based PID control, the same controller as in Case A was used. When designing and tuning the primary controller, the secondary control loop was not considered, because most poles and zeros were cancelled by the IMC–based PID control. That is, we assumed the GCL2(s) in Figure 7 was 1.
| (14) |
Based on the block diagram, the GCL1(s) is derived as Equation (14). From Equation (14), the primary controller was transformed to Equation (15).
| (15) |
The desired transfer function for GCL1(s) is defined in Equation (16).
| (16) |
From these Equations, GCL1(s) can be derived as Equation (17) [33]-[34].
| (17) |
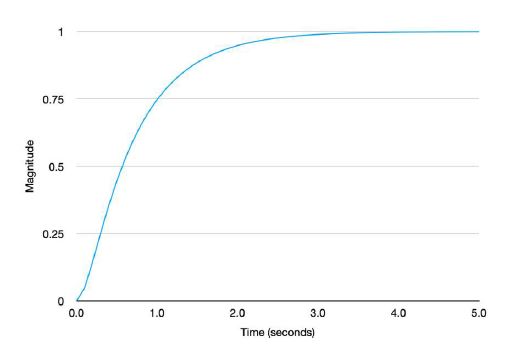
A single tuning parameter, λF , in relation to the response speed of the closed-loop system was selected as 0.75. The result of a step response based on the selected λF value is shown in Figure 8. The summary of the parameters for the primary controller is presented in Table 5.
3.3 Case C: Fine-tuned Tyreus-Luyben method
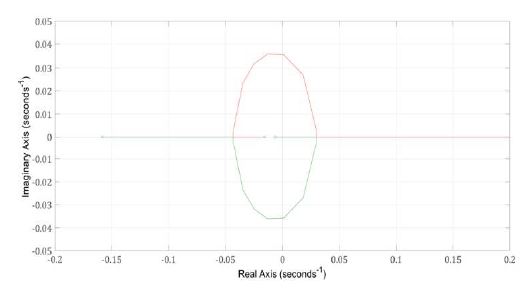
Unlike in other cases, GC2(s) was excluded in Case C. This was because it showed poor control performance when a secondary controller designed and tuned by the IMC−based PID control was included. Based on the root locus method, the gain facing the imaginary axis was considered as the critical gain (kcu) and frequency (Pu) [18]. According to Figure 9 showing on the response result of the root locus, kcu and Pu were 0.708 and 173.003 rad/s.
However, the response result was unsatisfactory in the set–point tracking and disturbance rejection performances by the Tyreus–Luyben method. As a conclusion, a fine tuning was carried out to show a good result, as shown in Table 6.
4. Simulation results and discussion
The control performance is reviewed by the setpoint tracking and the disturbance rejection. To consider the performance degradation, ±10% parametric uncertainties for the processes are also considered. Each performance assessment is carried out with the criteria listed below. To confirm the performance assessment, the MATLAB software program (Mathworks, Massachusetts, USA) was used.
- • Assessment A: nominal model;
- • Assessment B: parametric uncertainty with a +10% gain and –10% time constant for the processes;
- • Assessment C: parametric uncertainty with a –10% gain and +10% time constant for the processes;
- • Assessment D: disturbance with a twice gain.
The performance review progresses with some indices [35]-[36]. The time-weighted integral of absolute value of error (ITAE) penalizes errors that persist for a long time, while the integral of square error (ISE) tends to penalize a large error. The integral of the absolute value of error (IAE) is relatively weighted for smaller errors and is less sensitive to the large errors. These can be described as Equation (18) to (20).
| (18) |
| (19) |
| (20) |
Additionally, the settling time and maximum percent overshoot are used to evaluate the control performance [37]. The settling time (Ts) describes the required time (seconds) to reach and stay within ±2% of the steady-state value. The maximum percent overshoot (Mo) defines the ratio of the response peak value to the steady-state response value.
4.1 Assessment A: Nominal modes
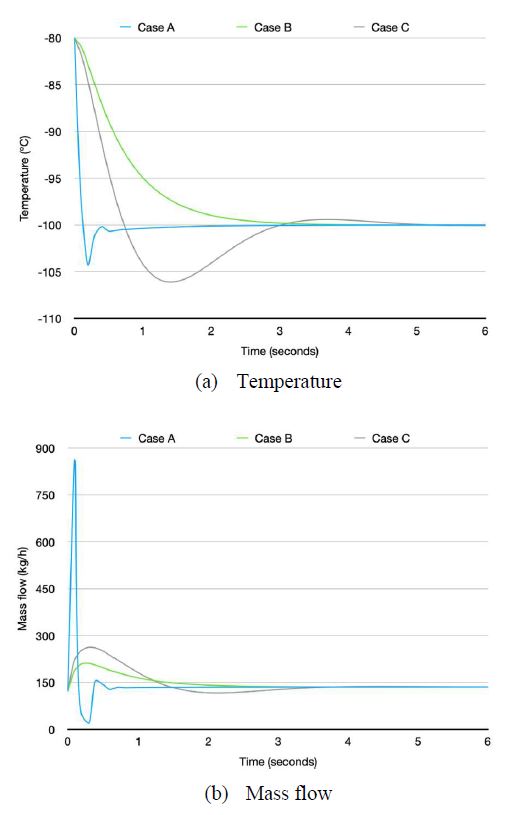
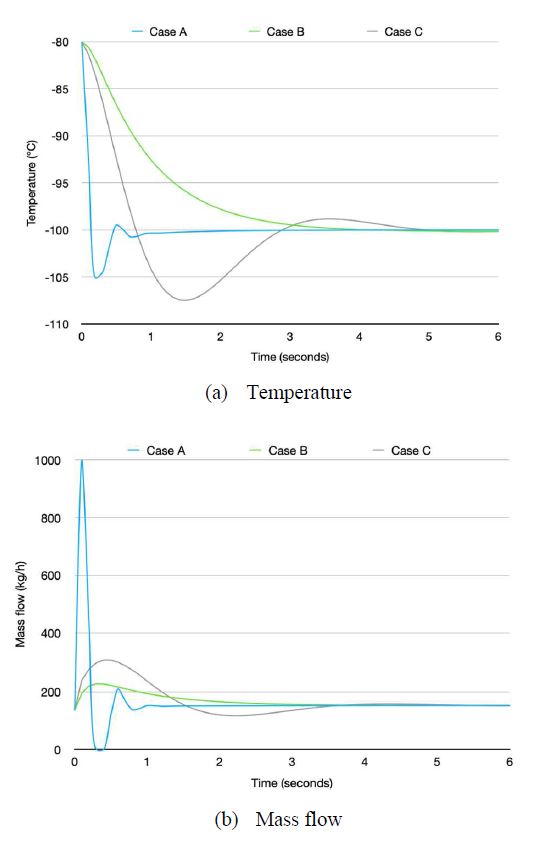
Assessment A was examined using the nominal models. When a tracking signal of −100 °C was applied to the system, the control performance of each controller was as depicted in Figure 10. The proposal, Case A, represented a good control performance overall. A little overshoot was allowed compared to Case B; however, it showed superior performance in the indices of ITAE, IAE, and ISE. The reason why Case A showed good performance was because the relatively large flow rates were swiftly controlled. Case C required a large overshoot and a long settling time. The flow rate for all cases stabilized at 152.3 kg/h over the time. Figure 10 shows the setpoint response results.
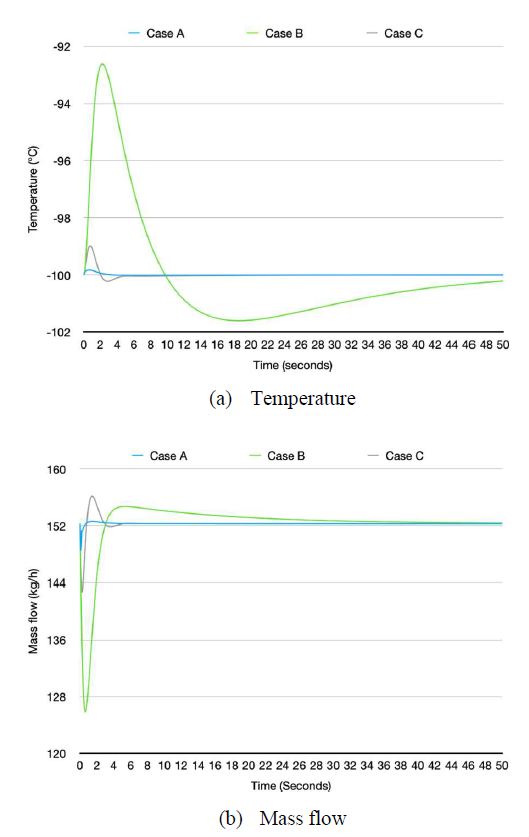
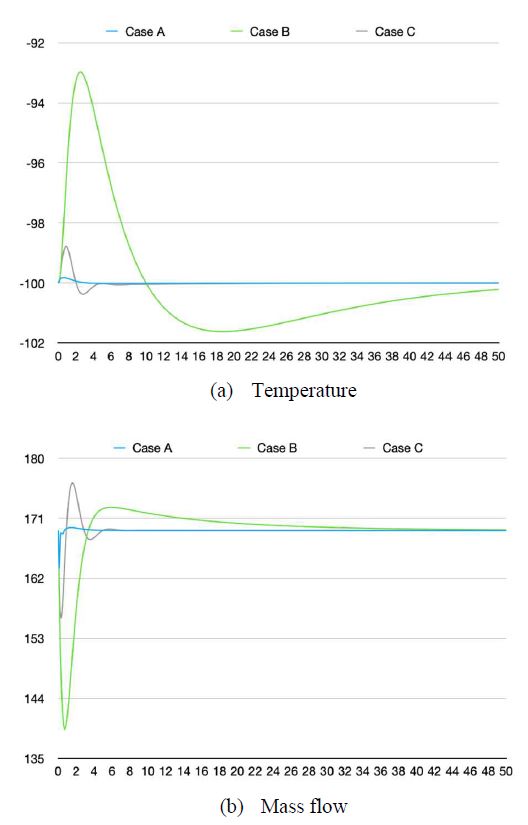
When a disturbance was applied to the system, Case C showed better control performance than Case B. Case B provided competitive performance unlike the setpoint tracking case. In the case of the comparison with Case A, Case C allowed a larger overshoot. Case B rose to –92.8 from –100°C when a disturbance occurred. However, Case A rose to –99.8°C showing a small overshoot. Considering the ITAE, IAE, and ISE, Case A provided better control performance than Case C. The flow rate for all cases was also stabilized with the same value in the setpoint response. Figure 11 depicts all the results of the disturbance responses. Table 7 provides the summary of the response results for the setpoint and disturbance.
4.2 Assessment B: Uncertainties with a gain +10% and time constant –10%
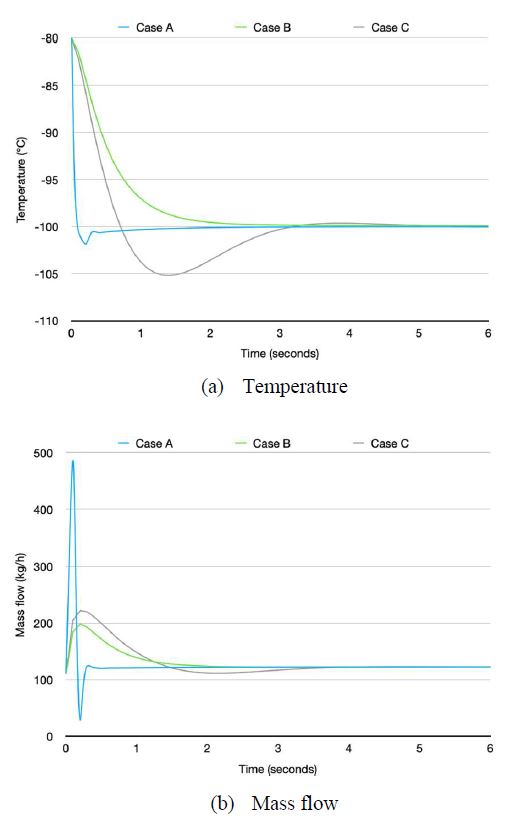
This assessment reviewed the parametric uncertainties with a +10% gain and –10% time constant for the primary and secondary processes. The results were similar to Assessment A excluding presenting better performance in terms of the performance indices. In the setpoint response, the performance indices were good in the order of Case A, B, and C, as in Assessment A. In the case of the flow rate into the inline mixer, it requested 138.5kg/h of the liquified natural gas. Figure 12 describes the response trends of all cases in the setpoint tracking.
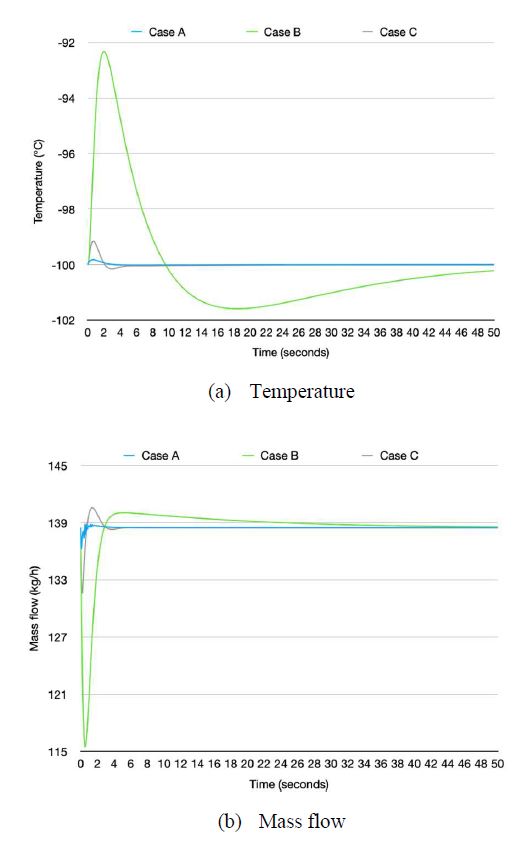
Even when a disturbance was applied, the response results described a tendency similar to that described in the setpoint. What is notable is that the overshoot value in Case B increased slightly compared to Assessment A, unlike in the other cases. The detailed values are shown in Figure 13. The summary of all results for the setpoint tracking and disturbance rejection is shown in Table 8.
4.3 Assessment C: Uncertainties with a Gain –10% and Time Constant +10%
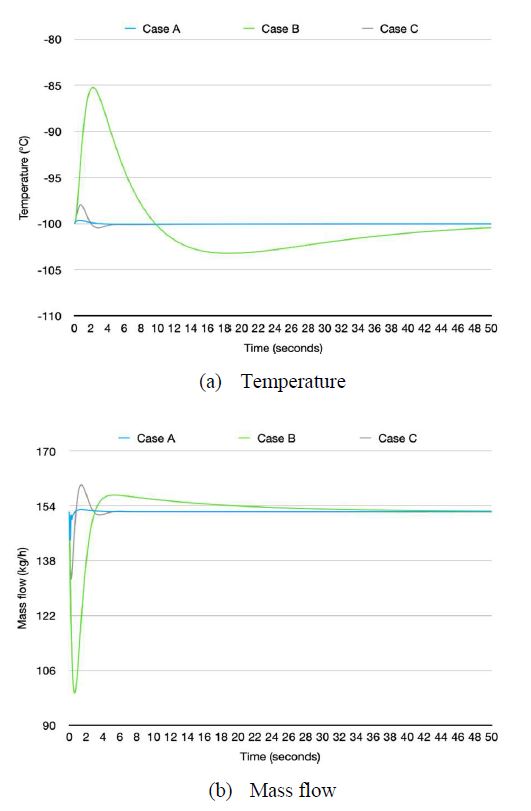
This assessment resulted in overall performance degradation compared to the nominal model. In the case of setpoint tracking from the other assessments, Case B showed better performance than Case C, but the opposite trend occurred in this evaluation. In other words, Case C presented a good performance from the perspective of the ITAE, IAE, and ISE. However, in terms of the setting time and overshoot, Case B still performed better than Case C. Case A depicted good performance, but it allowed for performance degradation compared to the nominal model. The details are described in Figure 14.
Even when a disturbance was applied, overall performance degradation occurred rather than the response of the nominal model. The flow rate requested in the system was 169.15 kg/h, which resulted in a significant increase compared to the 152.3 kg/h required for the nominal model. It is noteworthy that Case A had little change in performance in the case of a disturbance rejection. Figure 15 explains what changes in the temperature and mass flow occurred with the disturbance in the system. The specific values are given in Table 9.
4.4 Assessment D: Disturbance with a Twice Gain
In this assessment, a disturbance with a twice gain was used in the nominal models. In the case of setpoint tracking, only a disturbance rejection was reviewed, because it was the same simulation condition as Assessment A. Case A demonstrated an increase in the ITAE, IAE, and ISE values at a rate almost equal to the gain size of the disturbance. The settling time was the same as 0 seconds, because the temperature rose within –98°C, but the overshoot increased by about two times. Cases B and C displayed relatively large increases in ITAE, IAE, and ISE, more than the size of the disturbance gain. Cases B and C represented overshoot values of about twice those in Case A. Figure 16 demonstrates the response curves of each case for the temperature and mass flow. The details are summarized in Table 10.
5. Conclusion
In this paper, we proposed a cascade control by applying the IMC-based PID control and the genetic algorithm to design and tune controllers that showed good performance in both setpoint tracking and disturbance rejection. From the simulation results for all assessment cases, our proposal guaranteed a fast settling time with small errors of ITAE, IAE, and ISE in the setpoint tracking. In addition, it showed better results than the setpoint tracking when a disturbance occurred, unlike Case B and Case C. For performance comparison with the proposed method (Case A), we applied these controllers (Case B) tuned by the IMC–based PID control and direct synthesis and the fine-tuned controller (Case C) tuned by the Tyreus–Luyben method. To analyze the performance of these controllers, we performed a simulation. These analyses were carried out by nominal models, ±10% parametric uncertainties for the processes, and a disturbance with a twice gain.
- (1) In Assessment A with the nominal models, Case A guaranteed good performance for the ITAE, IAE, and ISE. In addition, it provided a faster settling time than the comparative controllers in Cases B and C regardless of the setpoint tracking and the disturbance rejection. In terms of the mass flow required in the system for changing the temperature from –80 to –100°C, it requested the same value in all cases. In Assessment B with uncertainties with a +10% gain and –10% time constant for the processes, all the cases showed a better performance for the temperature and mass flow compared to Assessment A. In addition, performance indices such as the settling time depicted better trends than Assessment A. As opposed to the condition of Assessment B, Assessment C considered a –10% gain and +10% time constant, showing the worst response results. The performance degradation was confirmed compared to Assessment A based on all performance indices.
- (2) In Assessment D, there was a disturbance with a twice gain. That is, this evaluation was simulated based on the nominal model, and only the gain value of the disturbance was changed. Case A ensured good performance even when a disturbance was applied and showed a tendency to increase the ITAE, IAE, and ISE in proportion to the gain value of the disturbance. Cases B and C presented greater increases than the gain value applied to the disturbance in the ITAE, IAE, and ISE.
In future work, we will examine not only the contents of this study, but also varying more practicable processes. We will also confirm how much the performance and efficiency are improved by the simulations and the actual tests.
Author Contributions
Conceptualization, S. -K. Hwang; Methodology, S. -K. Hwang; Software, S. -K. Hwang; Writing—Original Draft Preparation, S. -K. Hwang; Writing—Review and Editing, S. -K. Hwang and B. -G. Jung; Supervision, S. -K. Hwang and B.-G. Jung. All authors have read and agreed to the published version of the manuscript
References
-
N. Minorsky, “Directional stability of automatically steered bodies,” Journal of the American Society for Naval Engineers vol. 34, no. 2, pp. 280-309, 1922.
[https://doi.org/10.1111/j.1559-3584.1922.tb04958.x]

-
J. G. Ziegler and N. B. Nichols, “Optimum settings for automatic controllers,” Journal of Dynamic Systems, Measurement, and Control, vol. 115, no. 2B, pp. 220-222, 1993.
[https://doi.org/10.1115/1.2899060]

- G. A. Coon, “How to set three-term controllers,” Control Engineering, vol. 3, no. 21, 1956.
-
S. Bennett, A History of Control Engineering 1930-1955, London, UK: The IET, 1993.
[https://doi.org/10.1049/PBCE047E]

-
K. J. Astrom and T. A. Hagglund, “Frequency domain method for automatic tuning of simple feedback loops,” In Proceedings of the the 23rd IEEE Conference on Decision and Control, pp. 299-304, 1984.
[https://doi.org/10.1109/CDC.1984.272361]

- T. Blevins, W. K. Wojsznis, and M. Nixon, Advanced Control Foundation: Tools, Techniques, and Applications, Durham, USA: International Society of Automation, 2013.
-
S. Skogestad, “Simple analytic rules for model reduction and pid controller tuning,” Journal of Process Control, vol. 13, no. 4, pp. 291-309, 2003.
[https://doi.org/10.1016/S0959-1524(02)00062-8]

- B. W. Bequette, Process Control: Modeling, Design, and Simulation, NJ, USA: Prentice Hall Professional, 2003.
-
İ. Kaya and M. Nalbantoğlu, “Simultaneous tuning of cascaded controller design using genetic algorithm,” Electrical Engineering, vol. 98, pp. 299-305, 2016.
[https://doi.org/10.1007/s00202-016-0367-4]

-
İ. Kaya, “Improving performance using cascade control and a smith predictor,” ISA Transactions, vol. 40, no. 3, pp. 223-234, 2001.
[https://doi.org/10.1016/S0019-0578(00)00054-9]

-
İ. Kaya, N. Tan, and D. P. Atherton, “Improved cascade control structure for enhanced performance,” Journal of Process Control, vol. 17, no. 1, pp. 3-16, 2007.
[https://doi.org/10.1016/j.jprocont.2006.08.008]

-
D. G. Padhan and S. Majhi, “Modified smith predictor based cascade control of unstable time delay processes,” ISA Transactions, vol. 51, pp. 95-104, 2012.
[https://doi.org/10.1016/j.isatra.2011.08.002]

-
D. Mukherjee, G. L. Raja, and P. Kundu, “Optimal fractional order imc-based series cascade control strategy with dead-time compensator for unstable processes,” Journal of Control Automation Electrical System, vol. 32, pp. 30-41, 2021.
[https://doi.org/10.1007/s40313-020-00644-2]

-
S. Skogestad, “Simple analytic rules for model reduction and pid controller tuning,” Journal of Process Control, vol. 13, no. 4, pp. 291-309, 2003.
[https://doi.org/10.1016/S0959-1524(02)00062-8]

-
Y. Lee, S. Park, and M. Lee, “PID controller tuning to obtain desired closed-loop responses for cascade control systems,” IFAC Proceedings Volumes, vol. 31, no. 11, pp. 613-618, 1998.
[https://doi.org/10.1016/S1474-6670(17)44994-9]

-
J. -C. Jeng, “Simultaneous closed-loop tuning of cascade controllers based directly on set-point step-response data,” Journal of Process Control, vol. 24, no. 5, pp. 652-662, 2014.
[https://doi.org/10.1016/j.jprocont.2014.03.007]

-
S. Hwang and B. Jung, “Methane number control of fuel gas supply system using combined cascade/feed-forward control,” Journal of Marine Science and Engineering, vol. 8, no. 5, p. 307, 2020.
[https://doi.org/10.3390/jmse8050307]

- S. Hwang, A Study on the Development of Methane Number Adjustment System, Ph. D. Dissertation, Department of Marine Engineering, Korea Marine & Ocean University, Korea, 2022.
- K. J. Astrom and B. Wittenmark, Adaptive Control, NY, USA: Dover Publications, 2008.
- L. Ljung and T. Glad, Modeling of Dynamic Systems, NJ, USA: Pearson College, 1994.
- L. Ljung, System Identification Toolbox Getting Started Guide, MA, USA: Mathworks, 2018.
- L. Ljung, System Identification Toolbox User’s Guide, MA, USA: Mathworks, 2018.
- J. K. Karel, System Identification: An Introduction, London, UK: Springer, 2011.
- L. Ljung, System Identification: Theory for the User, NJ, USA: Prentice Hall, 1999.
-
H. Feng, W. Ma, C. Yin, and D. Cao, “Trajectory control of electro-hydraulic position servo system using improved PSO-PID controller,” Automation in Construction, vol. 127, 103722, 2021.
[https://doi.org/10.1016/j.autcon.2021.103722]

- C. D. Alexandre, S. B. Costin, A. K. Anton, Integrated Design and Simulation of Chemical Processes, MA, USA: Elsevier, 2014.
- D. E. Seborg, D. A. Mellichamp, T. F. Edgar, and F. J. Doyle, Process Dynamics and Control, NJ, USA: John Wiley & Sons, 2010.
- N. Thomas and D. P. Poongodi, “Position control of DC motor using genetic algorithm based PID controller,” Proceedings of the World Congress on Engineering, pp. 1-3, 2009. Available: ISBN 978-988-18210-1-0.
- S. Nazmul, Intelligent Control: A Hybrid Approach Based on Fuzzy Logics, Neural Networks and Genetic Algorithms, NY, USA: Springer, 2014.
-
M. Ünal, A. Ak, V. Topuz, and H. Erdal, Optimization of PID Controllers Using Ant Colony and Genetic Algorithms; Optimization of PID Controllers Using Ant Colony and Genetic Algorithms, Berlin, Germany: Springer, 2013.
[https://doi.org/10.1007/978-3-642-32900-5]

- S. N. Sivanandan and S. N. Deepa, Introduction to Genetic Algorithms, Berlin, Germany: Springer, 2008.
-
D. C. Meena and A. Devanshu, Genetic Algorithm Tuned PID Controller for Process Control, In Proceedings of the 2017 International Conference on Inventive Systems and Control (ICISC), pp. 1-6, 2017.
[https://doi.org/10.1109/ICISC.2017.8068639]

-
M. N. Anwar, M. Shamsuzzoha, and S. Pan, “A frequency domain PID controller design method using direct synthesis approach,” Arabian Journal for Science and Engineering, vol. 40, pp. 995-1004, 2015.
[https://doi.org/10.1007/s13369-015-1582-4]

-
C. Anil and R. P. Sree, “Tuning of PID Controllers for integrating systems using direct synthesis method,” ISA Transactions, vol. 57, pp. 211-219, 2015.
[https://doi.org/10.1016/j.isatra.2015.03.002]

-
S. M. H. Mousakazemi, “Comparison of the error-integral performance indexes in a GA-tuned PID controlling system of a PWR-type nuclear reactor point-kinetics model,” Progress in Nuclear Energy, vol. 132, 103604, 2021.
[https://doi.org/10.1016/j.pnucene.2020.103604]

-
M. H. Marzaki, M. Tajjudin, M. H. F. Rahiman, and R. Adnan, “Performance of FOPI with error filter based on controllers performance criterion (ISE, IAE and ITAE),” Proceedings of the 2015 10th Asian Control Conference (ASCC), pp. 1-6, 2015.
[https://doi.org/10.1109/ASCC.2015.7244851]

- K. Ogata, Modern Control Engineering, NJ, USA: Prentice Hall, 2010.

