An experimental study on the effects of internal tubular coatings on mitigating wax deposition in offshore oil production
Copyright © The Korean Society of Marine Engineering
This is an Open Access article distributed under the terms of the Creative Commons Attribution Non-Commercial License (http://creativecommons.org/licenses/by-nc/3.0), which permits unrestricted non-commercial use, distribution, and reproduction in any medium, provided the original work is properly cited.
As the demand for petroleum resources increases, and oilfields on lands and in shallow-sea become exhausted, the areas for oil production are expanding to the deep sea and therefore technologies for flow assurance are coming into the highlight. In low temperature environment such as the deep sea, wax is accumulated and prevents stable oil production. Therefore, the development of flow assurance technologies is required. Wax is precipitated in crystalline form when the oil temperature decreases below the wax appearance temperature; it then accumulates on the inner walls of pipelines causing blockages. In particular, in subsea pipelines, which have a large surface contact area with the surrounding seawater, wax deposition problems are frequent. The internal tubular coating can effectively reduce wax deposition without pausing oil production when the coating is appropriately designed. This study carried out wax deposition tests on a number of internal tubular coatings under single flow conditions. The results were analyzed for the effects that the physical properties of the coatings had on wax deposition.
Keywords:
Flow assurance, Wax, Internal tubular coating1. Introduction
As the demand for petroleum resources increases, the areas of oil production are expanding into the deep seas; consequently, technologies for flow assurance are becoming very important. These technologies include various types of engineering applications that enable fluids to flow from reservoirs to refinery facilities without interference. Petroleum wax is one of the factors that can prevent flow assurance under low temperature environments. Wax is a complex substance consisting of normal-paraffin, iso-paraffin and cyclo-paraffin, having carbon numbers between 18 and 65. When the temperature of oil flowing in a pipeline decreases below the wax appearance temperature (WAT), wax is precipitated as a crystal substance and accumulates on the inner walls of the pipeline, preventing flow assurance. Such material, deposited within a pipeline in the Gulf of Mexico between 1992 and 2002, accounted for a total of 51 blockages and considerable financial costs in the resolution of the problems [1].
Technologies for flow assurance, which control wax deposition, include thermal management systems, wax inhibitors, pigging, and coating. An appropriately designed inner-wall coating for a pipeline can effectively reduce wax deposition without retarding oil production and causing financial losses. In the oil and gas industries, internal tubular coatings are commonly used to prevent corrosion of pipelines by carbon dioxide, hydrogen sulfide, oxygen, chloride, and acidic components. These coatings also improve the hydraulic flow of fluids. It was discovered that these coatings also reduced wax deposition in pipelines in areas where paraffin oils were produced. Subsequently, internal tubular coatings have been widely used as a long-term solution for the control of wax deposition in such areas. There have been a number of studies in this field. Coatings that are used on the inner wall of pipelines to prevent wax deposition include epoxy, also known as fusion bonded epoxy (FBE); polyurethane; polytetrafluoroethylene (PTFE) or Teflon; and diamond-like carbon (DLC). The physical properties of these coatings influence wax deposition; these properties are surface roughness, thermal insulation, and wettability.
This study experimentally analyzed the effects of epoxy, polyurethane, PTFE and DLC coatings on the reduction of wax deposition. The effects of the surface roughness and thermal insulation of the coatings on wax deposition were also analyzed.
2. Wax Deposition
Paraffin wax is a solid material which is precipitated from petroleum oil when the oil temperature decreases below its WAT. It is a complex substance, consisting of normal-paraffin, iso-paraffin, and cyclo-paraffin; the chemical formula is CnH2n+2. Wax consists mainly of long linear and chain shaped normal-paraffin, its carbon number ranges from C18~C36, and its crystals exhibit large needle-like and tabular shapes. This wax, consisting of normal-paraffin with a low molecular weight, is defined as paraffin wax or macro crystalline wax. Whereas, wax consisting mainly of iso-paraffin and cyclo-paraffin, which has a higher molecular weight, a carbon number of C40~C60 and smaller unclear crystal forms, is defined as microcrystalline or amorphous wax [2]. When wax is deposited on the inner wall of a pipeline, it decreases the cross-sectional area of that pipeline, causing a pressure drop that decreases the oil production rate. The elimination of wax deposition involves a considerable amount of time and expense, and as a result the operating costs of oil production can increase exponentially. When a pipeline at a sea depth of 100m is blocked, it usually costs about 200,000 USD to clear it. When a blockage occurs at a depth of 400m, the costs can reach approximately 1,000,000 USD. When the production losses caused by the blockage are added to this, the total financial damages can be several million USD. Solid material deposits within a pipeline in the Gulf of Mexico, between 1992 and 2002, accounted for a total number of 51 blockages and a considerable amount of money was spent in resolving the problems [3].
3. Coatings
Tubular coatings are classified into external and internal types. External tubular coatings protect pipelines from environmental and mechanical effects, such as those caused by contact with soil, water, air and solar radiation, all of which cause corrosion. External coatings are selected on the basis of the installation environment, availability, and cost. At the present time, FBE is widely considered to be the reference coating material. For more than 60 years internal tubular coatings have been used in the oil industry to prevent the corrosion of pipelines by carbon dioxide, hydrogen sulfide, oxygen, chloride and acidic components. They have also been used for the hydraulic improvement of fluid flow. In addition, it has been found that internal tubular coatings reduce wax deposition in pipelines in areas where waxy oils are produced. Since that discovery was made, internal tubular coatings have been widely used as a long-term solution for the prevention of wax deposition in pipelines in such areas. Epoxy, polyurethane, PTFE and DLC coatings are the main ones used.
3.1 Epoxy Coating
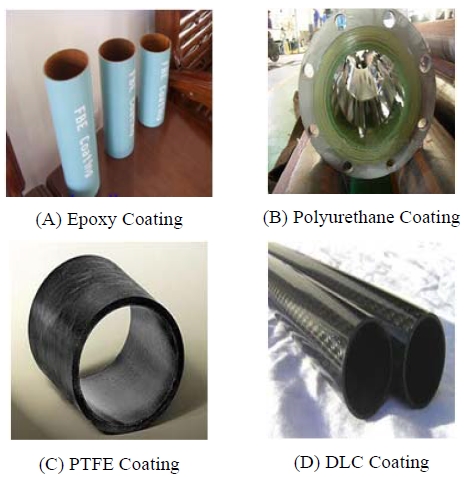
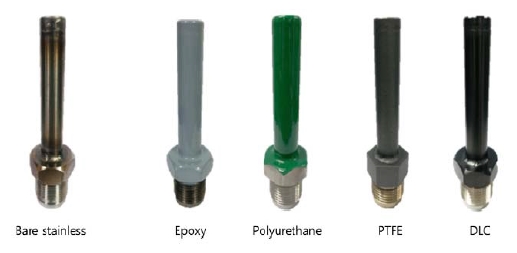
Epoxy, or FBE, is the most widely utilized coating to prevent the corrosion of pipelines used in oil production (Figure 1 (A)). There is an example in the literature, in which wax deposition was reduced due to its thermal insulation and smooth roughness properties [4][5]. In addition, epoxy coatings have characteristics that include improved wear resistance, and thermal stability, and therefore can be used over a long period of time [6]. Epoxy has been used for the internal tubular coating of pipelines and has been suggested as an effective coating to control wax deposition due to its the low free surface energy [7].
3.2 Polyurethane Coating
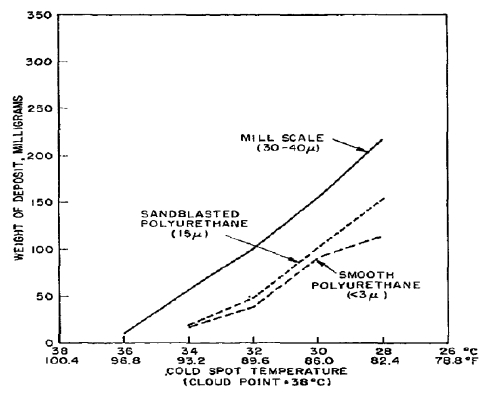
Polyurethane coatings have a high wear resistance and also improved roughness characteristics (Figure 1 (B)) [8]. There is an example in the literature in which wax deposition was reduced by 30% due to this coating’s thermal insulation properties. This was based on a test result of wax deposition by cold spot apparatus [5]. Polyurethane coatings are widely used in the oil industry to control wax and scale deposition; these are factors that prevent flow assurance. The coating is mainly used in pipelines and oil platform risers; it has excellent thermal insulation properties and therefore maintains the temperature of the oil above the WAT.
3.3 PTFE (Polytetrafluoroethylene) Coating
PTFE coatings have a characteristic fluoropolymer that exhibits a low free surface energy. It is expected that PTFE coatings will effectively reduce wax deposition because they have a higher hydrophobicity and oleophobicity than other types of coating (Figure 1(C)) [9]. In general, PTFE coatings form films of both primer and top coating and can therefore be attached to almost any material. They also have cohesionless characteristics that allow them to be easily detached from highly adhesive materials. In addition, they are not affected by chemical environments.
3.4 DLC (Diamond-Like Carbon) Coating
DLC coatings have characteristics such as high wear resistance, a very low friction coefficient and high corrosion resistance. Therefore, they are used for pipe joints and to prevent wax deposition in pipelines in the oil industry (Figure 1 (D)). The testing of wax deposition on DLC coatings indicated that deposition was reduced by 66% and the reason for such a reduction was the low free surface energy of the coating, which is related to its wettability [9].
4. Coating Properties
4.1 Thermal Insulation
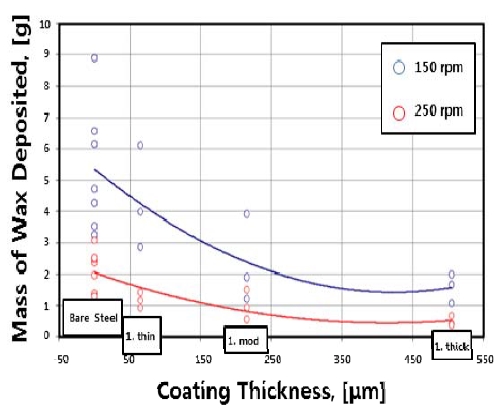
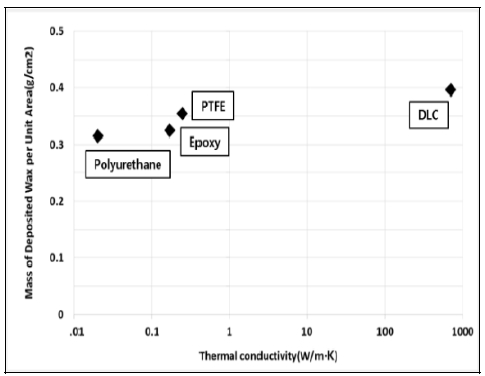
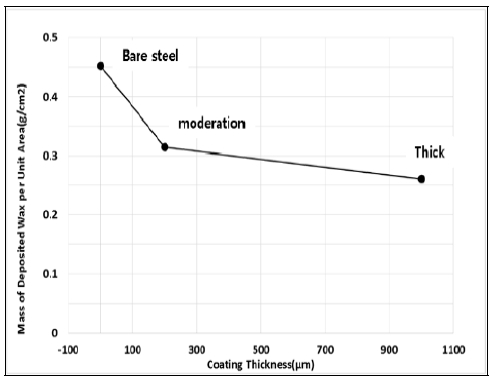
Thermal insulation refers to the prevention of heat transfer and thermal conductivity refers to the property value for the amount of thermal conduction. A low thermal conductivity for a coating can constantly maintain the temperature of the inner wall of the pipeline throughout the whole section. This prevents the oil from decreasing below the WAT [10]. As illustrated in the graph of Figure 2, the thickness of the coating and the wax deposition rate are inversely proportional [11].
4.2 Surface Roughness
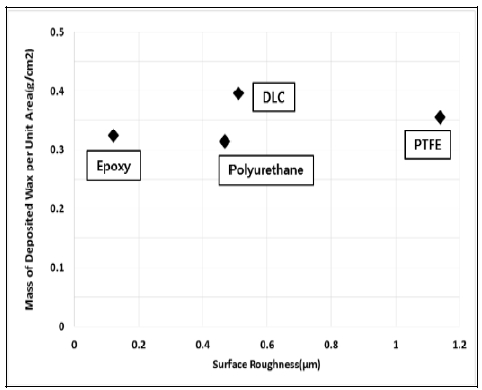
Surface roughness refers to the extent of the fine embosses on a surface. The physical roughness of a pipe surface influences the physical properties of the fluid flow. In general, the change from a smooth surface to a rough one is due to the increase of Reynolds number by the increase of the flow rate. As the surface roughness increases energy loss occurs within the flow system. Therefore, internal tubular coatings are used to minimize both the surface roughness and the pressure required for water or gas injection used in order to increase oil production. As illustrated in Figure 3, the deposition of paraffin wax increases as the surface roughness increases [8]. It was found that the amount of wax deposition on a smooth surface was less than that on a steel pipe surface [12]. In addition, the roughness of a surface provides a substrate where wax deposition can take place [4][13].
5. Experiments
5.1 Oil Properties
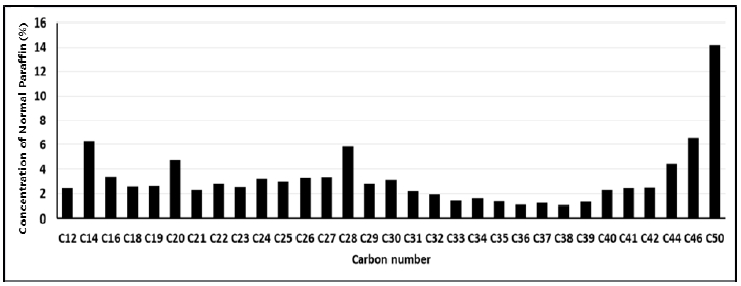
The physical properties of the crude oil sample (Duri) used for analysis are described in Table 1. The density was measured using DM40 density meter (Mattler Toledo). The viscosity was measured using R/S Plus rheometer (Brookfield). The WAT of the oil sample was measured using viscometry. The pour point was measured in accordance with the method described in ASTM-D6749. Gas Chromatographic is used for the compositional analysis and chromatogram of the crude oil is exhibited in Figure 4. According to compositional analysis, the fluid has significant amount of C20 to C30 n-paraffins.
5.2 Cold Finger Apparatus
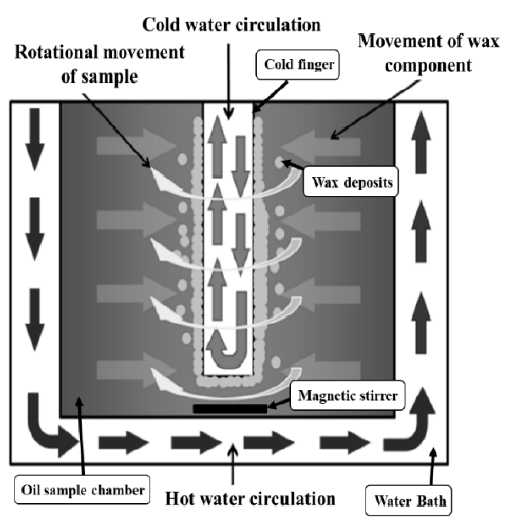
A cold finger apparatus was used to identify the effects of each coating under single flow conditions (oil). Cold finger apparatus was designed to simulate the temperature gradient between the inner wall of the pipeline and the cross section of the flow, and also the shear rate at the wall of the pipeline to the oil flow (Figure 5). The cold finger apparatus consists of a cold finger, chamber, cold finger circulator, heating chamber circulator and stirrer. The cold finger represented the inner wall of the pipeline. The epoxy, polyurethane, PTFE and DLC coatings of the finger were made by dipping and spraying methods (Figure 6). The chamber represented the inner space of the pipeline during the oil production. High temperature water was constantly circulated within the water bath chamber while cold water was circulated within the cold finger. The cold finger circulator was used to maintain a constant temperature of 4℃, which is the minimum temperature of the deep sea. The heating chamber circulator was used to maintain the temperature of hot oil. The stirrer is used to flow of the oil. The chamber temperature of cold finger apparatus was maintained at 60℃, this being higher than the WAT, which was assumed to be higher than 35℃. The temperature of the cold finger was maintained at 4℃. This is the minimum temperature of the deep sea. The magnetic stirrer generates a shear rate while stirring the oil samples at a constant speed to depict the flow of fluids. Testing was carried out for 6 hours, sufficient time for wax deposition.
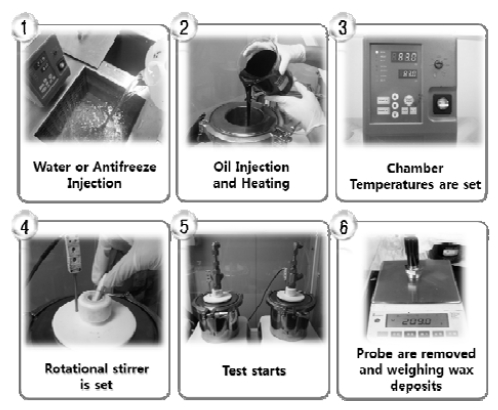
The experimental procedure is illustrated in Figure 7. First, water or antifreeze is injected into water bath. After then, the oil is injected into chamber and heated to melt any wax crystals that might be present. Next, chamber temperatures are set according to the test conditions. Next, rotational stirrer is set. Testing was carried out for 6 hours, sufficient time for wax deposition. Finally, after a test is finished, the probes are removed from the bath and allowed to dry for approximately 30 minutes. Deposited wax samples are the taken directly from probe, weighed, and later analyzed.
6. Results
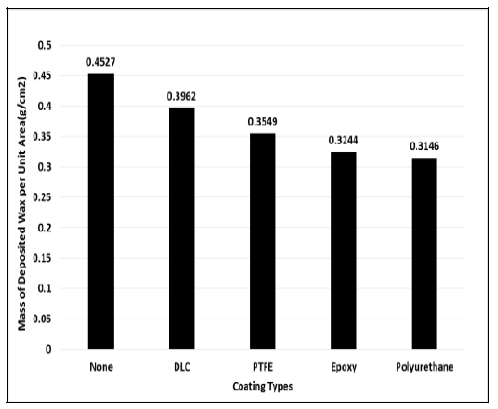
The varying amounts of wax deposition on the probe with no coating, epoxy, polyurethane, PTFE and DLC coatings are shown in Figure 8. The test results indicate that, compared to the bar without coating, the amount of wax deposition was reduced by 30.5% for the polyurethane coating, by 28.3% for the epoxy coating, by 21.6% for the PTFE coating and by 12.5% for the DLC coating. These results demonstrate that internal tubular coatings effectively reduce wax deposition. The amount of wax deposition was reduced on the coated bar because the physical properties of the coated bar surface are different from those of the uncoated stainless steel one. The physical properties of the surface of the bar, such as wettability, surface roughness, thermal insulation, wear resistance, corrosion resistance, electric insulation, thermal resistance, hardness and adhesion, are changed by the coating. Among those coating properties, thermal insulation and surface roughness as properties directly affecting the wax deposition were analyzed and compared the amount of wax deposition according to the coating properties. Surface roughness was measured using a Mahr’s Perthometer 2. Thermal insulation was measured by comparison between the unique properties of the coating, thermal conductivities, and the amount of wax deposition for each coating thickness. The thickness of the two polyurethane coatings was 200 μm and 1,000 μm. The experiments analyzed the amount of wax deposition for each coating thickness.
Figure 9 shows a graph that presents the amount of wax deposition compared with the amount of surface roughness. It indicates that there is no definite trend. It is concluded that surface roughness does not have an important effect on wax deposition, despite being a factor affecting it. Figure 10 shows a graph that presents the amount of wax deposition compared with thermal conductivity. It indicates that wax deposition reduces as the thermal conductivity decreases. It is concluded that the decrease in the thermal conductivity prevents the temperature of the oil from decreasing below the WAT. It is also concluded that thermal conductivity affects wax deposition relatively more than other coating properties do and it can effectively reduce wax deposition. Figure 11 shows a graph that presents the amount of wax deposition compared with the thickness of the two polyurethane coatings. It indicates that wax deposition reduces as coating thickness increases. As thermal conductivity and coating thickness are factors related to thermal insulation, it can be concluded that thermal insulation, of all the properties of internal tubular coatings, is the most influential factor in the changes relating to the amount of wax deposition.
7. Conclusions
This study focused on a number of different internal tubular coatings and used a cold finger apparatus to identify the effect of these coatings on the reduction of wax deposition under single-flow conditions. The result of the study can be summarized as follows.
1. Wax deposition testing under single-flow conditions indicates that the amount of wax deposition on the bar with epoxy, polyurethane, PTFE, and DLC coatings was reduced by up to 30% compared to one with no coating. Therefore it is concluded that internal tubular coatings can effectively reduce wax deposition.
2. The surface roughness property of the coating is a factor affecting wax deposition but the results did not indicate any constant trend. Therefore it is concluded that surface roughness is not an important factor in wax deposition.
3. Testing indicated that the amount of wax deposition reduces as thermal conductivity decreases and coating thickness increases. As thermal conductivity and coating thickness are factors related to thermal insulation, it is concluded that the thermal insulation properties of the coatings are the most influential factors on wax deposition.
These results can be used effectively in internal tubular coating selection for flow assurance in oil fields.
Acknowledgments
This work was supported by the Energy Efficiency & Resources of the Korea Institute of Energy Technology Evaluation and Planning (KETEP) grant funded by the Korea government Ministry of Trade, Industry and Energy (No. 2013251010005C).
This paper is extended and updated from the short version that appeared in the Proceedings of the International symposium on Marine Engineering and Technology (ISMT 2014), held at Paradise Hotel, Busan, Korea on September 17-19, 2014.
References
- J. S. Lim, “Flow assurance technology in petroleum production system”, Journal of Petroleum, 26, p68-65, (2010).
- L. W. Lake, Petroleum Engineering Handbook vol. 1 : General Engineering, SPE, (2006).
-
R. Bagatin, C. Busto, S. Correra, M. Margarone, and C. Carniani, “Wax modeling : There is need for alternatives”, Proceedings of SPE Russian Oil and Gas Technical Conference and Exhibition (SPE 115184), (2008), Available:.
[https://doi.org/10.2118/115184-MS]

-
E. B. Hunt, “Laboratory study of paraffin deposition”, Journal of Petroleum Technology, 14(11), p1259-1269, (1962).
[https://doi.org/10.2118/279-PA]

-
C. C. Patton, and B. M. Casad, “Paraffin deposition from refined wax-solvent systems”, Journal of Society of Petroleum Engineers, 10(1), p17-24, (1970).
[https://doi.org/10.2118/2503-PA]

- J. L. Boyd, and J. E. Freeman, “New ceramic-epoxy technology for oil and gas drilling and production”, Journal of Corrosion 97 (NACE 97071), (1997).
- G. Aspenes, The influence of pipeline wettability and crude oil composition on deposition of gas hydrates during petroleum production, Ph.D. Dissertation, Bergen University, Norway, (2009).
-
R. M. Jorda, “Paraffin deposition and prevention in oil ells”, Journal of Petroleum Technology, 18(12), p1605-1612, (1966).
[https://doi.org/10.2118/1598-PA]

-
K. Paso, T. Kompalla, N. Aske, H. P. Rønningsen, G. Øye, and J. Sjöblom, “Novel surfaces with applicability for preventing wax deposition : A review”, Journal of Dispersion Science and Technology, 30(6), p757-781, (2009).
[https://doi.org/10.1080/01932690802643220]

-
O. L. Owodunni, and J. A. Ajienka, “Use of thermal insulation to prevent hydrate and paraffin wax deposition”, Proceedings of Nigeria Annual International Conference and Exhibition (SPE 111903), (2007), Available:.
[https://doi.org/10.2118/111903-MS]

- S. G. Johnsen, S. M. Hanetho, P. Tetlie, S. T. Johansen, M. A. Einarsrud, I. Kaus, and C. R. Simon, “Studies of paraffin wax deposition on coated and non-coated steel surfaces”, Proceedings of International Conference on Heat Exchanger Fouling and Cleaning, p251-258, (2011).
- F. W. Jessen, and J. N. Howell, “Effect of flow rate on paraffin accumulation in plastic, steel and coated pipe”, Petroleum Transactions, 213, p80-84, (1958).
- T. Zhu, J. A. Walker, and J. Liang, Evaluation of Wax Deposition and Its Control during Production of Alaska North Slope Oils, Technical Report FC26-01NT41248, University of Alaska, U.S.A, (2008), Available: http://www.osti.gov/scitech/biblio/963363/.
- S. Y. Back, P. S. Kang, S. R. Yu, H. S. Kim, J. H. Park, and J. S. Lim, “Wax appearance temperature measurement of opaque oil for flow assurance in subsea petroleum production system”, Journal of Korean Society of Marine Engineering, 36(1), p185-194, (2012).

