Dynamic characteristics analysis of ship model considering RDP system
Copyright ⓒ The Korean Society of Marine Engineering
This is an Open Access article distributed under the terms of the Creative Commons Attribution Non-Commercial License (http://creativecommons.org/licenses/by-nc/3.0), which permits unrestricted non-commercial use, distribution, and reproduction in any medium, provided the original work is properly cited.
Abstract
A verification of ship maneuvering performances to avoid collision has been studied in various types of mathematical model implementations. It is difficult to simulate the effects of the operation according to the dynamic characteristics of the actual propulsion system only with the simple theoretical approach and the experimental technique. This paper presents a development of a mathematical ship model to simulate dynamic characteristics and the ship maneuvering performances considering the propulsion system. The conventional simple model and the integrated model considering the propulsion system are compared and analyzed in PSIM environment. The performance comparison of the models was confirmed by the initial turning test, steady turning test, yaw checking test and stopping ability at the design speed of ship.
Keywords:
Rim driven propulsor, Hybrid power supply, Ship maneuvering, Speed control, Position control1. Introduction
In accordance with the Kyoto Protocol of the United Nations Framework Convention on Climate Change (UNFCCC), the International Maritime Organization (IMO) has been developing various legal measures for reduction of reduce greenhouse gas emissions by ships and this measure could be classified as technical, operational, and market-based measures [1]. A goal of up to 30% reduction in CO2 emissions by ships by 2025 has been set, while the Energy Efficiency Design Index (EEDI) has been set as a mandatory requirement that has been applied to all ships built since 2013 [2]. Consequently, the need for research on the development of energy efficiency improvement technology for ships has emerged.
The conventional mechanical propulsors (CMP) for ships drive the propellers connected to shafts, gearboxes and bearings in the ships through diesel or gas turbines. However, mechanical propulsors have the disadvantages of large friction loss, occupying large space inside the engine room, high shipbuilding cost, and generating noise and vibration. Podded propulsors, which have been researched since 1990, offers many advantages over CMPs, including low noise, vibration, and fuel consumption; shipbuilding cost savings; occupying less space; elimination of rudder and shaft; uniform fluid drag, and improved maneuverability. On the other hand, podded propulsors have the disadvantage of low propulsion efficiency due to the pod having a long length and a large diameter [3].
The rim driven propulsor (RDP) system uses propellers driven by a structurally integrated motor with no shaft or gearbox for driving torque transfer. As compared to the mechanical and podded propulsors, the RDP offers the advantages of compact design setup and layout; high motor efficiency and fast speed control; high hydrodynamic efficiency; and using seawater for self-cooling of heat generated in the motor and bearings. Moreover, the RDP is effective in improving the energy efficiency of ships [4].
In the initial design stage of ships with RDP system, it is necessary to test the basic performance according to the selected design and specifications of the components, such as the hull, power supply system, turning system, motor, and propeller, while testing is also needed for ship maneuverability for collision prevention when the RDP system is applied to the ship. Various types of mathematical models have been researched to test ship maneuvering performances based on theoretical approach and experimental techniques [5][6]. The theoretical approaches can be generally classified into two types: whole ship model and mathematical modeling group (MMG) model.
The whole ship model, also called Abkowitz model, is a method for expressing hydrodynamic force and moment by implementing a regression model that treats the ship as a complete entity and the forces acting upon it, where the kinematic and geometric variables are expressed as a Taylor series. The MMG model accounts for the total hydrodynamic force acting on the ship by considering the hull, rudder, propeller, and engine as individual modules [7][8]. The MMG model is useful for initial design and verification stage because it has the advantage of changes to the parameters of individual modules, such as the hull, propeller, and rudder, do not affect the other modules. However, the MMG model may show motion response that is different than actual ship maneuvering performance because it assumes ideal motions without considering the dynamic characteristics of propulsion systems. Accordingly, in the present study, PSIM was used to implement an integrated model which is an upgraded version of a MMG model of ship that considered the dynamic characteristics of propulsion systems. In addition, the integrated model was compared and analyzed against a simple model with respect to initial turning ability, steady turning ability, yaw checking ability, and reversing performance for verification of ship maneuvering performance.
2. MMG Model of Ship
2.1 Configuration of RDP system
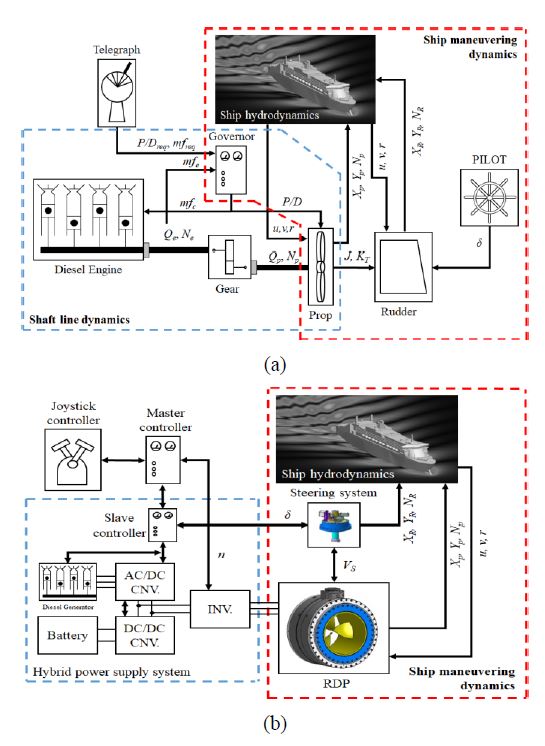
Figure 1 compares the configuration of CMP and RDP ships. The CMP ship consists of a diesel engine for propulsion power of the ship, gearbox for reduction of engine revolutions per minute (rpm), propeller for thrust generation, rudder for ship direction control, and a speed regulator for regulating diesel engine speed. The RDP ship consists of a hybrid power supply system comprising a diesel generator for power supply, AC/DC converter, bidirectional DC/DC converter, and battery; a hub-less propeller for thrust generation; a permanent magnet-type synchronous motor for propeller driving; an inverter for driving the permanent magnet-type synchronous motor; and a turning system for maneuvering the ship. By adding a hybrid power supply system, the power consumption due to idling of the diesel engine can be reduced by charging the battery.
2.2 Motion equation of ship
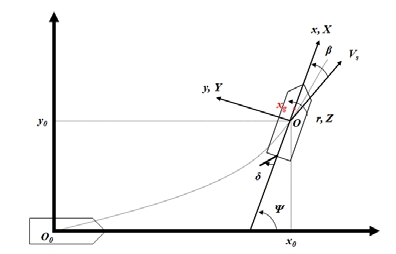
As shown in Figure 2, the motion equation of ship can be expressed by the earth fixed coordinate system for defining the position of the ship and a fixed coordinate system consisting of Surge (X), Sway (Y), and Yaw (Z) of the ship [9].
δ represents the rudder angle; Vs represents the ship velocity; ψ represents the heading of the ship in the earth fixed coordinate system; and β represents the drift angle. The motion equation in the earth fixed coordinate system can be expressed as follows [10]:
| (1) |
Here, m and Iz represent the ship mass and mass moment of inertia, respectively; u and v represent the longitudinal and transverse velocities, respectively; and represent the rate of change in velocity over time; xg represents the center of gravity of the ship; r represents the angular velocity of the rotation relative to the ship’s center of gravity; and represents the rate of change in angular velocity over time.
The differential motion equation of ship can be obtained by numerical analysis of the ship maneuvering movement components u(t), v(t), and r(t). With respect to predicting the ship maneuvering performance, the force, acceleration, and velocity of the ship could be obtained by the Euler equation based on the ship parameters and hydrodynamic coefficients in 3 Degree of Freedom (DOF) for evaluating the forces and moments acting on the ship, while the location and orientation of the ship could be calculated by numerical integration. The longitudinal and transverse distances and heading angle can be expressed as follows [10]:
| (2) |
The hydrodynamic forces and moments acting on the ship, which are individual components of MMG model can be expressed by the following components [11][12]:
| (3) |
Here, subscripts H, P, and R represent the ship, propeller, and rudder.
2.3 Hydrodynamic force of the ship
The hull force can be expressed by a hydrodynamic derivative model that demonstrates the characteristics of the hull shape and hydrodynamic forces and moments acting on the hull can be expressed as follows [10]:
| (4) |
Here, m´x and m´y represent additional mass in longitudinal and transverse directions, respectively; I´z represents additional mass moment of inertia; ´ represents a dimensionless value; X´(0) represents the viscous hydrodynamic coefficient of surge force; X´vv, X´vr, X´rr, and X´vvvv represent the nonlinear viscous hydrodynamic coefficients of surge force; Y´v, Y´r, Y´vvv, Y´vvr, Y´vrr, and Y´rrr represent the nonlinear viscous hydrodynamic coefficients of sway force; and N´v, N´r, N´vvv, N´vvr, N´vrr, and N´rrr represent the nonlinear viscous hydrodynamic coefficients of yaw force.
2.4 Hydrodynamic force of propeller
The hydrodynamic forces and torque of propeller can be expressed as follows [10]:
| (5) |
Here, t represents the thrust reduction coefficient of propeller; KT(J) and KQ(J) represent the thrust coefficient and torque coefficient of propeller, respectively; J represents the progress coefficient of propeller; Va represents the velocity of ship to which the thrust reduction coefficient is applied; DP represents the diameter of propeller; ρ represents the density of water; n represents the rpm of propeller; Y*P and N*P represent the pitch coefficient of propeller. Meanwhile, Yp and Np are ignored because their effect of ship maneuverability is negligible.
2.5 Hydrodynamic force of rudder
The hydrodynamic forces of rudder can be expressed as follows [10]:
| (6) |
Here, tR represents the steering resistance reduction coefficient, αH represents the rudder force increase coefficient, xH represents the rudder coordinate, xR represents the longitudinal coordinate of the action point of the additional lateral force component induced by steering, and FN represents the vertical force of rudder.
3. Implementation of MMG Model
The ship maneuvering performance simulation was implemented using PSIM, a power electronics simulation program. The hull, propeller, and rudder modules were used as sub-circuits. The rudder angle and the propeller speed, which are controlled variables, were configured to be able to derive the output characteristics according to variations.
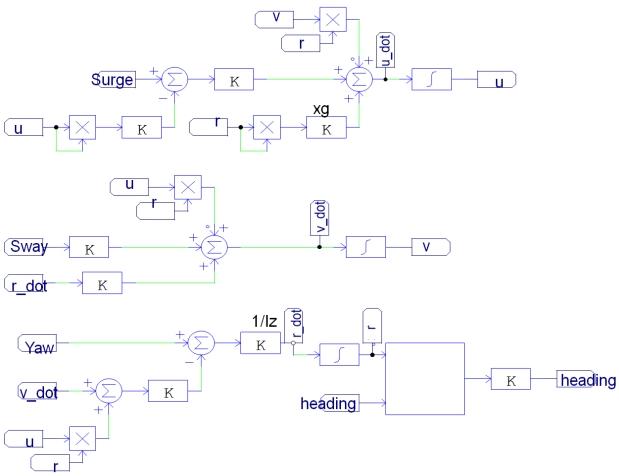
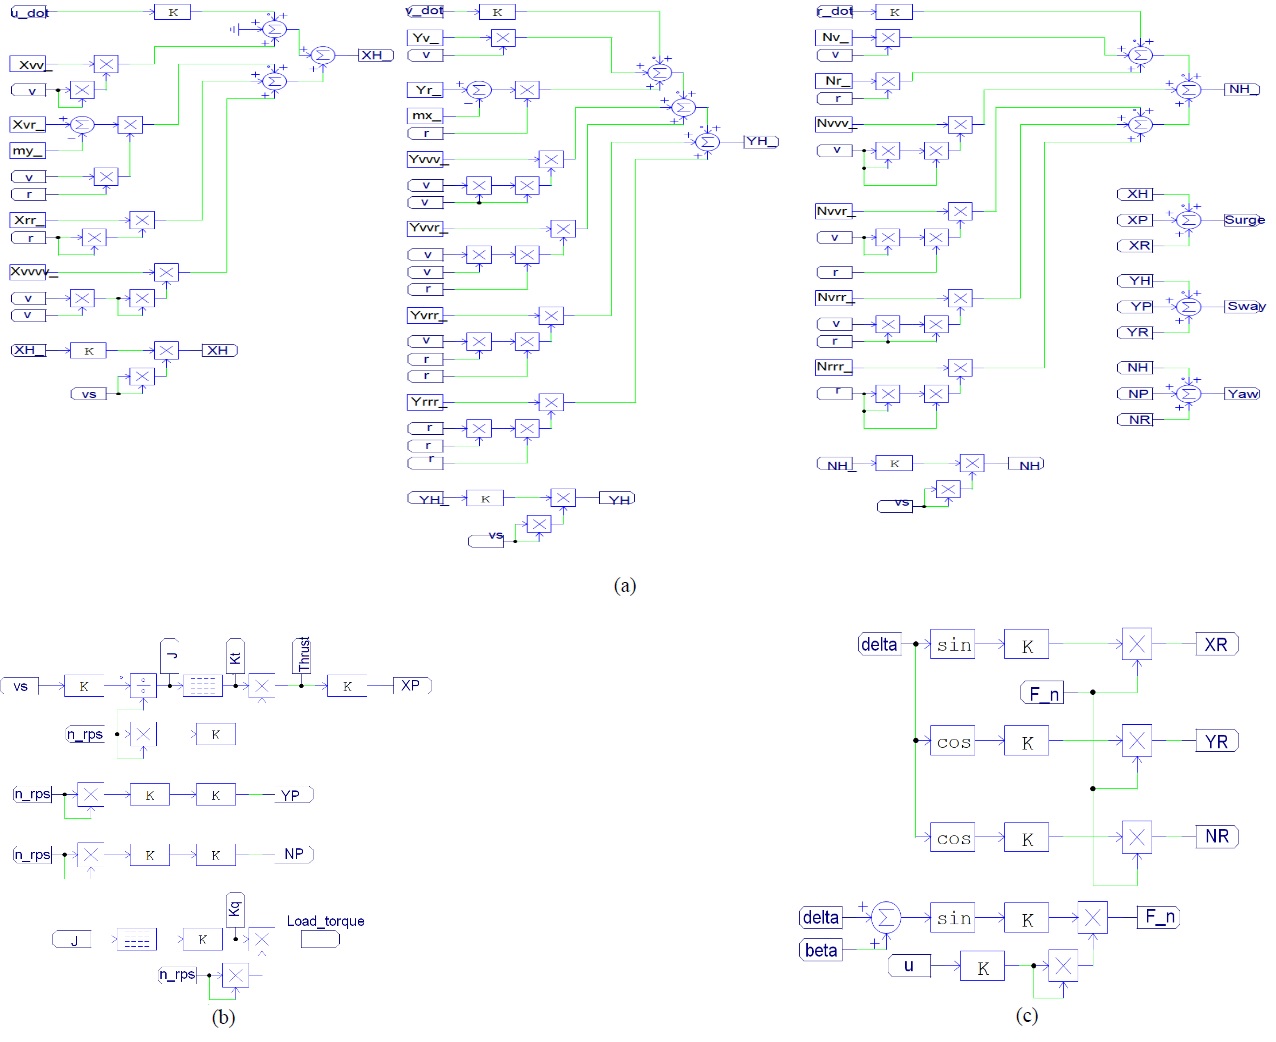
Figure 3 shows the 3 DOF motion equation module using Equation (1) and (2). Figure 4 shows the hydrodynamic force equation modules of the hull, propeller, and rudder using Equation (4), (5), and (6).
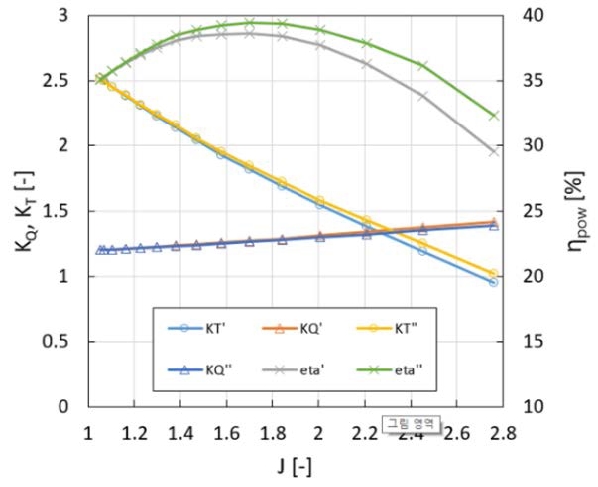
Table 1 and Figure 5 show the previously studied hub-less propeller specifications and thrust coefficient curve of the CFD analysis model [13][14]. Table 2 and Table 3 show the calculation results of input and output characteristics of the ship using the basic specifications of the ship and KT and KQ coefficients, while the estimation coefficient of Esso tanker was used for the hydrodynamic coefficient of ship [15]. At the propeller speed of 500 rpm, the thrust was 6755N and the load torque of the motor was 1386.4Nm. The coefficient values were converted into variables and applied to the ship model.
4. Implementation of Integrated Model
4.1 Selection of the specifications for the hybrid power supply system
The hybrid power supply system consisted of a diesel generator for power generation, a 3-phase diode rectifier for rectifying the 3-phase AC output of generator as DC power, and a bidirectional DC/DC converter for battery charging/discharging. Table 4 shows the specifications of the hybrid power supply system. The rated output of the diesel generator was 100kW and fixed speed operation was carried out at a rated speed of 1800 rpm. The rated voltage outputted through the generator was 380V AC. The rated power of the bidirectional DC/DC converter was selected as 75 kW considering the specifications of the RDP drive system. The high voltage side was set to 537±10% considering the output voltage variation of the 3-phase diode rectifier, whereas the low voltage side was set to 259~294V based on the battery voltage. The battery capacity was set to 75 Ah considering the sole power supply and operating time of the RDP drive system.
4.2 Selection of the specifications of the RDP drive system
Table 5 shows the appearance, basic specifications, and parameters of the RDP drive motor.
It is a 3-phase surface-mounted permanent magnet synchronous motor (SPMSM), with rated power of 75kW, rated speed of 500rpm, and rated current of 240A. The vector control was applied to the motor since the operating mode required sinusoidal control.
4.3 Selection of the specifications of the turning system
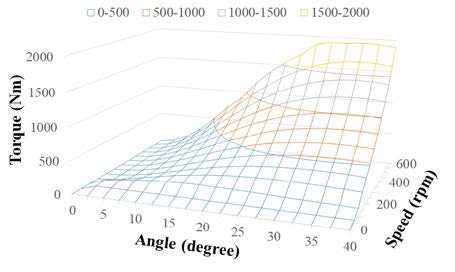
Figure 6 shows the torque curve according to the rudder angle of the ship model and the rotational speed of the RDP drive system. At rudder angle of 35° and the rotational speed of 500 rpm, the torque was 1431 Nm. At the maximum torque of 1931 Nm, the rudder angle was 35° and the rotation speed was 600rpm. The specifications of the turning system considering the maximum torque are as shown in Table 6. The specifications of the motor were ultimately selected by setting the gear ratio to 1:20 and location control was applied.
4.4 Simulation of the integrated model
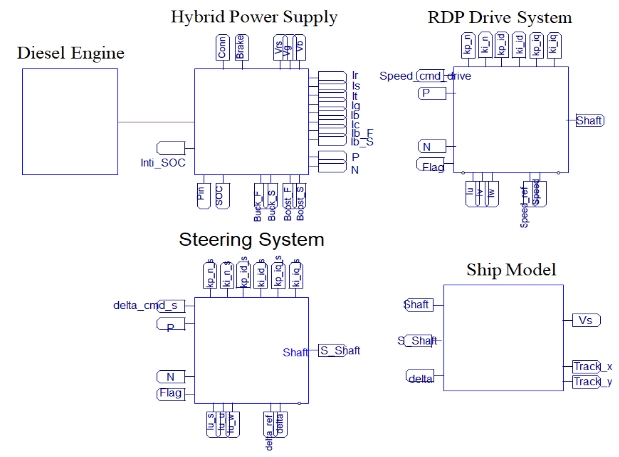
Figure 7 shows the simulation circuit of the integrated model for the RDP system. The RDP system consisted of a diesel engine, a hybrid power supply system, an RDP drive system, a turning system and a dynamic ship model. The circuit was simplified by configuring each component as a sub circuit.
5. Simulation Results of the Integrated Model
5.1 Analysis of the dynamic characteristics of the propulsion system
To select the controlled variables of the propulsion system, simulation of the dynamic characteristics for each component was performed as shown in Figure 8.
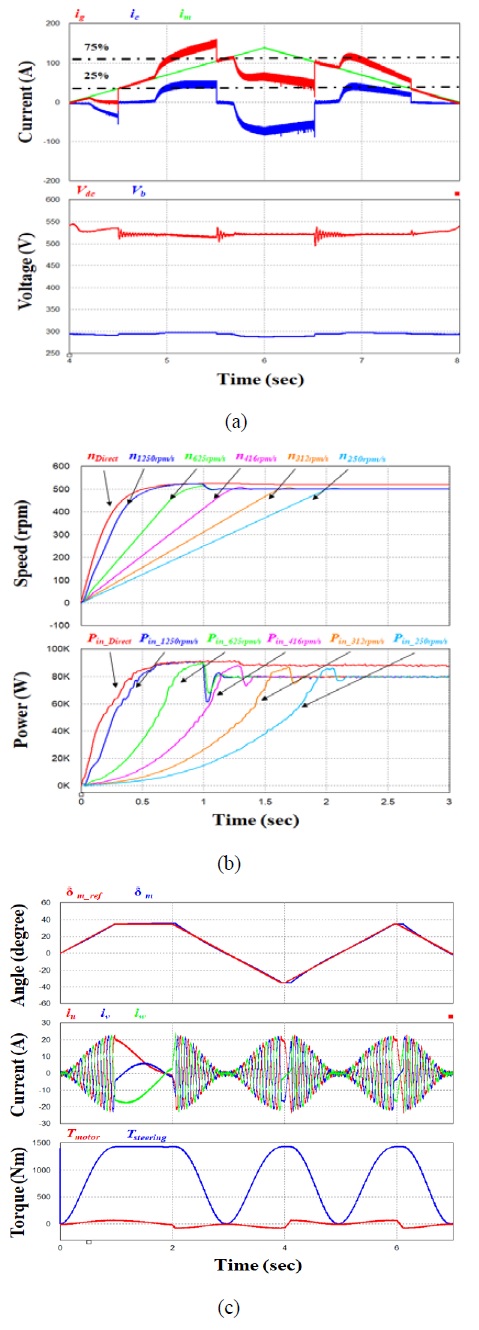
Dynamic characteristic analysis of RDP system (a) Hybrid power supply (b) RDP driven system (c) Steering system
Figure 8 (a) shows the simulation results by load of the hybrid power supply system. At load ≤ 25%, the battery supplied all of the power to the load. At load < 75%, the diesel generator supplied all of the power to the load and the surplus power was supplied to the battery for charging. At load ≥ 75%, the diesel generator and battery each supplied 50% of the power to the load.
Figure 8 (b) shows the speed and power response characteristics according to the slope of the speed command ramp function. Fast speed response was found at direct input of command, 1250rpm/s, and 625rpm/s. However, the instantaneous maximum input power was approximately 90kW and the average power consumption for 3 sec was ≥ 60kW or higher, indicating a large load for the power supply system. At 416rpm/s, 312rpm/s, and 250rpm/s, the speed response showed the same transient state except for the arrival point. The instantaneous input power was approximately 85kW and the average power consumption for 3 sec was ≤ 60kW, requiring approximately ≤ 60% load from the power supply system. The slope of the speed command ramp function with the smallest average power consumption and the most stable transient response was selected as 250rpm/s.
Figure 8 (c) shows the simulation results for the turning system. When the slope of the angle command ramp function was selected as 35°/s. Phase current and torque of steering motor, torque of steering system are stable according to the command change of rudder angle +35° ~ -35°.
5.2 Analysis of dynamic characteristics of the integrated model
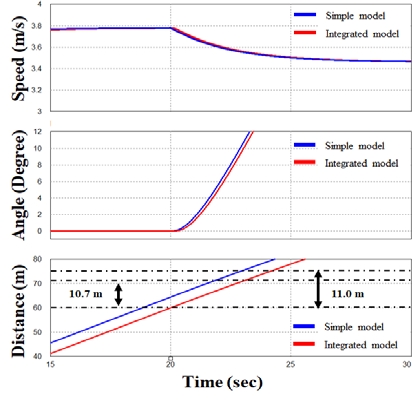
Figure 9 shows the initial turning ability simulation results of the simple model and the integrated model using the RDP system. After setting the rudder angle to 10° at 20 sec after reaching the speed of 3.77m/s, which is 85% of the maximum speed of the ship, the distance traveled by the ship until reaching a heading of 10° was 1.07 L (10.7 m) for simple model and 1.1 L (11.0 m) for integrated model, respectively, showing a difference of approximately 0.03 L.
Figure 10 (a) shows the results of the motor speed response, phase current, and torque of the RDP drive system in steady turning ability simulation. For the motor speed, 425 rpm, which is 85% of the rated speed of 500 rpm, was stably followed according to the ramp command function. Meanwhile, the torque was approximately 1000 Nm at 425 rpm, and when the rudder angle of 35° was ordered, the torque decreased and converged at approximately 950 Nm.
Figure 10 (b) shows the results of the motor speed response, phase current, and torque of the turning system in steady turning ability simulation. At 20 sec after the ship reached the speed of 85%, the rudder angle of 35° stably followed according to the ramp command function. The torque of the turning motor was maintained at approximately 1125 Nm past the transient state.
Figure 10 (c) shows the results of surge, sway, and yaw of the ship in steady turning ability simulation. At rudder angle of 0°, the surge was 4000N, but when the rudder angle was order to 35°, the surge of approximately 1500 N, sway of approximately 2400 N, and yaw of approximately 2500 N were maintained beyond the transient state. The thrust of propeller was approximately 4000 N at rudder angle of 0°, but when the rudder angle was order to 35°, the thrust increased to approximately 4800 N due to sway and yaw, while the speed of the ship decreased from 3.77m/s to 2.1m/s.
Figure 11 (a) shows the results of comparing steady turning ability simulations between the simple model and integrated model using the RDP system. The ordinate at the 90° turning point was 3.19 L and 4.15 L, respectively, indicating an increase of approximately 0.96L. The tactical diameter of the maximum turning circle at the 180° turning point was 4.44L and 4.48L, respectively, indicating an increase of 0.04 L.
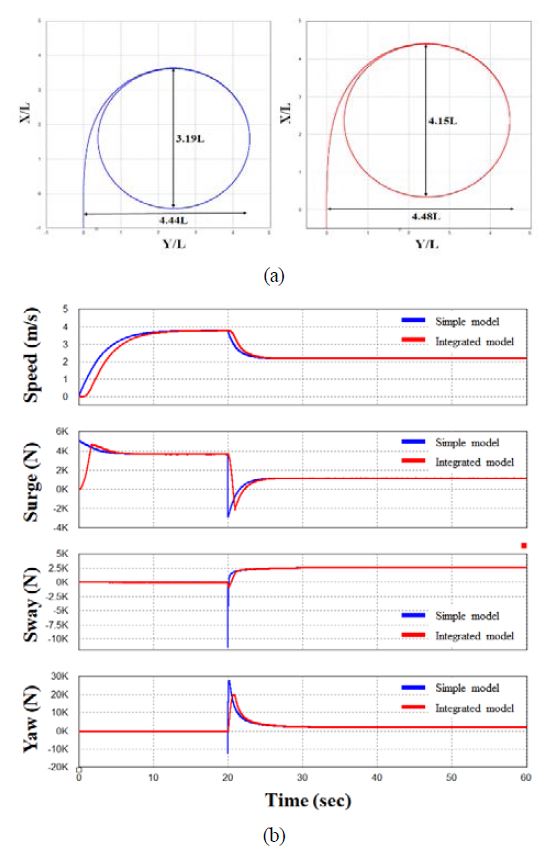
Comparison of simple model and integrated model at steady turning test (a) Turning circle (b) Speed, surge, sway, yaw
Figure 11 (b) shows the simulation results of speed, surge, sway, and yaw of the ship for the simple and integrated models. The speed of ship was slower in the integrated model than the simple model due to the consideration of the response from the RDP drive system. The surge, sway, and yaw became slower due to the consideration of response from the turning system, while the transient state became smaller.
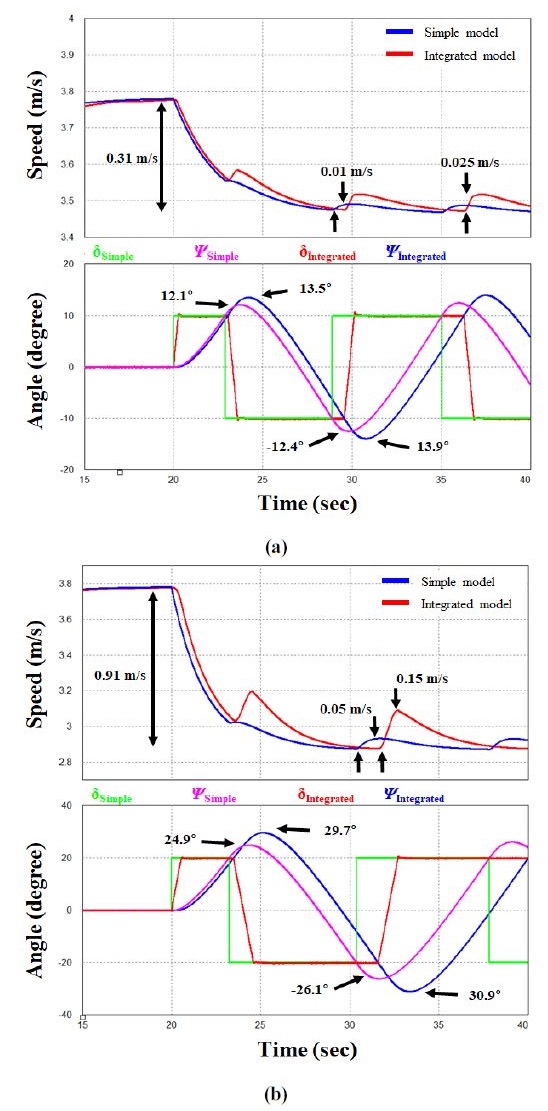
Figure 12 (a) shows the results of zigzag 10°/10° simulations with the simple and integrated models. When the ship began to turn at 3.77m/s, which is 85% of maximum speed of the ship, the decrease in speed was same for both models with 0.31 m/s, but the amount of change in speed in the simple and integrated models was 0.01 m/s and 0.025 m/s, respectively, showing a larger decrease in the integrated model. The first overshoot angle was greater by approximately 1.4° in the integrated model (13.5°) than the simple model (12.1°), while the second overshoot angle was also greater by approximately 1.5° in the integrated model (13.9°) than the simple model (12.4°).
Figure 12 (b) shows the results of zigzag 20°/20° simulations with the simple and integrated models. When the ship began to turn at 3.77m/s, which is 85% of maximum speed of the ship, the amount of decrease in speed was same for both models with 0.91 m/s, but the amount of change in speed in the simple and integrated models was 0.05 m/s and 0.15 m/s, respectively, showing a larger decrease in the integrated model. The first overshoot angle was greater by approximately 4.8° in the integrated model (29.7°) than the simple model (24.9°). The second overshoot angle was also greater by approximately 4.8° in the integrated model (30.9°) than the simple model (26.1°).
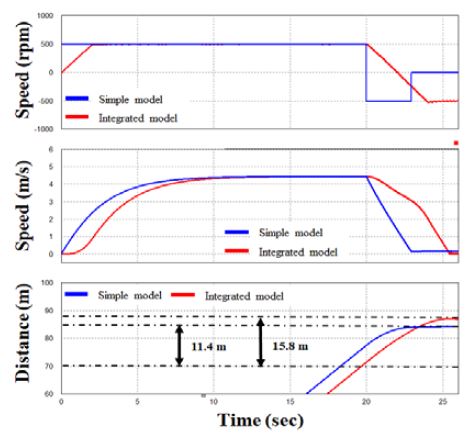
Figure 13 shows the results of reversing performance simulations with the simple and integrated models. The stopping distance in the simple and integrated models was 1.14 L (11.4 m) and 1.58 L (15.8m), respectively, showing an increase of approximately 0.44L as compared to the simple model.
Table 7 shows the results of comparison of ship maneuvering performance between the simple integrated models. The results confirmed that response characteristics of the integrated model that considered the dynamic characteristics of the system were lower than those of the simple model with respect to ship maneuvering performance.
6. Conclusion
Verification of the maneuvering performance for avoiding collisions is critical in the initial design stage of ships. Conventional mathematical models have been implemented with the focus on the hydrodynamics of the ship body, and consequently, the results may vary in comparison to actual ships with propulsion systems. Accordingly, the present study proposed an integrated model to consider the dynamic characteristics of ship propulsion systems and verified the performance of ships based on initial turning ability, steady turning ability, yaw checking ability, and reversing performance through simulations. The results confirmed that the maneuvering performance of a ship is not determined solely by the body of the ship, and that the dynamic characteristics of the propulsion system affect the maneuvering performance. It is believed that the findings in this study may be useful for effectively selecting controlled variables and verifying the control algorithm in simulations using an integrated model when developing an operational control algorithm for the upper controller for ship operation prior to onboard testing after shipbuilding.
Acknowledgments
This study was conducted as part of the “Development of the 150kW Rim Driven Electronic Propulsion System for Small Vessels” project sponsored by the Ministry of Trade, Industry and Energy and the Korea Institute for Advancement of Technology” [No. P0002106].
Author Contributions
Conceptualization, S. A. Kim; Methodology, G. P. Hong; Project Administration, S. K. Lee; Visualization, K. H. Kang name; Supervision.
References
- T. H. Jung, S. G Kang, J. G Lee, and J. G Ahn, "International maritime organization (IMO) ship GHG emission regulation trends and domestic and foreign measures," Journal of the Society of Naval Architects of Korea, vol. 55, no. 4, pp. 48-54, 2018 (in Korean).
- G. H. Kang and S. D Kim, “Electric propulsion ship technology trend and power consumption analysis according to ship,” The World of Electricity(Journal from the Korean Institute of Electrical Engineers), vol. 66, no. 7, pp. 13-20, 2017 (in Korean).
-
X. Yan, X. Liang, W. Ouyang, Z. Liu, B. Liu, and J. Lan, “A review of progress and applications of ship shaft-less rim-driven thrusters,” Ocean Engineering, vol. 144, pp. 142-156, 2017.
[https://doi.org/10.1016/j.oceaneng.2017.08.045]

- M. Lea, D. Thompson, B. Van Blarcom, J. Eaton, J. Friesch, and J. Richards, “Scale model testing of a commercial rim-driven propulsor pod. Journal of ship production,” vol. 19, no.2, pp. 121-130, 2003.
-
G. Neser and D. Ünsalan “Dynamics of ships and fenders during berthing in a time domain,” Ocean Engineering, vol. 33, no. 14-15, pp. 1919-1934, 2006.
[https://doi.org/10.1016/j.oceaneng.2005.10.020]

-
S. Sutulo, L. Moreira, and G. Soares, “Mathematical models for ship path prediction in maneuvering simulation systems,” Ocean Engineering, vol. 29, no. 1, pp. 1-19, 2002.
[https://doi.org/10.1016/S0029-8018(01)00023-3]

-
M. C. Fang and J. H. Luo, “The Nonlinear hydrodynamic model for simulating a ship steering in waves with autopilot system,” Ocean Engineering, vol. 32, no. 11-12, pp. 1486-1502, 2005.
[https://doi.org/10.1016/j.oceaneng.2004.09.008]

- Y. Yoshimura, “Mathematical Model for Maneuvering Ship Motion (MMG Model),” Workshop on Mathematical Models for Operations involving Ship-Ship Interaction, Tokyo, Japan, 2005.
-
G. W. Lee, S. Surendran, and S. H. Kim, "Algorithms to control the moving ship during harbour entry," Applied Mathematical Modelling, vol. 33, no. 5, pp. 2474-2490, 2009.
[https://doi.org/10.1016/j.apm.2008.07.012]

- H. Y. Lee and S. S. Shin, "Approximate technique for ship's maneuverability prediction," Journal of the Society of Naval Architects of Korea, vol. 35, no. 4, pp. 19-26, 1998 (in Korean).
-
Q. Zhang, X. K. Zhang, and N. K. Im, "Ship nonlinear-feedback course keeping algorithm based on MMG model driven by bipolar sigmoid function for berthing," International Journal of Naval Architecture and Ocean Engineering, vol. 9, no. 5, pp. 525-536, 2017.
[https://doi.org/10.1016/j.ijnaoe.2017.01.004]

- L. S. Ping, "Hydrodynamic coefficients of maneuvering for small vessels," Faculty of Mechanical Engineering, University of Teknologi, Malaysia, 2004.
-
A. F. Molland, S. R. Turnock, and D. A. Hudson, Ship Resistance and Propulsion: Cambridge University Press, 2017.
[https://doi.org/10.1017/9781316494196]

-
D. Y. Kim and Y. T. Kim, "Fundamental design of a 75-kW-rim-driven propeller," Journal of the Korean Society of Marine Engineering, vol. 43, no. 1, pp. 31-39, 2019.
[https://doi.org/10.5916/jkosme.2019.43.1.31]

- H. Kobayashi, J. J. Blok, R. Barr, Y. S. Kim, and J. Nowicki, “Specialist committee on Esso Osaka: Final report and recommendations to the 23rd ITTC,” Proceedings of the 23rd International Towing Tank Conference, pp. 8-14, 2003. [online].

