Explosion analyses of the enclosed cargo handling spaces in oil tankers and FPSOs
Copyright ⓒ The Korean Society of Marine Engineering
This is an Open Access article distributed under the terms of the Creative Commons Attribution Non-Commercial License (http://creativecommons.org/licenses/by-nc/3.0), which permits unrestricted non-commercial use, distribution, and reproduction in any medium, provided the original work is properly cited.
Abstract
Risk associated with hydrocarbon leakages in enclosed hazardous areas, such as a cargo pump room, could result in the fatal explosion and casualties. The probability of fire and explosion in enclosed cargo handling spaces is higher than other areas due to the potentially large hydrocarbon inventory and limited ventilation capability. Accordingly, the explosion study is essential to determine the consequences of explosion loads on equipment and structural elements. In this paper, deterministic explosion analyses applying the Computational Fluid Dynamics (CFD) are performed based on a cargo pump room in one of Very Large Crude Carrier (VLCC) design. Series of explosion simulations based on various explosive gas cloud sizes and 12 potential ignition locations were performed to investigate the maximum overpressure for each scenario. Several key findings and recommendations are introduced in this paper based on the results of explosion analyses.
Keywords:
Explosion Simulation, Cargo Pump Room, Risk, Oil Tanker, FPSO, CFD1. Introduction
A tragedy cargo pump room explosion in FPSO Cidade de São Mateus in February 2015 [1], which caused the death of nine people and twenty-six wounded, indicates the necessity of risk assessments and studies of explosion consequences prior to finalize the design in enclosed hydrocarbon rich spaces. Oil tankers and FPSOs have many of potentially high hydrocarbon inventory spaces such as a cargo pump room and topside hydrocarbon handling spaces. Generally, the accidental scenario of the cargo pump room explosion is not considered in the structural boundary and bulkhead design which surrounding the cargo pump room. However, if the accident happened, the risk to onboard crews may be higher than other areas as this space is located near the accommodation space and engine control room in case of converted FPSOs from oil tankers and typical crude oil tankers. Accordingly, it is worthwhile to investigate the results of explosion load based on different gas cloud sizes and locations in enclosed cargo pump room spaces to find consequences and recommend possible design improvements to minimize consequences. There were some valuable efforts to predict the associated hazards resulting from accidental leakages in enclosed spaces based on CFD simulations and experimental test [3][15][18]. Other important investigations had been performed to determine the design explosion loads based on CFD simulations in offshore facilities & structures [10][11][13][16], and to find fire risks and associated heat loads on offshore topside facilities recently [2][14]. Since the FPSO pump room explosion incident in Cidade de São Mateus in 2015, it is obvious that detail studies of the explosion cases in cargo pump room are required to investigate and understand the effect of explosion on surrounding structures and different elevations based on various hydrocarbon leakage rates and locations. However, as far as the author’s knowledge there is no literature or paper to fully investigate the potential cargo pump room leakage scenario, ventilation and explosion study, and consequences based on similar size, arrangement and case of the Cidade de São Mateus FPSO incident which are important to quantify the consequences and develop mitigation measures to prevent similar catastrophic events in the future.
In this study, it has been performed gas dispersion simulations followed by deterministic explosion analyses based on the enclosed and complex cargo pump room space to determine overpressures of equipment, deck floors, walls and bulkheads within the pump room. The CFD tool FLACS [6] has been utilized to determine explosion deterministic loads. Various leakage rates, gas cloud sizes, elevations and ignition locations in the cargo pump room have been considered to investigate the maximum overpressure due to explosion in each scenario. The detail methodologies, findings, recommendations and future studies are discussed in this paper.
2. Basis of analysis
This section presents the main elements and assumptions which are used for CFD analyses and results. The following configurations have been selected for this study.
- - Targeted air exchange: 20 air changes / h
- - Number of ventilation fans: 2 sets (31600 m3/h x 2 sets)
- - Total ventilation capacity: 63200 m³/h
The CFD software FLACS [6] is applied to calculate explosion consequence in the modeled installation. FLACS is a CFD program for modelling the ventilation, dispersion and explosion consequences in transient full 3D for all typical flammable and toxic release scenarios to assess consequences related to accidental releases as well as investigation of accidents caused by hydrocarbon.
The validation of commercial program is essential and important as the CFD results highly depends on the inputs and the model implemented, and this is a process to check the simulated model accurately represents its mathematical basis. The program needs to be well validated against actual experiments in order to adopt the real cases and simulations. Since 1980, numerous explosion experiments have been performed by Gexcon in collaboration with other groups to further understand explosion phenomena [8]. Gexcon used these experiments for development and validation of the FLACS explosion models. UK HSE has concluded that FLACS is shown to produce reasonably good predictions based on published papers of FLACS validation even though there are some weakness points are observed [7]. Some other FLACS program validations have been performed based on the supporting experimental test data, and found that FLACS can be considered a suitable model to accurately simulate the dispersion and explosion cases [9][12][17].
2.1 Geometry
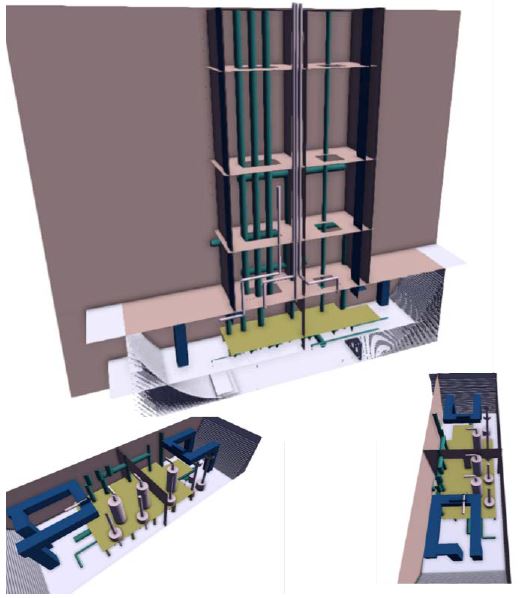
Figure 1 indicates geometry models applied in the CFD simulations. In the simulation, the walkway platform above the tank top floor is assumed as the open grated platform element as this is an industrial best practice to improve the ventilation in lower pump room area.
2.2 Pressure panels and monitor points
Three different types of pressure loads have been used in analyses such as drag loads, local peak pressures and panel pressures. Pressure panels are used to report explosion pressures on surfaces such as walls, floors and bulkheads. Monitor points are used to report local explosion pressures and drag loads on equipment, pipes and similar devices. Drag loads have been used for equipment, supports and pipes up to 1.3m diameter and size. For equipment with a typical dimension greater than 1.3m, the local peak pressure load has been applied.
Pressure panels and monitor points are entities used in FLACS to report overpressures calculated in the explosion simulations. Important parameters regarding those entities are defining pressure panel sizes and monitor point spaces. For instance, if a 4x4 meter size is applied in a simulation, it will average the overpressure over a surface area of 16 m². If a 1x1 meter size panel is applied, the overpressure result will be much more local and higher overpressure will normally be reported. To investigate how sensitive the maximum pressure with regards to the impacted area, three (3) panel model sizes which are 1x1 m, 2x2 m and 4x4 m have been used.
Pressure panels have been allocated on all solid walls, bulkheads and floors. Monitor points are distributed evenly in a grid with 1x1x1 meter in x, y and z directions since it is enough discretized to capture maximum local overpressures. Accordingly, it is possible to verify the maximum overpressures and drags acting on equipment supports and pipes. The resulting pressures monitored at these locations can be applied as inputs to structural response calculation to assess potential damages associated with the explosion. However, these pressures do not consider the leak frequency, ignition probability and shut down of ignition sources, therefore, if such parameters are needed to be considered, a probabilistic analysis must be performed which is not covered in the current study, but may be considered in future studies.
2.3 Gas cloud size
Gas dispersion simulations were performed to obtain inputs for performing credible explosion scenarios. Process simulator DWSIM [4] was used to assess fluid composition after atmospheric expansion due to leakage. It was noted that 15 % of the released liquid is deemed to vaporize, this value was verified from the output of the flash fraction from process simulator from depressurization. In this study, only jet dispersion was modelled since the consequence of the jet dispersion effect is expected to be more critical than a pool vaporization. CFD gas dispersion simulations were performed using FLACS. Nine (9) leak rates were considered such as 1.5, 2.5, 5.0, 6.0, 12.5, 25, 50, 100, 150 kg/s. In fact, the leakage rates over 6 kg/s will be unlikely events under normal cargo pump room operation unless there is an accidental scenario due to dropping heavy objects during operation in pump room which is very low probability to occur. Most of possible leakage scenarios in cargo pump room are small size leakages through pipe flanges and fittings, or equipment connections. Release flow rates based on small size can be considered not more than 6 kg/s in different fluid categories, release pressures and leakage sizes [5]. Therefore, the leakage rates 12.5 kg/s and more can be considered unlikely event under normal cargo pump room operations. The dispersion simulations were considered ventilation rates of the cargo pump room based on 20 air changes.
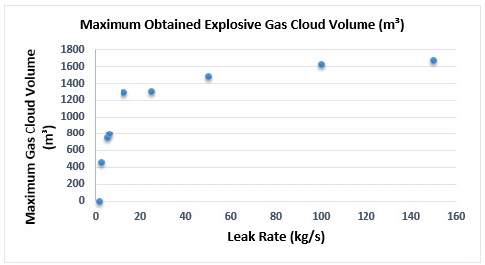
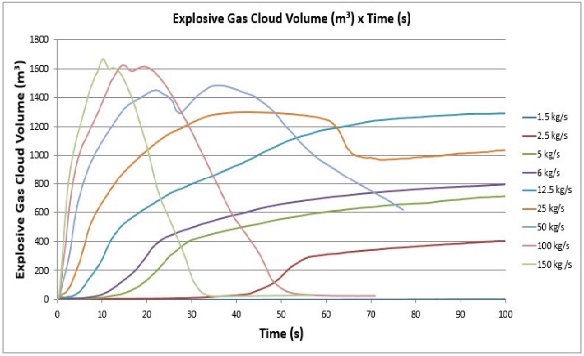
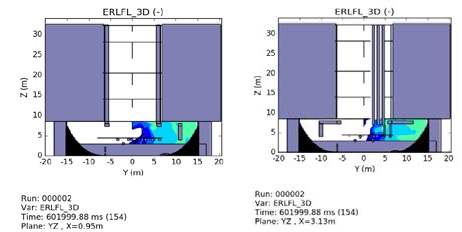
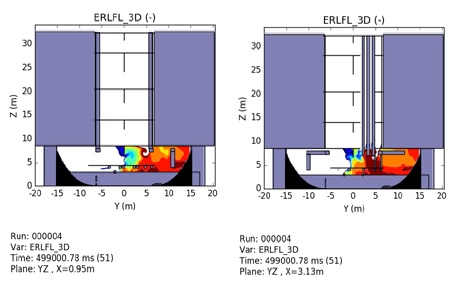
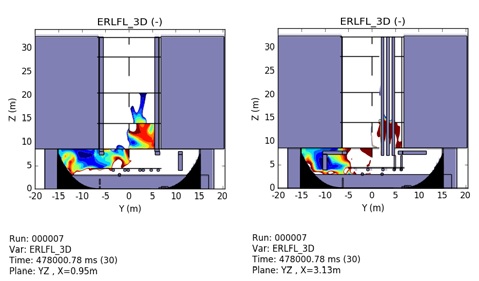
Figure 2 presents that the maximum explosive gas cloud obtained in each explosive gas cloud size while Figure 3 shows the explosive cloud volume transient behavior. It was noted that 12 times increasing on the leak rate (12.5 to 150 kg/s) leads to an increase of only 30% of the maximum gas cloud volume. In large leak rates, the gas cloud becomes very rich, the explosive gas cloud volume (the cloud volume that between the lower flammability limit and the upper flammability limit) is decaying as indicated in Figure 3.
The gas cloud build up for each release can be verified on Figure 3 and observed the followings:
- • For very large leak rates 50 to 150 kg/s, the maximum explosive gas cloud is obtained 10 to 25 seconds after the start of the release, then a sharp decrease was observed due to concentration increase above upper flammability limit (UFL).
- • For release rate at 25 kg/s, sharp cloud build up, then a small decrease is noticed due to diffusion of gas cloud.
- • For leak rates from 1.5 to 12.5 kg/s, it was indicated that cloud increases in an asymptotic behavior and maintain this volume if the leakage persists.
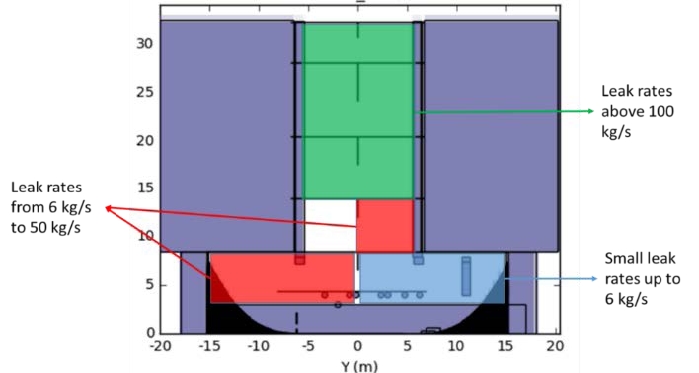
Figure 4 indicates the simulated gas leak locations and leak rates. Details of explosive gas cloud plots are shown from Figure 5 to Figure 7. It is important to state that each offshore installation has its own particulars and design, such as gas compositions, layouts and ventilation designs. Accordingly, the maximum gas cloud size will be different in each case and leakage scenario.
2.4 Wall and floors configurations
In the current assessment, all walls and decks are considered as rigid structures. Any pressure relieving effects of failed decks, walls, or adverse consequences within any adjacent areas caused by failed decks or walls are not accounted for these simulations. Accordingly, the results can be considered as conservative values.
2.5 Explosion simulation cases
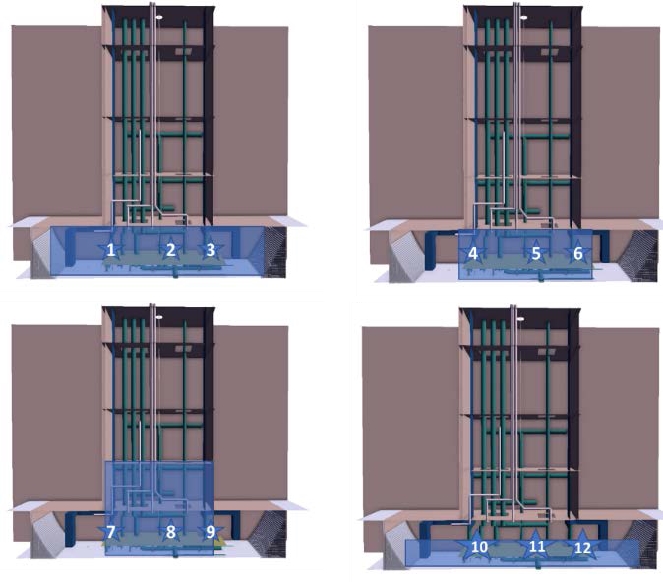
Series of twelve explosion simulations were performed in this assessment. Initially, simulations of nine leak rates were performed applying the representative gas cloud sizes. It is concluded that the leak rate will be from small leakages, which are more likely to be happened than large leak rates. Figure 8 presents the proposed gas cloud locations, shape and ignition locations proposed for CFD explosion simulations based on dispersion simulations performed. Ignition may be initiated near the pumps and equipment in pump room, these locations are considered as the proposed ignition points.
3. Results
Maximum overpressure on walls and decks, as well as on monitor points are reported for each simulation performed. Results are presented each elevation at monitor points and pressure panels.
Table 1 presents all 12 cases simulated, the maximum volume considered for the analyses corresponds to a 6kg/s gas release basis presented on Figure 2, as this leakage amount can be considered as a conservative enough leakage rate under normal cargo pump room operation.
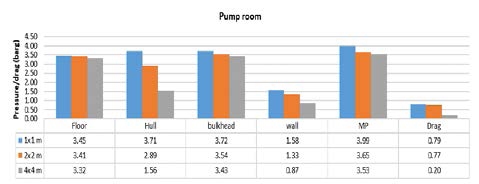
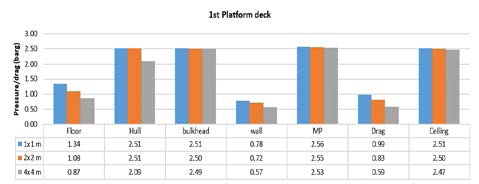
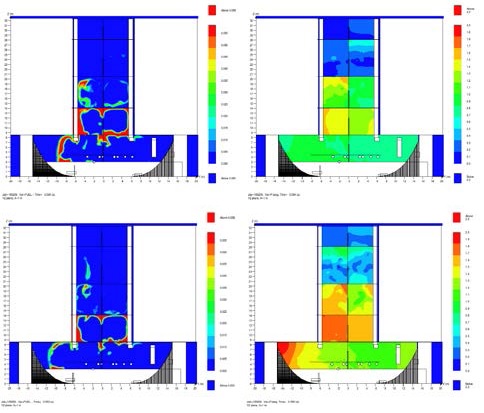
Figure 9 and Figure 10 illustrate maximum overpressures and drags in pump room and 1st platform deck which also indicate different pressures in three different panel model size. The transient development for the case 12 is presented in Figure 11 where it is possible to verify the gas burning path and the overpressure build up during the explosion event. It represents for 0.534 and 0.550 time steps. Pictures in the left shows the fuel (red is stoichiometric concentration and blue is absence of gas) and pictures on right represent the overpressure. This also shows that even after most of the gas is burned, there is still an increase in the overpressure. This is due to the complex geometry that creates several reflections of the pressure wave, thus summing them and creating a pressure wave that lasts much longer than the explosion itself. The enclosed geometry with a single outlet (vent opening at the top of 1st platform) provides a limited pressure relief thereby allowing the overpressure to act in the pump room for a longer period. The results obtained in these simulations are typical for what would be expected from explosion occurring in enclosed regions. The results presented in Table 2 (PP: pressure load in deck floors, MPP: pressure in space, MPD: drag in space), indicate variations among the cases simulated (i.e. changing the gas cloud shapes and ignition locations). It is important to highlight that these analyses are not to provide the dimensioning overpressures, but to investigate the highest explosion overpressures based on assumption given in the modeled cargo pump room. Accordingly, some results might be higher than normal or actual leakage scenarios which could occur during normal FPSO pump room operations.
4. Conclusions
This study has been carried out numerous explosion analyses based on a cargo pump room space in one of VLCC sizes. The numerous findings and recommendations outlined below are intended to enhance the safety of the typical design related to enclosed hydrocarbon contained hazardous areas, especially for conventional cargo pump room configurations.
Based on the results obtained from various analyses, the following conclusions can be addressed:
- • Maximum overpressure inside the pump room, overpressureon walls and bulkheads and drags are found to be 3.99 (case 3), 3.72 (case 3) and 1.64 barg (case 11), respectively.
- • Highest pressure on walls, bulkheads, pressure inside the pump room and drag is found in the pump room above tank top.
- • Results may be various in different fluid compositions,congestion levels and pump room configurations.
The maximum estimated explosion pressures derived in this study may be higher and conservative than actual leakage cases and scenarios which could occur during normal FPSO pump room operations considering actual cargo composition, specific leak rates, gas cloud sizes and release frequencies, viscosity rate of vaporization of the released hydrocarbon.
Based on the results from analyses, it is recommended to have further investigations and studies for the followings:
- • The explosion pressures derived in this study are based on worst case events, not accounting for likelihood of occurrence. Accordingly, for a specific project application, it is recommended to conduct a probabilistic assessment in which the frequency of occurrence is considered.
- • It is also recommended to evaluate pressure relieving effects of failed decks and walls, or adverse consequences within any adjacent areas caused by a failed decks or walls as future studies.
Acknowledgments
This research did not receive any specific grant from funding agencies in the public, commercial, or not-for-profit sectors. The opinions expressed herein are solely those of the authors and do not represent the views and opinions of the author’s employer or any other parties.
Author Contributions
Conceptualization, G. Rocha and D. Ok; Methodology, G. Rocha, D. Ok; Software, G. Rocha; Validation, G. Rocha, D. Ok, and R. B. Storch; Formal Analysis, G. Rocha; Investigation, G. Rocha and D. Ok; Resources, D. Ok; Data Curation, G. Rocha; Writing—Original Draft Preparation, G. Rocha and D. Ok; Writing—Review & Editing, G. Rocha, D. Ok, and R. B. Storch; Visualization, G. Rocha; Supervision, D. Ok; Project Administration, D. Ok; Funding Acquisition, none.
References
- ANP, Investigation Report of the Explosion Incident Occurred on 11/02/2015 in the FPSO CIDADE DE SÃO MATEUS, http://www.anp.gov.br/images/EXPLORACAO_E_PRODUCAO_DE_OLEO_E_GAS/Seguranca_Operacional/Relat_incidentes/Sao_Mateus/informativo_11-02-15.pdf, , Accessed April 22, 2020.
-
T. Baalisampang, R. Abbassi, V. Garaniya, F. Khan, and M. Dadashzadeh, “Fire impact assessment in FLNG processing using Computational Fluid Dynamics (CFD),” Fire Safety Journal, vol. 92, pp. 42-52, 2017.
[https://doi.org/10.1016/j.firesaf.2017.05.012]

-
L. Dong, H. Zuo, L. Hu, B. Yang, L. Li, and L. Wu, “Simulation of heavy gas dispersion in a large indoor space using CFD model”, Journal of Loss Prevention in the Process Industries, vol. 46, pp.1-12, 2017.
[https://doi.org/10.1016/j.jlp.2017.01.012]

- DWSIM, https://en.wikipedia.org/wiki/DWSIM, , accessed April 21st, 2020.
- Energy Institute, Model Code of Safe Practice - Part 15, Area Classification for Installation Handling Flammable Fluids, 4th edition, p. 69, London, 2015
- GEXCON, FLACS, https://www.gexcon.com/products-services/FLACS-Software/22/en, , accessed April 21st, 2020.
- S. Gant and J. Hoyes, Review of FLACS version 9.0: Dispersion Modelling Capabilities, Research Report RR779, Health and Safety Laboratory, UK, 2010.
- GEXCON, CFD Validation, https://www.gexcon.com/article/CFD-Validation/30/en, , accessed April 21st, 2020.
-
O. R. Hansen, F. Gavelli, M. Ichard, and S. G. Davis, “Validation of FLACS against experimental data sets from the model evaluation database for LNG vapor dispersion. Journal of Loss Prevention in the Process Industries, vol. 23, no. 6, pp.857-877, 2010.
[https://doi.org/10.1016/j.jlp.2010.08.005]

-
K. Y. Kang, K. H. Choi, J. W. Choi, Y. H. Ryu, and J. M. Lee, “Explosion induced dynamic responses of blast wall on FPSO topside: Blast loading application methods,” International Journal of Naval Architecture and Ocean Engineering, vol. 9, no. 2, pp.135-148, 2017
[https://doi.org/10.1016/j.ijnaoe.2016.08.007]

- M. Y. Kim, G. S. Kim, J. J. Jung, and W. S. Sim, “Determination of the design load for structural safety assessment against gas explosion in offshore topside,” Probablistic Safety Assessment and Management PSAM 12, Honolulu, Hawaii, 2014.
-
P. Middha, O. R. Hansen, J. Grune, and A. Kotchourko, “CFD calculations of gas leak dispersion and subsequent explosions: Validation against ignited impinging hydrogen jet experiments,” Journal of Hazardous Materials, vol.179, no.1-3, pp. 84-94, 2010.
[https://doi.org/10.1016/j.jhazmat.2010.02.061]

-
L. Paris and A. Dubois, “Recent developments to evaluate global explosion loading on complex systems,” Journal of Loss Prevention in the Process Industries, vol. 46, pp. 163-176, 2017.
[https://doi.org/10.1016/j.jlp.2017.02.002]

-
A. Rajendram, F. Khan, and V. Garaniya, “Modelling of fire risks in an offshore facility,” Fire Safety Journal, vol. 71, pp.79-85, 2015.
[https://doi.org/10.1016/j.firesaf.2014.11.019]

-
H. Sezer, F. Kronz, V. Akkerman, and A. S. Rangwala, “Methane-induced explosions in vented enclosures,” Journal of Loss Prevention in the Process Industries, vol. 48, pp. 199-206, 2017.
[https://doi.org/10.1016/j.jlp.2017.04.009]

-
J. Sohn, S. Kim, B. Kim, and J. Paik “Nonlinear structural consequence analysis of FPSO topside blastwalls,” Ocean Engineering, vol. 60, pp.149-162, 2013.
[https://doi.org/10.1016/j.oceaneng.2012.12.005]

-
E. Vyazmina and S. Jallais, “Validation and recommendations for FLACS CFD and engineering approaches to model hydrogen vented explosions: Effects of concentration, obstruction vent area and ignition position,” International Journal of Hydrogen Energy, vol. 41, no. 33, pp. 15101-15109, 2016.
[https://doi.org/10.1016/j.ijhydene.2016.05.189]

-
D. Wang, X. Qian, M. Yuan, T. Ji, W. Xu, and S. Liu, “Numerical simulation analysis of explosion process and destructive effect by gas explosion accident in buildings,” Journal of Loss Prevention in the Process Industries, vol. 49, Part B, pp. 215-227, 2017.
[https://doi.org/10.1016/j.jlp.2017.07.002]


