Development of displacement controlled floating power distribution and junction box platform
Copyright ⓒ The Korean Society of Marine Engineering
This is an Open Access article distributed under the terms of the Creative Commons Attribution Non-Commercial License (http://creativecommons.org/licenses/by-nc/3.0), which permits unrestricted non-commercial use, distribution, and reproduction in any medium, provided the original work is properly cited.
Abstract
As fossil fuel depletion and global warming increase in conjunction with increased carbon emissions, the use of renewable energy sources including solar photovoltaic generation systems is growing. Floating solar photovoltaic generation systems can increase national land use efficiency. Power conversion devices such as power distribution boxes or junction boxes are installed on a floating body when using a solar photovoltaic generation system. This causes frequent movements of power transformers and can cause solar and junction box DC parallel connection problems and sensitivity to rainfall during the dry and rainy seasons. Because frequent movements have a significant effect on the structure, displacement can be controlled to secure structural safety and prevent damage to power distribution boxes and junction boxes. In this study, a displacement (draft) controlled floating water power distribution-junction box was developed. To ensure stability and structural safety of the platform, buoyancy, and strength of reinforcement alternatives, as well as hydrostatics, were investigated. In addition, to verify the structural safety of ballast changes and environmental conditions of displacement, numerical analysis was performed using the general purpose ANSYS mechanical simulation software. Although there are differences with ballast changes of 0%, 50%, and 100%, the platform has a structural strength margin of more than 56% against allowable stress. Even when crane lifting, a structural strength margin of 85% against allowable stress was achieved.
Keywords:
Power distribution box, Junction box, Platform, Displacement controlling, Structural safety1. Introduction
With increasing concern surrounding the depletion of fossil fuel resources and increased carbon emissions causing global warming, direct and indirect utilization of photovoltaic generation is rising as a countermeasure. Because the primary prerequisite for operation of a photovoltaic (PV) system is securing a sufficient amount of sunshine, it is advantageous to use geographic locations such as deserts and grasslands for PV systems. However, in South Korea, installation of PV systems on land is not recommended for reasons of land use efficiency; efficiency can be enhanced by installing the system on water bodies, such as lakes or rivers [1].
When a PV system is installed on water, the PV panel experiences a cooling effect from natural convection occurring on the water surface, leading to an increase in power generation efficiency.
Recent market research shows that most power distribution boxes are installed on land, and some junction boxes are installed on floating body structures of the floating PV system. Because of this, there are solar and junction box DC parallel connection problems, power loss from the connection between the junction box and the inverter installed on land, and excessive costs. Depending on seasonal variations in rainfall, it may be necessary to move the PV structure, which again leads to further increases in cost. In addition, as the power distribution-junction box is located separately from the PV structure, a prompt response to problematic situations is difficult.
Therefore, the floating body of the PV structure and the separate power distribution-junction box platform for a water PV system must be installed as structures capable of maintaining an equilibrium state. The scale of the floating power generation system should be designed to take into account operational convenience, such as in system production, transportation, installation, and maintenance. Furthermore, consideration should be given to changes in water depth and flow status.
In particular, the system should be designed in consideration of adverse weather environment (wind) effects such as typhoons. The floating body must have sufficient restoration stability and safety even under strong winds, while displacement should be controlled to maintain the equilibrium of the floating body. The floating structure of a floating PV system includes floating bodies, beam structures, metal connectors, and accessories. The following key design standards should be satisfied for these major elements to achieve structural safety. First, the floating body is exposed to the water surface for a long period of time. It must be designed and manufactured with a material that has sufficient anti-corrosion properties and corrosion resistance, and must maintain sufficient buoyancy against self-load and external loads. In addition, it is necessary to secure materials with sufficient strength to maintain resistance against changes in the external environment, such as temperature differences, water surface freezing, changes in flow speed, and floating materials.
The beam structure is also exposed to water for a long period of time and should be designed and manufactured from materials that have sufficient anti-corrosion properties and corrosion resistance. For convenience of maintenance, it is necessary to allow space, and a moving deck, for the movement of maintenance personnel to transport necessary equipment on the structure. Metal connectors and accessories should be installed using materials that can secure corrosion resistance and durability of STS304 or superior, and the flow area should have sufficient wear resistance and durability.
In this study, we aimed to develop a sensitized damping system that can reduce vibrations generated when operating a floating water power distribution-junction box platform that meets floating structure standard KDS 41 70 02 [2]. Then, using numerical simulation, we developed a displacement controlled floating water power distribution-junction box platform that can sufficiently secure structural safety of the equilibrium state during changes in displacement.
2. Modeling the floating water power distribu-tion-junction box platform
2.1 Platform Model Selection
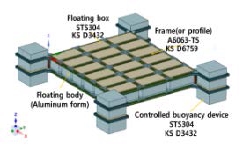
Figure 1 shows the main subject of this study, a displacement controlled floating water power distribution-junction box platform that is adaptive to meteorological change. The development platform includes 4 displacement (or buoyancy) control devices and 18 floating bodies. Aluminum profile reinforcements (frames) are constructed horizontally and vertically to constitute the platform.
The specifications of the main components of the development platform are defined as follows:
The floating body uses foam aluminum (360 kg/m3) as a reinforcement substitute for securing buoyancy and strength. The unit weight is approximately 149 kg and the dimensions are 1,210 × 610 × 600 mm (trapezoid). The floating body container is the same size as the floating body, and made from STS304 (KS D3732) material. The unit weight is 141 kg. The buoyancy control device is made of STS304 material, the unit weight is approximately 132 kg, and the dimensions are 500 × 500 × 1,000 mm. The deck frame (A6063-T5, KS D 6579) has a total weight of 369 kg and dimensions of 4,230 × 4,050 mm.
The buoyancy platform developed in this study was designed to ensure buoyancy and structural stability by applying aluminum foam rather than the conventional Styrofoam or EPP foam normally used for floating bodies. Aluminum foam is an ultra-light metal produced by dissolving an aluminum ingot, adding a thickener and a foaming agent, and then foaming into a sponge shape. It has characteristics such as ultra-light weight, sound insulation, energy absorption, eco-friendliness, and is a non-combustible material.
Table 1 and Table 2 outline the material properties of STS304 and A6063-T5 used in the platform.
2.2 Major Load Calculation
Floating water PV generation combines conventional PV generation and floating technology and is a renewable energy source installed on water. It consists of the structure, mooring system, power generation facility, and underwater cables. Structural safety must be achieved by overcoming various external loads such as wind, snow, and waves. Floating water PV systems are installed on the surface of the water. When wind speed is 1 to 2 m/s or more at sea level, a wave called a wind wave is generated; this phenomenon may also occur on inland waters. The size of the wind wave is determined by wind speed and duration, and the fetch length. Table 3 shows the development conditions of the wind wave; the longer the fetch length, the larger the size of the wind wave. Here, fetch length refers to a horizontal distance under the assumption that the wind blows over the sea without encountering obstacles, and with a constant wind speed and wind direction up to the point at which the size of a wave caused by the wind is estimated at the coast.
The SMB, Wilson, and simulation methods are typically used to predict waves. In particular, simulation methods that reflect field conditions as accurately as possible are used. Wave height obtained from the SMB and Wilson methods according to given wind speeds and fetch length are shown below. For example, if the fetch length is 1 km at a wind speed of 20 m/s, a wave height of 0.4708 m is obtained using the SMB method and 0.5869 m using the Wilson method.
The measurement method to predict wind speed according to the above fetch length, and the general arithmetic equation, can be expressed as in Equation (1) [3]. The wave load from the transmitted wave height can be expressed as in Equation (2) [3].
| (1) |
Where, Pw: Wind load
Cd: Drag coefficient (2.05)
Ws: Unit weight of air (0.00125 t/m³)
g: Gravitational acceleration (9.8 m/sec)
A: Area under wind load
U: Wind speed (45 m/sec)
| (2) |
Where, Pt: Wave loads applied to the pontoon
Wo: Unit volume weight of seawater (t/m³)
H: Transmitted wave height (m)
L: Pontoon length (m)
d: Draft of pontoon (m)
Among the environmental loads affected by regional and weather characteristics, snow loads have the greatest impact. In South Korea, loads are mainly considered for snow that accumulates on the roof during winter. In general, the uniformly distributed live load on the roof is over 100 kg/m2; it may not be appropriate to investigate if the region is not a snowy area [4].
The biggest difference between floating water PV generation and ground type systems is the floating body and mooring system of the former. As these two elements act as boundary conditions, the design must take into account buoyancy and how to moor the floating body. When reviewing buoyancy, the balance between left and right and front and back must be investigated, and the total buoyancy and total self-load of the structure should be compared to determine whether the buoyancy of the floating body is sufficient. The size of the floating body should be determined accordingly.
3. Investigation of platform stability
The hydrostatics investigation of the platform was performed using Bentley's FORMSYS Maxsurf V8i 18.02 for 0, 50, and 100% ballast displacement. Table 4 shows the results with 0% ballast displacement. Platform displacement was 5.56 tons, draft was 0.426 m, block coefficient was 0.90, and the prismatic coefficient was 0.78. Structural safety was calculated using the results of the hydrostatics investigation for each ballast displacement.
4. Investigation of platform structural safety
In this study, structural strength was investigated using the commercial software ANSYS Mechanical solver [5] for elastic analysis, considering elastic spring behavior based on the finite element method.
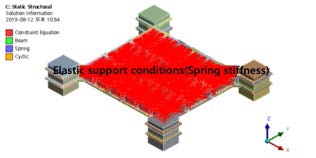
When modeling the developed platform, elements of shell 181 with 4 nodes and solid 187 with 10 nodes were applied. The number of finite elements used in the analysis was approximately 180,000, which provides sufficient conditions for judging the deflection shape and stress results. The platform is moored subject to the application of buoyancy, and the boundary condition is set to show the effect of buoyancy on structural response, as illustrated in Figure 2.
The boundary condition of the nodes with a spring attached to the floating body was fixed. The degrees of freedom for the up/down direction of the nodes attached to the support surface of the floating body was also fixed. The buoyancy is a function of the unit weight of the seawater and the volume of the submerged part. The elasticity value of the buoyancy spring is a function of load and displacement and is calculated using Equation (3) [6].
| (3) |
Where, kb: Elasticity of buoyancy spring
rw: Unit weight of seawater
B: Width of floating body
P: Pontoon weight
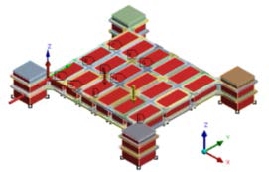
Figure 3 shows the platform structure self-load, additional weight (junction boxes and inverters), and external load (wind load and wave load). The wave load was applied based on the standard draft line and the pressure gradient was transmitted to the side surface. The wind load was reflected as the distribution load on the side surface of the upper part of the standard draft line.
In addition, lifting structure analysis and safety evaluation were performed to investigate the safety of the developed platform for lifting by crane. In order to perform lifting structural analysis, an analysis method that can most closely simulate the actual situation and an allowable stress criterion for safety evaluation are required. The analysis conditions and methods include variables such as gravity force, lug force, bottom boundary condition, lug points boundary condition, and wire model. When performing lifting analysis, the sensitivity of stress on the element size should be considered. In local structural analysis, because the stress on the element size is sensitive, criteria to evaluate sensitivity should also be determined. Typically, according to AISC and API design guidelines, tensile allowable stress is defined as approximately 60% of yield stress, and shear allowable stress is defined as approximately 40% of yield stress. These specifications are not intended for block lifting analysis and are not exact indicator values that can be directly applied. Therefore, in order to prepare our own criteria for lifting analysis, case studies were used to derive element sizes, allowable stress, and allowable deformation criteria that can be reasonably applied to lifting analysis to be comparable to the allowable stress reference values of ASIC, ABS, and LR [7].
The allowable stress criteria for each element and for the material of the developed platform were applied as shown in Table 5 to investigate whether the criteria were satisfied.
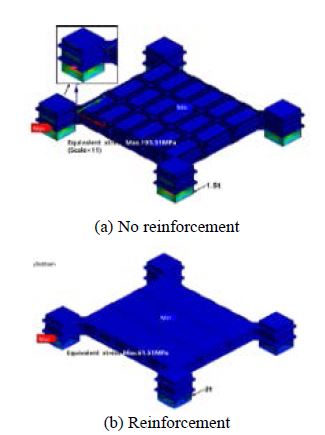
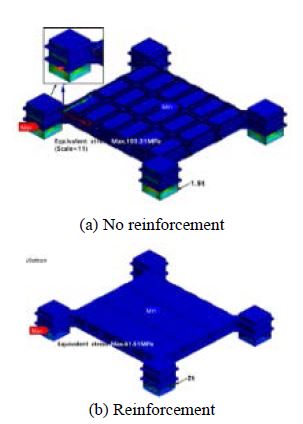
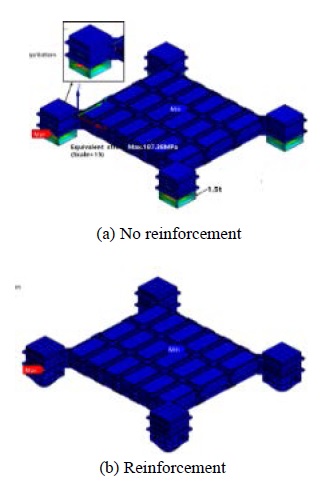
Figures 4 to 6 show the safety review results for the developed platform considering the change in ballast displacement of the buoyancy control device and whether reinforcement is applied. The largest deflection of stress can be seen in the lower part of the buoyancy control device following ballast displacement. This is because the load increases with the weight of the ballast and draft change. For structural safety criteria, the allowable stress design method (ASD) of the steel structure design criteria was applied.
- 1) When ballast displacement is “0%” (draft 0.426 m)
- 2) When ballast displacement is “50%” (draft 0.464 m)
- 3) When ballast displacement is “100%” (draft 0.502 m)
Table 6 shows whether the allowable stress is exceeded following ballast displacement of 0, 50, and 100%. Although maximum stress differs depending on changes in ballast displacement, a structural strength margin of more than 56% against allowable stress is achieved.
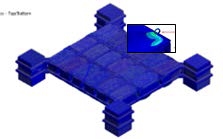
The safety of the developed platform was investigated as shown in Figure 7 by reflecting the weight of the hook, wire rope, and hoist used in crane lifting.
Table 7 shows that the highest stress value is generated in the lug part connected to the lifting line of the crane; however, it has a sufficient structural safety margin of 85% against allowable stress, ensuring adequate safety.
5. Conclusion
This study investigated the stability and structural safety of a displacement controlled floating water power distribution-junction box platform that is adaptive to meteorological change. The conclusions are as follows:
- (1) When estimating the initial structural design of the developed platform, the safety of the displacement-controlled floating water power distribution-junction box platform can be secured by reflecting the structural arrangement of the buoyancy control device. If the structural arrangement of the buoyancy control device is not reflected, stability may be greatly affected by ballast number, hydrostatic pressure, and external loads such as wave load.
- (2) According to displacement control, there is a possibility that the maximum stress may occur in the bottom part of the buoyancy control device. However, a structural strength margin of 56% compared to the allowable stress was confirmed through analysis. Therefore, in order to secure the long-term structural strength of the platform, sufficient safety factors should be taken into account and reflected in the design.
- (3) In the case of lifting by crane, when self-loads of hooks and wire ropes are reflected and lifting analysis is performed, an 85% structural strength margin against the allowable stress was confirmed, ensuring sufficient safety.
Acknowledgments
This study was supported by the 2018 Regional Flagship Industry Development (R&D) Technology Development Project of the Ministry of SMEs and Startups [P0003140].
Author Contributions
Conceptualization, J. B. Lee; methodology, Y. C. Oh; Writing-Original Draft Preparation, Y. C. Oh and H. J. Choi; Writing-Review & Editing, Y. C. Oh, M. S. Choi, Y. H. Lee, and H. J. Choi; Supervision, H. J. Choi; Project Administration, H. J. Choi.
References
- Y. K. Choi, N. H. Lee, and K. J. Kim, “Proposing offshore photovoltaic (PV) technology to the energy mix of the Maltese Islands,” Journal of Multimedia and Ubiquitous Engineering, vol. 25, pp. 284-289, 2013.
- Ministry of Land, “Floating Structure,” Korea, KDS 41 70 02:2016 Infrastructure and Transport, June 30th, 2016 (in Korean).
-
R. G. Dean and R. A. Dalrymple, Water Wave Mechanics for Engineers and Scientists, vol. 2, Singapore, World Scientific Publishing, 1991.
[https://doi.org/10.1142/1232]

- Ministry of Land, Infrastructure and Transport, KDS 41 10 15:2016 Architecture structure criteria design load, Note of Ministry of Land, Infrastructure and Transport, 2016.
- ANSYS, Multiphysics User's manual: Introduction of Non-linear Analysis and its Application of Plate Buckling and Ultimate Strength, vol. 3, pp. 85-110, 2016.
-
K. C. Seo, J. M. Oh, and J. S. Park, “Pontoon type design and structural safety estimation,” Journal of the Korean Society of Marine Environment & Safety, vol. 24, no. 5, pp. 604-610, 2018 (in Korean).
[https://doi.org/10.7837/kosomes.2018.24.5.604]

-
K. P. Park, J. H. Cha, and K. Y. Lee, “Lifting analysis considering three dimensional dynamic responses of a boom based on finite element formulation,” Transactions of the Korean Society for Noise and Vibration Engineering, vol. 20, no. 8, pp. 753-760, 2010.
[https://doi.org/10.5050/KSNVE.2010.20.8.753]


