Uneven pool spread of vaporizing cryogenic liquids
Copyright ⓒ The Korean Society of Marine Engineering
This is an Open Access article distributed under the terms of the Creative Commons Attribution Non-Commercial License (http://creativecommons.org/licenses/by-nc/3.0), which permits unrestricted non-commercial use, distribution, and reproduction in any medium, provided the original work is properly cited.
Abstract
The study of spread of cryogenic liquids is an essential procedure for assessing the risk of using cryogenic liquids. There are various numerical models for describing the spread of a liquid pool formed by leakage of a cryogenic liquid. Some models, such as the constant Froude number model and the shallow layer model, require the vaporization velocity as the input variable. The vaporization velocity should be determined experimentally because the heat transfer mechanism between the liquid pool and the surrounding is very complicated and difficult to model. In this study, liquid nitrogen and liquid oxygen were continuously discharged onto a 3 m diameter unbounded concrete plate to measure the vaporization velocity when the liquid pool was spreading. Since the concrete plate is heavy, it is impossible to simultaneously measure the radius of the pool using the thermocouple and the mass of the pool using the electronic scale. So only the spread radius of the pool was measured. Therefore, the vaporization velocity was evaluated based on the semi-analytical model using pool spread data. Various release rates were obtained using several nozzles, and the effect of the rates on the vaporization velocity was investigated.
Keywords:
Cryogenic liquid, Risk, Spread, Vaporization1. Introduction
In several industries, cryogenic liquids such as liquefied hydrogen, liquefied natural gas, and liquid nitrogen have been extensively utilized. However, accidental releases from storage vessels in industrial plants, including transportation, can results in disastrous situations. When a cryogenic liquid leak from storage equipment and spreads to the outside, a liquid pool is generated. The temperature of the cryogenic liquid pool is much lower than the ambient temperature; therefore, it experiences intense boiling by heat transfer from the environment. Consequently, the cryogenic liquid pool can evaporate and develop into a vapor cloud. The main heat transfer mechanisms are conduction heat transfer from the ground, convective heat from the surrounding air, and sun radiation. If the spilled liquid is combustible, different types of fires and vapor cloud explosions can occur. In addition, if the liquid contains toxic materials, its dispersion into the atmosphere with wind may cause serious problems for neighboring districts that have plants. Therefore, studies on the spread and evaporation of cryogenic liquid pools are important for the risk assessment of cryogenic liquid storage facilities.
Several types of models have been developed based on analytical solutions [1][2] and numerical analyses [3]-[6] to predict pool spread. Almost all models have ignored radiative heat transfer and convective heat transfer; only heat transfer from ground by conduction was considered. A fundamental element of these models is to neglect the energy and vaporization velocity equations of the liquid pool by introducing the vaporization velocity, i.e., the volume evaporated per unit area per unit time, which is equal to the rate of change of the pool mass per unit area divided by the liquid density [7]. These equations are complicated, meaning a stable solution is difficult to obtain. Therefore, in all of the studies, the vaporization velocity was used as an input variable.
In many experimental studies measuring the vaporization velocity, cryogenic liquids are instantaneously poured onto a confined plate to limit spread, creating an instantaneous release where the release time is much shorter than the evaporation time [8]. In this non-spreading pool [9]-[12], the ground surface temperature decreases monotonically, and the conductive heat flux is continuously reduced as well. The spread that can occur in the early stages of the non-spreading pool has not been considered because the spread time is short. However, in real accidents the liquid pool continues to leak on an unconstrained surface, causing both spread and evaporation. This liquid pool spreads continuously over new hot surfaces such that the heat energy by conduction can be supplied more efficiently in the spreading pool than in the non-spreading pool. The measurement of vaporization velocity in spreading pools has been performed [13][14], and two measurement methods were developed. One is the simultaneous measurement of the spill rate and the mass and radius of the spreading pool, and the other is based on the semi-analytical method.
In the present study, liquid nitrogen and liquid oxygen were continuously discharged onto a 3 m diameter unbounded concrete plate to measure the vaporization velocity while the liquid pool was spreading. It is impossible to measure the radius and mass of the pool simultaneously using a thermocouple and an electronic scale, respectively, because the concrete plate is extremely heavy. Therefore, only the spreading radius of the pool was measured. The vaporization velocity was evaluated based on the semi-analytical model using the pool spread data. Various spill rates were obtained using several nozzles, and the effect of the rates on the vaporization velocity was evaluated.
2. Vaporization Model
The main source of thermal energy for the evaporation of cryogenic liquid spilled on land is the heat energy stored in the ground. Initially, the heat transfer of the film-boiling type, which is affected by the vapor blanket formed between the liquid and the ground surface, dominates. However, as the ground surface temperature decreases, the vapor film disappears and nucleate boiling starts, resulting in a better thermal contact and faster heat transfer between the liquid and ground. Hence, the conductive heat flux into the liquid pool from the ground controls the liquid evaporation. Based on these phenomena, an evaporation model can be established by adding the following assumptions: 1) only the heat source through the ground governs the evaporation, 2) the liquid pool is sufficiently thin and the entire pool is at a uniform temperature equal to its boiling point, 3) the liquid pool is in perfect thermal contact with the ground, and 4) the conduction heat transfer from the ground to the liquid pool is one dimensional in the direction of gravity.
By solving the one-dimensional heat conduction equation modeled by the assumptions above, the heat flux into the liquid pool is expressed as follows [1]:
| (1) |
Here, q′ is the heat flux, k the thermal conductivity of the ground, Ta the ambient temperature, Tb the boiling point, α the thermal diffusivity of the ground, and t the time.
For the non-spreading pool where the pool area has not changed, the vaporization velocity is obtained as follows:
| (2) |
Here, En is the vaporization velocity of the nonspreading pool, ρ the liquid density, and L the latent heat of vaporization.
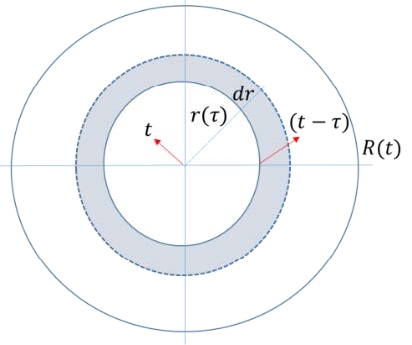
Based on the vaporization velocity of the non-spreading pool shown in Equation (2), the vaporized volume from the annular element of the spreading pool in Figure 1 becomes
| (3) |
Here, V is the vaporized volume, r the radius, and τ the spreading time for the annular element to reach the radius r ; the pool is assumed to be a circular cylinder, and t is the arrival time of the spreading pool at radius R from the origin where t=0.
Subsequently, the vaporization velocity of the spreading pool with radius R is
| (4) |
Here, Es is the vaporization velocity of the spreading pool.
The vaporization velocity of the non-spreading pool can be determined easily because it is a function of time only, as shown in Equation (2). Meanwhile, it is not straightforward to obtain the vaporization velocity for the spreading pool because it is dependent on both the time and pool area, and annular ground elements are in contact with the liquid for different time periods, as shown in Equation (4). The vaporization velocity as a function of time t only can be obtained if the spread data r (τ) are known. In the current study, the spread data were measured using several thermocouples installed at specific intervals. Therefore,
| (5) |
Here, R1 is the location of the nearest thermocouple from the center of the ground, and Rn is for the farthest thermocouple. If the measured radius can be assumed to be linear with time in each range, it can then be expressed as follows:
| (6) |
Equation (5) can be integrated analytically as follows:
| (7) |
3. Experimental Setup
The cryogenic liquids used in the experiments were liquid nitrogen and liquid oxygen; their physical properties and those of the concrete ground are shown in Table 1 and 2.
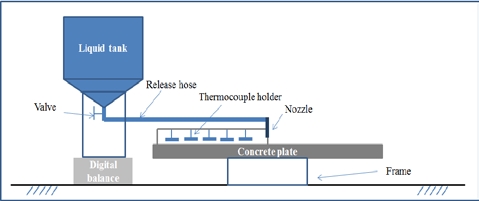
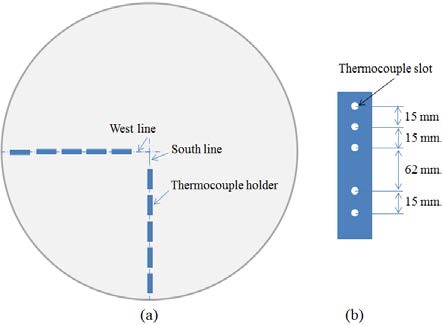
The experimental apparatus comprised a digital balance, a liquid storage tank, thermocouples, and a data acquisition device, as shown in Figure 2. A digital balance with a resolution of 0.1 kg was used to measure the liquid weight in the storage tank under test. The release rate can be evaluated from the liquid weight over time. The liquid tank was well insulated to prevent heat from being transferred from the ambient to the liquid. The cryogenic liquid was released from the tank onto the center of the 3 m diameter concrete plate through a discharge nozzle. The concrete plate was sufficiently thick to represent a semi-infinite ground during the experiment. The concrete plate was verified prior to every experiment by a spirit level to ensure that it was horizontal. Four discharge nozzles with different inner diameters were used to obtain four different release rates. Four experiments were performed for each nozzle for a consistent experiment, and the estimated average release rates and release times are shown in Table 3. The thermocouples used in this study were K-type thermocouples produced by OMEGA with a probe diameter of 0.5 mm and a response time of 0.25 s. The thermocouples were distributed in two perpendicular directions, as shown in Figure 3, to determine the arrival time of the pool front at predetermined locations. The thermocouples were held by thermocouple holders. In general, each thermocouple holder could hold five thermocouples. A total of 23 thermocouples were installed along each direction, and the distances of the thermocouples with reference to the center of the concrete plate are listed in Table 4. A thermocouple was installed with its tip being in contact with the plate surface. The liquid pool was assumed to have spread to a thermocouple location if the temperature measured by the thermocouple reduced significantly to the boiling point of the liquid. The data acquisition system simultaneously recorded data obtained from the digital balance and thermocouples.
4. Results and Discussion
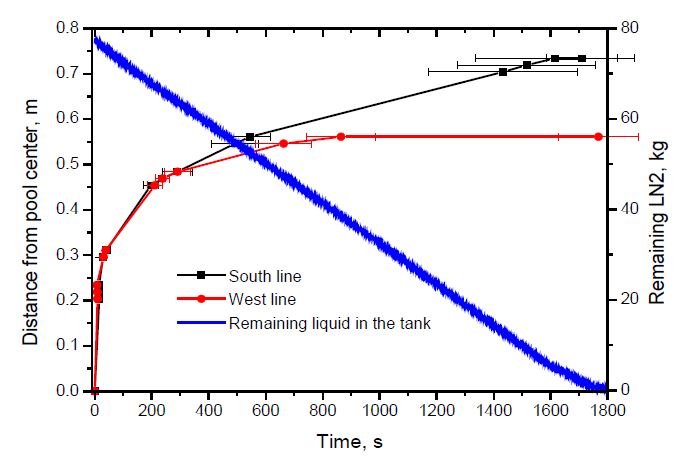
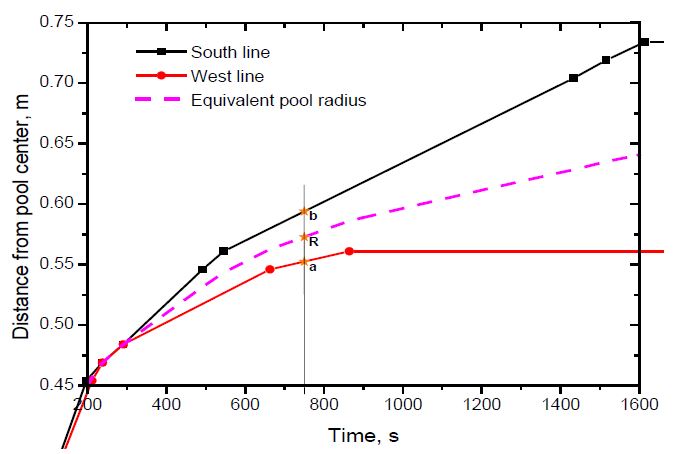
The experiment was repeated four times for the same nozzle. As shown in Figure 4, the spread rates in two directions were similar at the initial stage of spread, but the spread rate in the South direction was larger when the distance exceeded 0.5 m. In addition, the error range of the data, i.e., the standard deviation, increased in the late period of spread. Furthermore, the spill rate was almost constant during the experiment owing to the weight of the liquid remaining in the storage tank.
This non-uniform spread was due to the difficulty in producing a precise concrete plate; therefore, this spread was assumed as elliptical for data processing. To obtain a circular spread corresponding to this elliptical one, an equivalent radius was introduced as follows: , where R is the equivalent circular pool radius, and as shown in Figure 5, a and b are the mean values of the boundary positions of the elliptical pool obtained in the four replicate experiments. Furthermore, a and b can be determined by linear interpolation using the neighboring experimental data of pool boundary along the West and South lines.
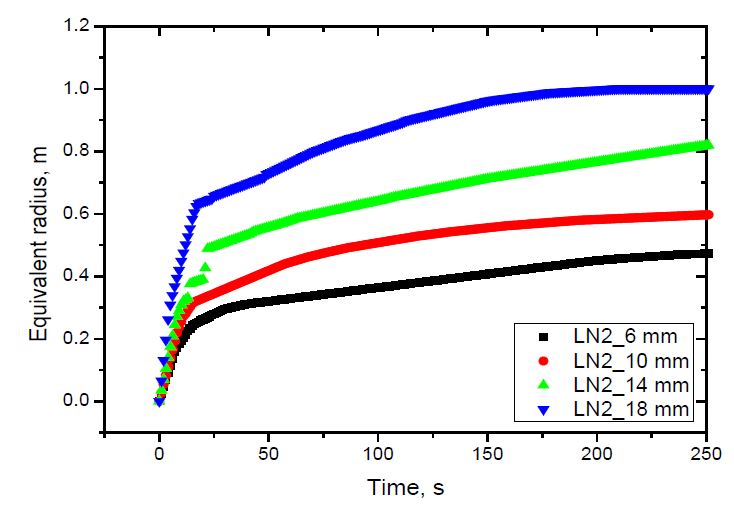
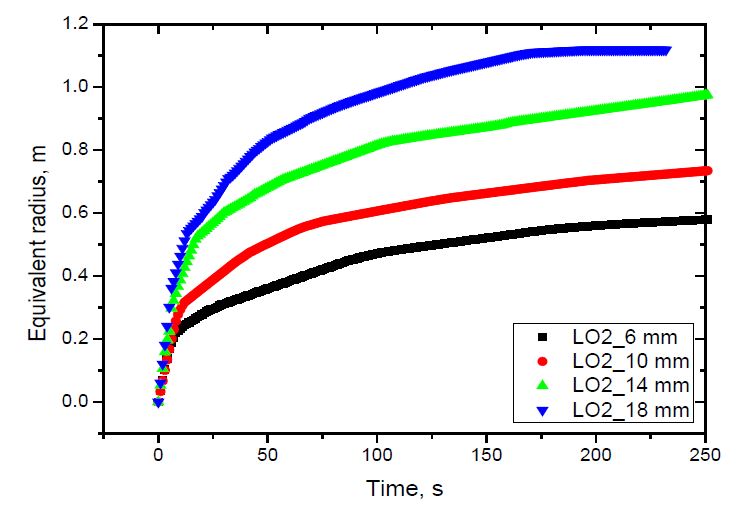
The spread of liquid nitrogen and liquid oxygen using the equivalent radii defined above is shown in Figure 6 and 7. As shown, the average spread rate increased with the release rate for both liquids, which was due to the increase in the inertia force with the increasing release rate [14]. The spread rate of liquid oxygen was slightly larger than that of liquid nitrogen was due to the difference in the release rate of both fluids. As shown in Table 3, for the same nozzle, the release rate of liquid nitrogen was smaller than that of liquid oxygen.
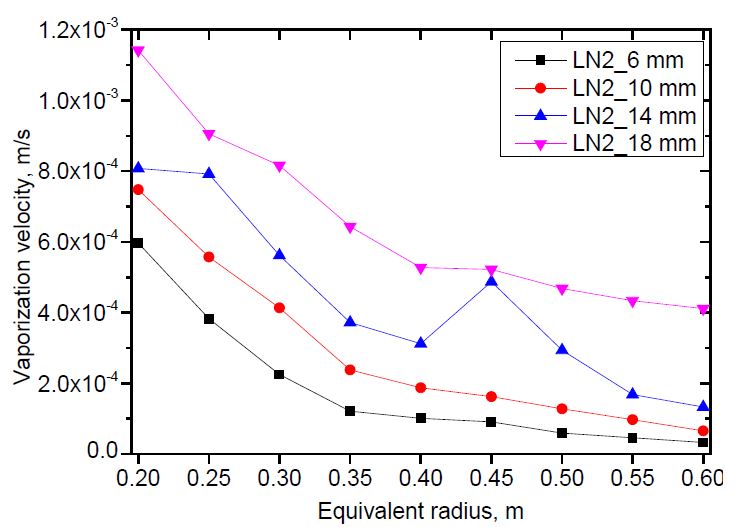
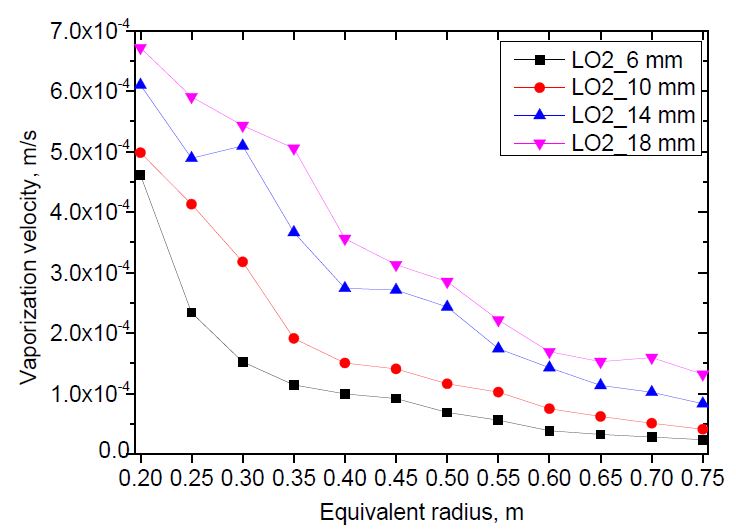
The vaporization velocity versus pool radius was calculated for both liquid nitrogen and liquid oxygen using the methodology described in Section 2. The methodology required the pool radius to be a linear function of time. Therefore, the equivalent radius curve was divided into approximated linear sections. The distance between two calculation points was 0.05 m.The results are shown in Figure 8 and 9.
The vaporization velocity was calculated from the pool radius of 0.2 to 0.6 m for liquid nitrogen, and 0.75 m for liquid oxygen. Those are the maximum pool radii of the case with the smallest release rate. The case with nozzle diameter D = 14 mm indicated abnormal results at the pool radii of 0.45 and 0.3 m for liquid nitrogen and liquid oxygen, respectively, which were different to the other cases. The abnormality was not considered a physical behavior. It was discovered that the greater the release rate, the higher the vaporization velocity. This can be explained by investigating the contact time of an annular ground element with fast- and slow-spreading pools when the pools spread to a predetermined radius. As the release rate increased, the pool spread faster. When both pools spread to the same radius, the contact time of an annular ground element with the liquid in the fast-spreading pool was shorter than that of the slow-spreading pool. Therefore, the vaporization velocity of the fast-spreading pool was higher than that of the slow-spreading pool, as shown in Equation (5). In addition, the vaporization velocity decreased with increasing pool radius. This tendency was the same as that observed in an even-spreading pool [13].
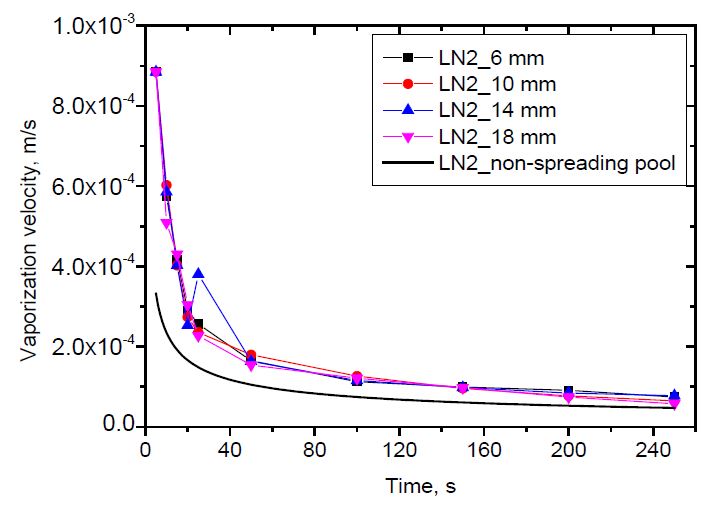
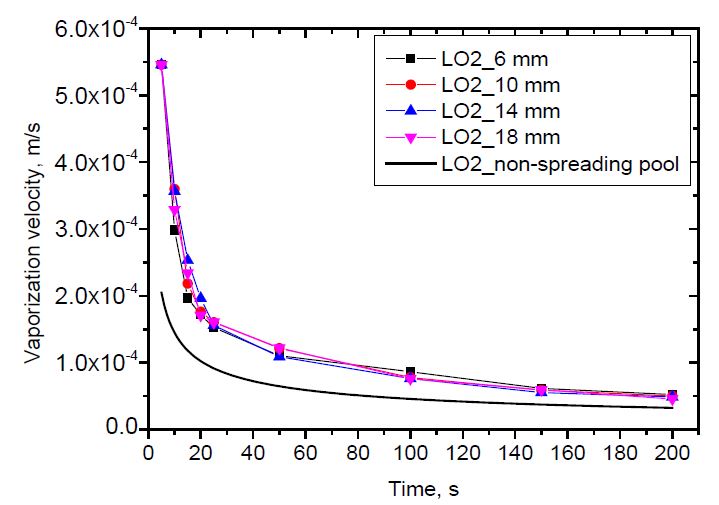
The vaporization velocity versus time is shown in Figure 10 and 11 for liquid nitrogen and liquid oxygen, respectively. As described in the introduction section, the non-spreading pool has a constant surface area. Its vaporization velocity depends on time only, as can be calculated in Equation (2). Meanwhile, the vaporization of the spreading pool depends on both time and pool radius, as shown in Equation (5). As shown, the vaporization velocity decreases with time. The vaporization velocity of a spreading pool is higher than that of a non-spreading pool. This is because the spreading pool can receive heat from new warm ground. The effect of the release rate on the vaporization velocity versus pool radius was clearly observed. However, it was difficult to distinguish the effect of the release rate on the vaporization velocity versus time. This was because the differences in the release rate among the cases were insufficient to identify the effects.
5. Conclusion
In this study, spreading and vaporization experiments of liquid nitrogen and liquid oxygen on concrete ground were conducted. Pool radius as a function of time was the only measured parameter. A semi-analytical model was derived based on the solution of a one-dimensional unsteady heat conduction equation. Subsequently, the vaporization velocity was evaluated based on the semi-analytical model using pool spread data. The model did not require the release rate and pool mass. The results indicated that a greater release rate resulted in a faster-spreading pool, which consequently increased the vaporization velocity at specified pool radius values. However, the effect of the release rate on the vaporization velocity versus time in the experimental cases was not evident owing to the small range of release rate. Furthermore, the vaporization velocity decreased with both the pool radius and time. This tendency was also observed in an even-spreading pool.
Acknowledgments
This research was supported by the Research Program funded by the Ministry of Oceans and Fisheries of Korea.
Author Contributions
Conceptualization, K. Chung; Experimental methodology, Y. Han and S. Cho; Writing-Original Draft Preparation, L. Nguyen; Supervision, M. Kim.
References
-
F. Briscoe and P. Shaw, “Spread and evaporation of liquid,” Progress in Energy and Combustion Science, vol. 6, no. 2, pp. 127-140, 1980.
[https://doi.org/10.1016/0360-1285(80)90002-7]

-
M. B. Kim, K. H. Do, B. G. Choi, and Y. S. Han, “High-order perturbation solutions to a LH2 spreading model with continuous spill,” International Journal of Hydrogen Energy, vol. 37, no. 22, pp. 17409-17414, 2012.
[https://doi.org/10.1016/j.ijhydene.2012.03.047]

-
K. Verfondern and B. Dienhart, “Experimental and theoretical investigation of liquid hydrogen pool spreading and vaporization,” International Journal of Hydrogen Energy, vol. 22, no. 7, pp. 649-660, 1997.
[https://doi.org/10.1016/S0360-3199(96)00204-2]

-
J. Brandeis and E. J. Kansa, “Numerical simulation of liquefied fuel spills: I. Instantaneous release into a confined area,” International Journal for Numerical Methods in Fluid, vol. 3, no. 4, pp. 333-345, 1983.
[https://doi.org/10.1002/fld.1650030404]

-
J. Brandeis and D. L. Ermak, “Numerical simulation of liquefied fuel spills: II. Instantaneous and continuous LNG spills on an unconfined water surface,” International Journal for Numerical Methods in Fluid, vol. 3, no. 4, pp. 347-361, 1983.
[https://doi.org/10.1002/fld.1650030405]

- W. Stein and D.L. Ermak, One-dimensional Numerical Fluid Dynamic Model of Spreading of Liquefied Gaseous Fuel (LGF) on Water, Report No. UCRL-53078, Lawrence Livermore National Laboratory, USA, 1980.
- D. M.Webber, A Model for Pool Spreading and Vaporization and its Implementation in the Computer Code GASP, SRD/HSE Report No. R507, AEA Technology Consultancy Services/UK Health and Safety Executive, UK, 1990.
- API, Consequence Analysis in an API RBI Assessment, API RP 581 PART 3, American Petroleum Institute, Washington, D. C., USA, 2008.
- M. G. Zabetakis and D. S. Burgess, Research on the Hazard Associated with the Production and Handling of Liquid Hydrogen, TN23. U7 no. 5707, United State Department of the Interior, Bureau of Mines, USA, 1961.
-
K. Takeno, T. Ichinose, Y. Hyodo, and H. Nakamura, “Evaporation rates of liquid hydrogen and liquid oxygen spilled onto the ground,” Journal of Loss Prevention in the Process Industries, vol. 7, no. 5, pp. 425-431, 1994.
[https://doi.org/10.1016/0950-4230(94)80061-8]

- T. Olewski, L. Vechot, and S. Mannan, “Study of the vaporization rate of liquid nitrogen by small- and medium-scale experiments,” The Italian Association of Chemical Engineering, vol. 31, pp. 133-138, 2013.
-
R. C. Reid and R.Wang, “The boiling rates of LNG on typical dike floor materials,” Cryogenics, vol. 18, no. 7, pp. 401-404, 1978.
[https://doi.org/10.1016/0011-2275(78)90033-4]

-
M. B. Kim, D. Nguyen, and B. G. Choi, “Experimental study of the evaporation of spreading liquid nitrogen,” Journal of Loss Prevention in the Process Industries, vol. 39, pp. 68-73, 2016.
[https://doi.org/10.1016/j.jlp.2015.11.018]

-
L. -D. Nguyen, M. B. Kim, and B. G. Choi, “An experimental investigation of the evaporation of cryogenic-liquid-pool spreading on concrete ground,” Applied Thermal Engineering, vol. 123, pp. 196-204, 2017.
[https://doi.org/10.1016/j.applthermaleng.2017.05.094]

- G. J. V. Wylen and R. E. Sonntag, “Fundamentals of Classical Thermodynamics,” New York, John Wiley and Sons, 1978.

