A study on the effect of dynamic material strain on the dynamic crushing behavior of steel structures subjected to impact loads
Copyright © The Korean Society of Marine Engineering
This is an Open Access article distributed under the terms of the Creative Commons Attribution Non-Commercial License (http://creativecommons.org/licenses/by-nc/3.0), which permits unrestricted non-commercial use, distribution, and reproduction in any medium, provided the original work is properly cited.
Abstract
Several studies have been conducted on dynamic impact crushing testing on a steel tube with a square cross-section to investigate the dynamic effect on the crushing behavior of a plate structure under dynamic loads. We focused on the effect of dynamic material strain on the dynamic crushing behavior of steel structures subjected to impact loads, such as ship-to-ship collisions and ship-to-bridge impacts. The authors proposed optimized finite element models and compared the results with experimental results to obtain accurate simulation results. To consider the dynamic effect of dynamic yield strength with loading speed, the yield strength was calculated by the strain rate considering the loading speed applied in the actual experiment and implemented in the simulations. The results of this study showed the importance of considering the variation in yield strength according to the strain rate in dynamic crushing simulations to evaluate the crushworthiness of steel structures.
Keywords:
Dynamic impact crushing test, Steel tube, Dynamic material strain, Finite element model1. Introduction
Accidental loads, such as collisions of ships and automobiles, are not only applied dynamically, but also have a changing load speed. Therefore, it is important to investigate the dynamic effects of such loads for the basic design purposes of ships and automobiles [1][2][3].
Previous studies on dynamic crushing characteristics examined the crushing behavior of structures under quasi-static load conditions and estimated average crushing strength by considering the dynamic effect.
Abramowicz and Jones [1][5], Yang and Caldwell [6], Jones and Birch [7], Jones [8], and Lehmann and Yu [9], evaluated the mean crushing strength of structures by considering the dynamic effect on the material deformation rate based on the strain rate.
The following are some of the dynamic effects that have been studied in relation to the crushing behavior of structures:
- 1) Material deformation effect
- 2) Friction effect
- 3) Inertia effect
Chung [10] conducted an impact crushing test on a square tube section steel test specimen using a free-falling object and a dynamic actuator to investigate the dynamic effect on crushing failure behavior. The dynamic effects, such as friction, inertia, and material deformation rate, on the test specimens were analyzed under dynamic external loads as follows:
1) Material deformation effect
The material properties are significantly affected by the strain rate for the dynamic impact external loads. As the speed of the external load increases, both the internal energy absorption capacity and dynamic mean crushing load increase.
2) Friction effect
The effect of friction on the dynamic failure behavior of a material during crushing may depend on the size of the contact area between the colliding and collided objects. However, when an impact load is applied in the longitudinal direction of a square tube steel specimen, the contact surface area is relatively small. In this case, the effect of dynamic friction on the dynamic crushing behavior may be minor.
3) Inertia effect
The strain of a test specimen subjected to dynamic impact loads may change over time because of the stress levels caused by the inertia of the impact. Chung [10] found that the absorbed energies resulting from fixed loading speed conditions using a loading actuator and free-fall conditions using a drop hammer were similar. Therefore, for practical purposes, the effect of inertia on dynamic crushing failure can be considered minor.
In this study, we focused on the effect of dynamic material strain on the dynamic crushing behavior of steel structures subjected to impact loads. Optimized finite element (FE) models are proposed by varying the factors that influence the dynamic crushing simulation, such as the FE mesh size, initial imperfection, and material model, and comparing the results with experimental results to achieve accurate simulation results. Finally, we calculated the yield strength according to the strain rate, considering the loading speed applied in the actual experiment, and applied the value to the simulation to investigate the crushing behaviors based on the strain rate.
2. Dynamic crushing experimental works
Chung [10] conducted a dynamic impact crushing test on a steel tube with a square cross section to investigate the dynamic effects (strain rate effect on the material, friction effect, and inertia effect) on the crushing behavior of a plate structure under dynamic load using a falling object.
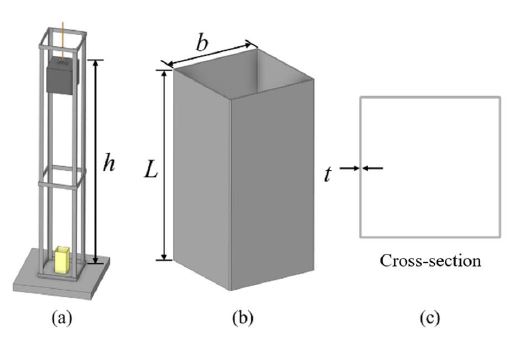
Figure 1 and Table 1 show a schematic view of the dynamic crushing test setup and the test specimens, respectively. The experimental tests were conducted under the conditions shown in Figure 1 (a), and the shapes of the test specimens are shown as (b) and (c). The test specimens were named based on the thickness (t), weight (mg), and height (h), of the falling object during the dynamic impact compression tests.
Table 2 presents a list of test specimens categorized by the weight of the dropped object and the drop height. The table also includes the test results in terms of crushing lengths and dynamic mean crushing loads.
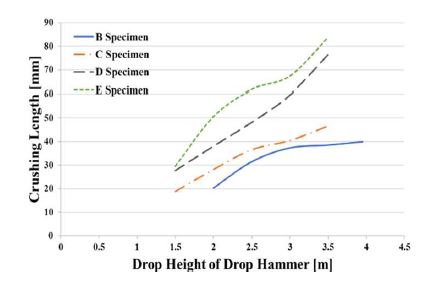
Figure 2 shows the crushing lengths of test specimens B, C, D, and E, for each drop height of the drop hammer, based on the experimental results. The crushing length is the total distance over which the test specimen was crushed by the falling object.
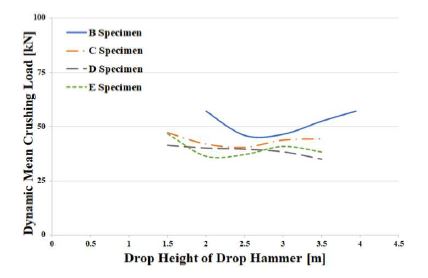
As the drop height increased, the crushing length also increased for all test specimens. However, Figure 3 shows that the dynamic mean crushing loads, which are obtained by dividing the internal energy by the crushing length, for different drop heights were almost the same. It is suggested that as the drop height of the falling object increases, the impact internal energy and the crushing length increase simultaneously, leading to similar dynamic mean crushing loads.
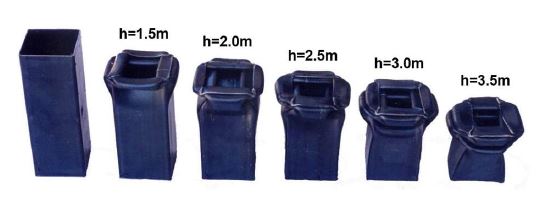
Error! Reference source not found. shows the test specimens after testing at different drop hammer heights. The test specimen prior to the test is shown on the left, and moving to the right, the test results of the experiment conducted with increasing drop heights are shown.
3. Numerical simulations by FE methods
3.1 General
The dynamic crushing behavior of a material involves complicated nonlinearities, such as contact boundaries and nonlinear material properties, which depend on the strain rate and large deflections. To accurately determine the dynamic crushing capacities, it is important to carefully calibrate the nonlinear FE assessment using experimental results. In this study, the commercial FE code ABAQUS was used for FE simulations [10]. The specifications of the numerical calculations are listed in Table 3, which were determined based on a previous study by Park et al. [10].
3.2 Mesh size sensitivity assessment
The results of the FE analysis, specifically the average stress level, were significantly affected by the element size. In the dynamic crushing simulations, the element size had a significant influence on the simulation results. In this study, a series of FE analyses were conducted using different element sizes to study dynamic crushing failures, using the crushing length and mean crushing load as parameters. The results, shown in Figure 5 and Table 4, indicate that the crushing length and mean crushing load become stable for element sizes of 1.5 mm and 2.0 mm. Therefore, an element size of 1.5 mm was selected for further analyses.
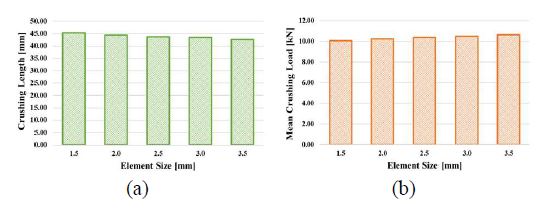
Dynamic crushing lengths and dynamic mean crushing loads by FE element sizes: (a) crushing length, (b) mean crushing load
3.3 Initial imperfection
Since no initial imperfection measurements were taken during the experimental work, the effects of initial imperfection levels on the dynamic crushing simulations were investigated through a series of FE analyses. Using the following equation, sixteen different maximum imperfection levels were used in the FE analysis.
| (1) |
Here,
w0 = maximum initial imperfection.
Here,
β = slenderness ratio; E = elastic modulus; and amp = 0.025, 0.05, 0.075, 0.1, 0.125, 0.15, 0.175, 0.2, 0.225, 0.25, 0.275, 0.3, 0.325, 0.35, 0.375, 0.4.
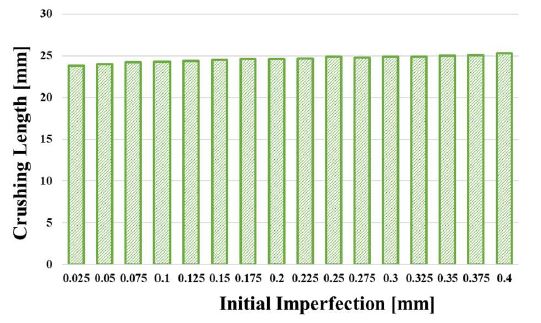
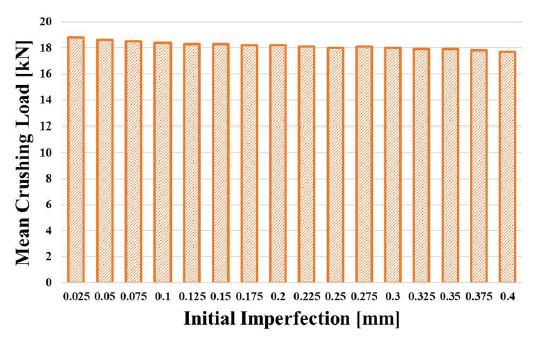
Table 5, Figure 6, and Figure 7, show the effect of the initial imperfection levels on the crushing length and dynamic mean crushing load. As the initial imperfection level increased, the crushing length increased, and the dynamic mean crushing load tended to decrease. However, the maximum differences were less than 1%, indicating that the effect of the initial imperfection on the crushing length and dynamic mean crushing load was negligible. In this study, the maximum initial imperfection level of “amp = 0.1” was used in the dynamic simulations.
3.4 Dynamic yield strength by strain rate
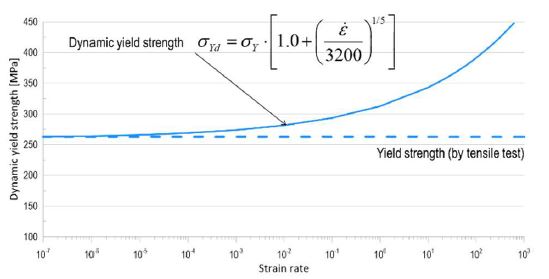
The yield strength of a material increases with an increase in the strain rate of the structure. The Cowper-Symonds equation [10], shown in Equation (2), is widely used to calculate the dynamic yield strength of a material. In this study, the material of the experimental specimen was high tensile steel, and the coefficients used for the Cowper-Symonds equation were C = 3200 sec-1 and q = 6 [13]. Figure 8 shows the variation in dynamic yield strength with strain rate calculated using the Cowper-Symonds formula.
In this study, yield strength was calculated according to the strain rate by considering the loading speed applied in the actual experimental work, and this was applied to the FE simulations.
| (2) |
Here,
σYD = dynamic yield strength; σY = yield strength determined by tensile test; = strain rate; C, q = test coefficients.
3.5 Dynamic FE series simulation
A series of dynamic FE assessments was conducted using the same test conditions as those described in
Table 2 presents a list of test specimens categorized by the weight of the dropped object and the drop height. The table also includes the test results in terms of crushing lengths and dynamic mean crushing loads.
Figure 9 compares the deformed shapes obtained from the experimental results and the numerical simulations obtained in this study. The deformed shapes in the numerical simulations agreed well with those in the experimental studies.
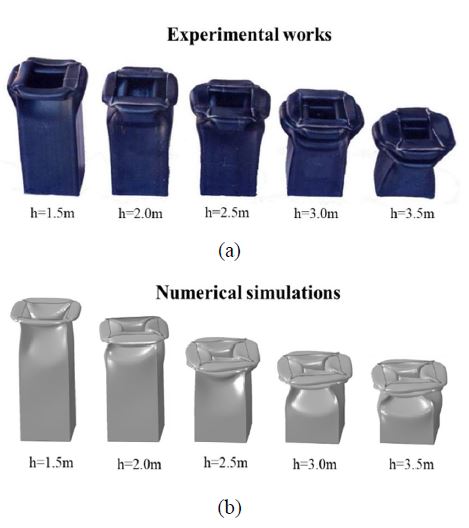
Comparison of the experimental (a) and simulated (b) deformation of the test specimens by different drop heights of the drop hammer
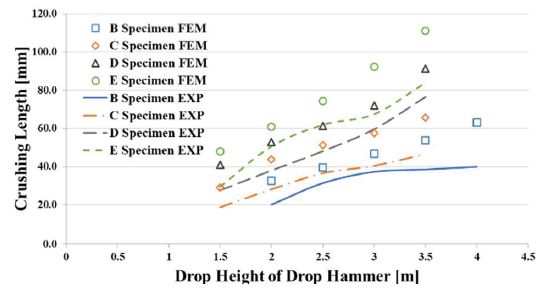
Figure 10 and Table 6 show the simulation results that do not consider the variation in dynamic yield strength with strain rate in the material, whereas Figure 11 and Table 7 show the results that take this into account.

Summary of the experimental and numerical tests for all specimens for the fixed yield strength condition
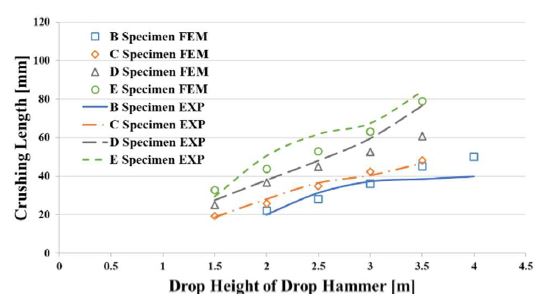
Crushing lengths by drop height of the drop hammer for yield strengths with strain rate by loading speed

Summary of the experimental and numerical tests for all specimens for yield strengths with strain rate by loading speed
The analysis model that did not consider the strain rate showed a maximum error of 63% in the crushing length compared with the experimental results, which is a large difference.
Although there was a case where the maximum error was 26% for the analysis model that considered the strain rate, it showed a small difference of less than 10% error from the experimental results.
In conclusion, it is critical to consider the variation in yield strength with strain rate in dynamic crushing simulations.
4. Conclusion
This study was conducted to provide basic research on dynamic crushing capacities for evaluating the collision performance of ships.
As nonlinear dynamic FE simulations require a high level of uncertainty, several sensitivity analyses were performed and calibrated using previous experimental test results.
Based on previous dynamic experiments, the effects of inertia and friction on the dynamic crushing behavior of steel tubular members were found to be relatively small. Thus, a series of nonlinear FE simulations was performed to investigate the effect of dynamic material strain on the dynamic mean crushing behavior of steel structures. Consequently, the model to which the yield strength according to the strain rate was applied showed better results than the model to which it was not applied.
We concluded that it is critical to consider the variation in yield strength with strain rate in dynamic crushing simulations, and special care should be taken to evaluate the crushworthiness of steel structures.
Acknowledgments
This work was supported by the Dong-A University research fund.
Author Contributions
Conceptualization, Y. I. Park; Methodology, Y. I. Park; Formal Analysis, J. -S. Cho; Investigation, J. -S. Cho; Data Curation, J. -S. Cho.; Writing—Original Draft Preparation, Y. I. Park; Writing—Review & Editing, J. -H. Kim; Visualization, J. -H. Kim; Supervision, J. -H. Kim; Project Administration, J. -H. Kim; Funding Acquisition, J. -H. Kim.
References
-
H. Wang, Z. Lu, Z. Yang, and X. Li, “In-plane dynamic crushing behaviors of a novel auxetic honeycomb with two plateau stress regions,” International Journal of Mechanical Sciences, vol. 151, pp. 746-759, 2019.
[https://doi.org/10.1016/j.ijmecsci.2018.12.009]

-
X. Zhang, H. Hao, R. Tian, Q. Xue, H. Guan, and X. Yang, “Quasi-static compression and dynamic crushing behaviors of novel hybrid re-entrant auxetic metamaterials with enhanced energy-absorption,” Composite Structures, vol. 288, 115399, 2022.
[https://doi.org/10.1016/j.compstruct.2022.115399]

-
J. Dong and H. Fan, “Crushing behaviors of buckling-oriented hexagonal lattice structures,” Mechanics of Materials, vol. 165, 104160, 2022.
[https://doi.org/10.1016/j.mechmat.2021.104160]

-
W. Abramowicz, “The effective crushing distance in axially compressed thin-walled metal columns, International Journal of Impact Engineering,” vol. 1, no. 3, pp. 309-317, 1983.
[https://doi.org/10.1016/0734-743X(83)90025-8]

-
W. Abramowicz and N. Jones, “Dynamic axial crushing of square tubes,” International Journal of Impact Engineering, vol. 2, no. 2, pp. 179-208, 1984.
[https://doi.org/10.1016/0734-743X(84)90005-8]

-
P. D. C. Yang and J. B. Caldwell, “Collision energy absorption of ship’s bow structures,” International Journal of Impact Engineering, vol. 7, no. 2, pp. 181-196, 1988.
[https://doi.org/10.1016/0734-743X(88)90025-5]

-
N. Jones and R. S. Birch, “Dynamic and static axial crushing of axially stiffened square tubes,” Proceeding of the Institute of Mechanical Engineers, Part C: Mechanical Engineering Science, vol. 204, no. 5, pp. 293-310, 2016.
[https://doi.org/10.1243/PIME_PROC_1990_204_110_02]

- N. Jones, Structural Impact: Cambridge University Press., pp. 403-405, 1989.
- E. Lehmann and Y. Xing, “Energy dissipation of plastic hinges under dynamic loads,” Proceeding of International Conference on Designs and Methodologies for Collision and Grounding, pp. 3.1-3.12, 1996.
- J. Y. Chung, On The Collision Strength Of Ship’s Bow, Ph. D. Dissertation, Department of Naval Architecture and Ocean Engineering, Pusan National University, Busan, Korea, 1997 (in Korean).
- Dassault Systèmes Simulia Corporation, Abaqus 6.14 Theory Manual, 2014.
-
Y. I. Park, J. -S. Cho, and J. -H. Kim, “Numerical and experimental investigation of quasi-static crushing behaviors of steel tubular structures,” Materials, vol. 15, no. 6, p. 2107, 2022.
[https://doi.org/10.3390/ma15062107]

-
G. R. Cowper and P. S. Symonds, Strain-hardening and strain-rate effects in the impact loading of cantilever beams, Technical Report No. 28, Brown Univ Providence Ri, USA, 1957.
[https://doi.org/10.21236/AD0144762]


