WAVE Communication-based V2I Channel Modeling
Copyright © The Korean Society of Marine Engineering
This is an Open Access article distributed under the terms of the Creative Commons Attribution Non-Commercial License (http://creativecommons.org/licenses/by-nc/3.0), which permits unrestricted non-commercial use, distribution, and reproduction in any medium, provided the original work is properly cited.
Abstract
Wireless access in vehicle environment (WAVE) communication is currently being researched as core wireless communication technologies for cooperative intelligent transport systems (C-ITS). WAVE consists of both vehicle to vehicle (V2V) communication, which refers to communication between vehicles, and vehicle to infrastructure (V2I) communication, which refers to the communication between vehicles and road-side stations. V2I has a longer communication range than V2V, and its communication range and reception rate are heavily influenced by various factors such as structures on the road, the density of vehicles, and topography. Therefore, domestic environments in which there are many non-lines of sight (NLOS), such as mountains and urban areas, require optimized communication channel modeling based on research of V2I propagation characteristics. In the present study, the received signal strength indicator (RSSI) was measured on both an experience road and a test road, and the large-scale characteristics of the WAVE communication were analyzed using the data collected to assess the propagation environment of the WAVE-based V2I that is actually implemented on highways. Based on the results of this analysis, this paper proposes a WAVE communication channel model for domestic public roads by deriving the parameters of a dual- slope logarithmic distance implementing a two-ray ground-reflection model.
Keywords:
WAVE, V2I, IEEE 802.11p, C-ITS1. Introduction
Presently, many studies are being conducted around the world to solve problems occurring on the road, such as traffic jams and pedestrian accidents. Cooperative intelligent transport systems (C-ITS) are being developed based on wireless access in vehicle environment (WAVE) communication, which is a wireless technology that allows vehicles to share information with other elements of the road system, such as with infrastructure, other vehicles, and people. WAVE communication consists of vehicle to vehicle (V2V) communication, which refers to communication between vehicles, and vehicle to infrastructure (V2I) communication, which refers to communication between vehicles and roadside stations. WAVE is implemented to prevent or minimize accidents by delivering various data sets, such as front and back traffic information, vehicle movement, and the possibility of accidents occurring via communication with the infrastructure and surrounding vehicles [1][2].
WAVE communication adheres to the IEEE 802.11p standard, which was written to modify the physical (PHY) layer and the media access control (MAC) layer of IEEE 802.11a in accordance with the vehicle communication environment. This provides WAVE communication with a level of performance that ensures wide coverage and fast access in line with vehicle communication standards.
To achieve commercial viability for use on public roads, the V2I system must be optimized in terms of composition, performance, and design by analyzing and modeling the wireless channel. In regards to the wireless channel characteristics of vehicle to everything (V2X) communication, V2V is actively researched both inside and outside South Korea, but V2I is has only been researched outside the country in a limited manner.
Ros et al. analyzed the propagation environment of WAVE communication by simulating spatial factors, such as highways and downtowns, as well as environmental factors, such as path loss, fading, and obstacles [3]. However, they addressed only V2V, and the current research on propagation modeling of V2I is insufficient.
Sommer et al. [4] analyzed the V2V propagation model for a building based on an actual road environment and designed a characteristic model. However, it is difficult to understand the overall environment of V2X because their study did not include research on the propagation model of V2I.
Domestic research on V2I is insufficient because it is difficult to construct the infrastructure needed, such as the installation of roadside stations, and to implement the necessary technology. Propagation environment modeling for V2I that is appropriate for South Korea a domestic environment, which has many mountains and urban areas, unlike the environments of the USA and Europe, is needed.
In this paper, an optimized model is proposed for the WAVE-based V2I communication channel that is to be constructed in for public roads in South Korea by deriving model parameter values that are appropriate for the domestic propagation environment. In order to do this, 5.9-GHz band signals that are transmitted on public roads where stations were tentatively going to be installed were collected, and the propagation characteristics were analyzed by large-scale fading. Then, a V2I communication model was designed by applying the dual-slope log-distance based two-ray ground-reflection model, which is the most appropriate model for this particular road environment.
2. Related Theory
2.1 WAVE Communication Standard
WAVE communication was standardized in the IEEE 802.11p, which was written to modify the PHY and MAC layers of IEEE 802.11a. The latter is the wireless LAN (WLAN) standard, which corresponds to wireless connection between vehicles and roadside stations.
Table 1 shows the major characteristics of IEEE 802.11a and IEEE 802.11p. Unlike IEEE 802.11a, which uses the 5-GHz Industry Science Medical (ISM) band, IEEE 802.11p uses the independent frequency band of 5.850–5.925 GHz to reduce co-channel interference caused by band collision. Furthermore, it guarantees enhanced multipath mitigation by reducing the channel bandwidth of 20 MHz to 10 MHz and supports a transmission rate of 3–27 Mbps depending on the modulation method.
2.2 Modeling of wireless channel
Channel modeling of the V2I system for public roads is crucial in implementing highly reliable WAVE communication for effective intelligent transport system (ITS) services. Propagation wave channel modeling refers to a graphical representation of the attenuating pattern of the propagation wave radiating from the transmitting terminal to the receiving terminal according to the environment. The propagation model can be interpreted by using both large-scale fading and small-scale fading. Large-scale fading refers to propagation analysis considering path loss due to the increasing distance between the transmitting terminal and the receiving terminal as well as the shadowing that occurs because of the obstacles between them. Channel modeling is complete once small-scale fading is analyzed by considering multi- path mitigation based on large-scale fading. In this paper, a large-scale fading model, which is the basis of the WAVE communication channel model, is constructed.
The log-distance model [5], which is the basis of the path-loss model, is expressed as:
| (1) |
where Pt denotes the measured transmission power of the transmitting terminal and Pr denotes the measured reception power of the receiving terminal. The signal attenuation can be determined with respect to distance d. Equation (2) represents Friis’ free space propagation model [6], which can derive the propagation attenuation size in free space with respect to antenna gain. Gtr denotes the antenna gain of each transmitter and receiver, λ denotes the wavelength of the WAVE communication band, and Lsystem denotes the system loss.
| (2) |
Friis’ free space propagation model, which assumes an ideal environment, is difficult to apply to an actual road environment where the ground causes reflection of radio waves. Thus, a two-ray ground-reflection model [6] that considers the largest reflected waves of the ground is primarily used in this study. This model is used to derive Equation (3) by calculating the largest reflected waves from the ground in the attenuation model while considering the heights of the transmitter and receiver, where ht is the height of the transmitter and hr is the height of the receiver.
| (3) |
The Friis model can be applied if the distance is smaller than the crossover distance dx, at which the attenuation characteristics between the transmitter and the receiver in free space change. Meanwhile, because the two-ray ground-reflection model can better represent inter-vehicle communication on the road, it can be applied favorably if the distance is longer than dx. This crossover distance is defined by the following Equation (4):
| (4) |
The test in the present study used WAVE communication in the 5.9-GHz band with transmitter and receiver heights of 3 m and 1.5 m respectively. Thus, dx ≈ 1109 m. In other words, if a vehicle is 1109 m away from the station, an attenuation of four times the distance occurs. Furthermore, the reference distance d0 of the far field can be included in the log-distance model of Equation (5). Here, the far-field reference distance of the WAVE communication is calculated to be 10 m [7] or 1 m [8], which are the WLAN standards. In this study, a distance of 10 m is applied.
| (5) |
In Equation (5), k is the attenuation coefficient, for which 2.0 is used for free space and 4.0 or higher is used for an urban environment. When the dual-slope model [7], which can select different models for different reference distances, is applied for this case, Equation (6) is obtained. For this dual-slope model, the log-distance model of free space with a coefficient k is applied if the distance is smaller than the reference distance, and the two-ray ground-reflection log-distance model is applied with the new coefficient k2 otherwise. Therefore, a dual slope model that can express long-range propagation characteristics can be derived by using the two-ray ground-reflection model based on reference distance, as shown in Equation (6).
| (6) |
If the log-normal model is applied using Xσ, which is the zero-mean normally distributed random variable with standard deviation from Equation (6), we obtain the following Equation (7):
| (7) |
If the log-normal model is divided by the reference distances d0 and dx, and applied to Equation (6), it results in Equation (8). Here, for X1 and X2, the probability distribution based on the dispersion at each distance is applied.
| (8) |
The WAVE channel model is analyzed based on the log-normal of Equation (8).
3. WAVE Propagation Environment Test
3.1 Measurement Environment
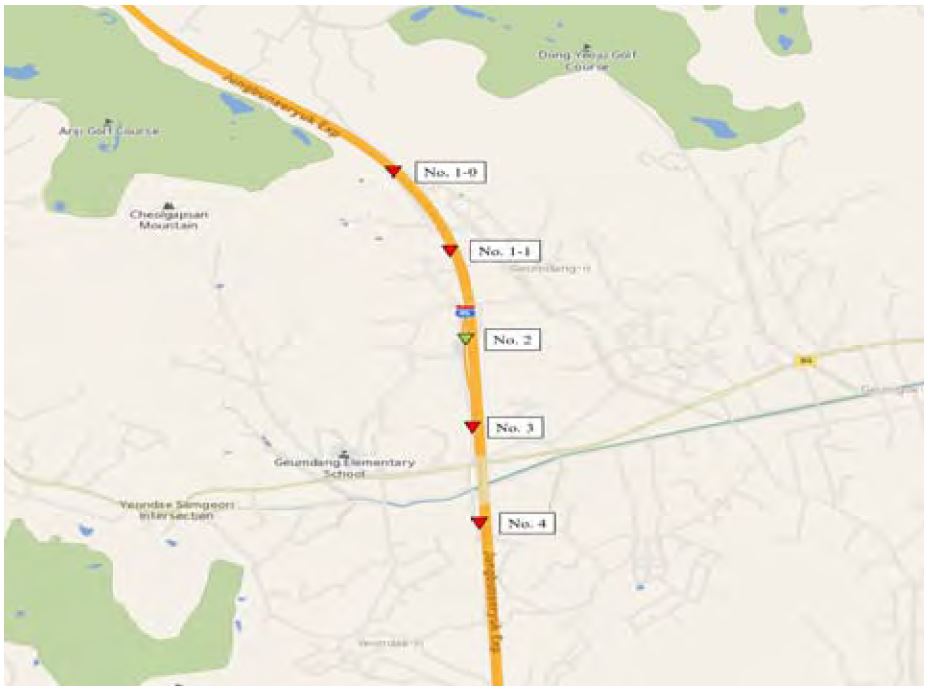
To design a model optimized for South Korea domestic environment, we measured the WAVE signals on both the Yeoju experience road and on the Seoul test road in which the V2I infrastructure had been constructed [9][10]. Figure 1 shows the location and surrounding environment of the roadside stations on the experience road, located south of the Yeoju Interchange. The triangles in Figure 1 represent the stations themselves, with red indicating an unused station and green indicating an active one. As shown in Figure 1, five stations were installed on this road at about 1-km intervals. A section of about 1.5 km from the transmitter was measured from station no. 2. The Yeoju experience road was constructed alongside the southward expressway coming out of the Yeoju Interchange and contains almost no obstacles because it is not in use as a public road.
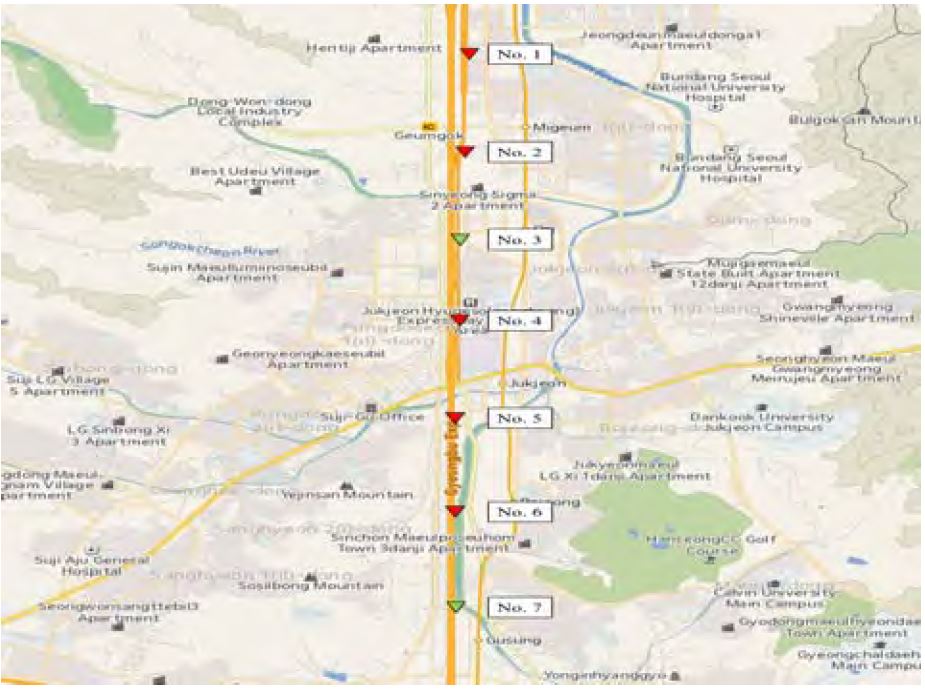
Figure 2 shows the station locations of the test road in Gyeonggi Province and their surrounding environment. The triangles in Figure 2 indicate the locations of roadside stations, red and green once again indicating active and inactive stations respectively. Seven stations were installed between Seoul Interchange and Singal Interchange with about 1-km intervals between them, and only the third and the seventh stations were activated in order to minimize interference from the radio waves of adjacent stations. To create an environment that was more similar to an actual road-driving situation, the WAVE signals were measured while driving an actual vehicle.
The test road was a fully operational expressway with a typical road environment that was being used by numerous vehicles. Therefore, it was possible to measure various WAVE signals that had been distorted by obstacles in other lanes, such as large vehicles.
Because the experience road and the test road had different road environments, we were able to obtain various data points, such as the propagation attenuation characteristics in free space and some signals that had been distorted by obstacles in the two environments. A propagation channel model for a public road was created by using the results of an area with almost no obstacles, and the reliability of this model was verified by comparing it to the results of the actual road situation when obstacles were included.
3.2 Measurement Method
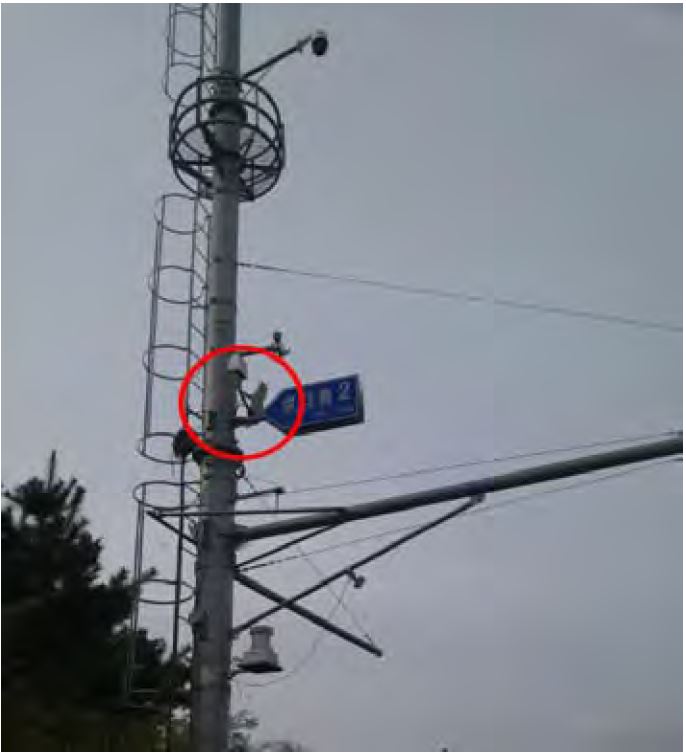
We used a 5.9-GHz antenna and a spectrum analyzer to collect the WAVE signals transmitted from the V2I base-stations installed along both the Yeoju experience road and the Seoul test road section. The existing WAVE communication stations were used as transmitters. To design a basic large-scale fading model for the Yeoju experience road, the WAVE signals were measured at least 10 times, in order to remove the small-scale fading phenomena at each location, and at intervals of 10 m, in order to obtain sufficiently dense data points, over a total distance of 1.5 km, using the stations on a road section containing the smallest number of fixed obstacles. Figure 3 shows the second roadside station installed on the experience road. The directional receiving antenna and the three-directional transmitting antenna in the red circle were set at heights of 1.5 m and 3 m, respectively.
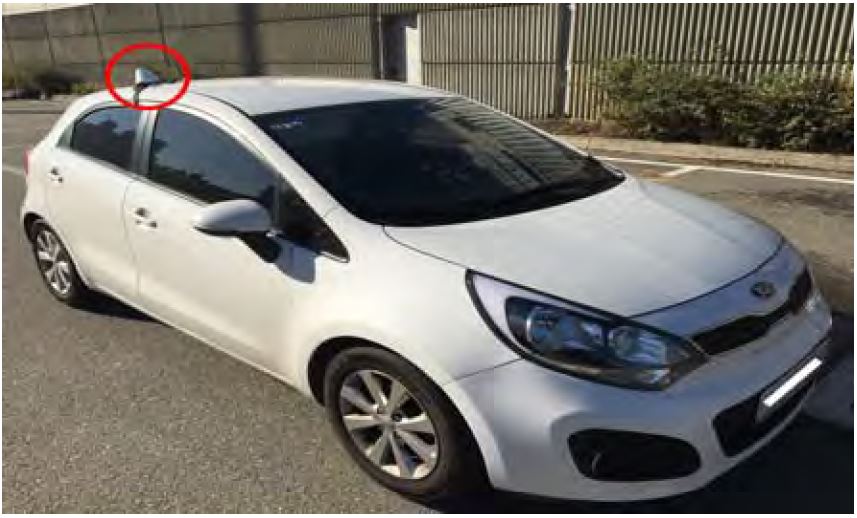
Because the test road section was an expressway in full operation, and it was impossible to make measurements under static conditions, we collected the measured WAVE signals while driving. Due to the noise created by obstacles such as the vehicles in other lanes, which had not been present on the experience road, this model was verified by using both the model that had been derived from the Yeoju experience road as well as the signals measured on the test road. Figure 4 shows the vehicle that was used for measurement. The antenna in the red circle is the omnidirectional antenna. Table 2 shows the major antenna factor characteristics of the transmitter and the receivers used in both Yeoju and Seoul. The vehicle carrying these measurement devices travelled back and forth between the Seoul Interchange and the Singal Interchange five times at the highway speed limit of 80 km/h.
4. Measurement Results and Modeling
4.1 Measurement Results
In this section, the data measured on the Yeoju experience road and the Seoul test road is analyzed. The WAVE communication frequency band was assigned to 75 MHz, but only one channel band of frequency 10 MHz with a central frequency of 5.860 GHz was used to minimize the interference of the surrounding frequencies in this measurement. Furthermore, the output value of the signal that was received by the transmitting antenna from the station communication model was 20 dBm, the gain was 12 dBi, and the system loss was 5 dB. Measurements were made in 10-m increments during movement, and the first measurement point was about 10 m away from the station. In summary, index 1 was 10 m and index 100 was 1 km from the station [11][12].
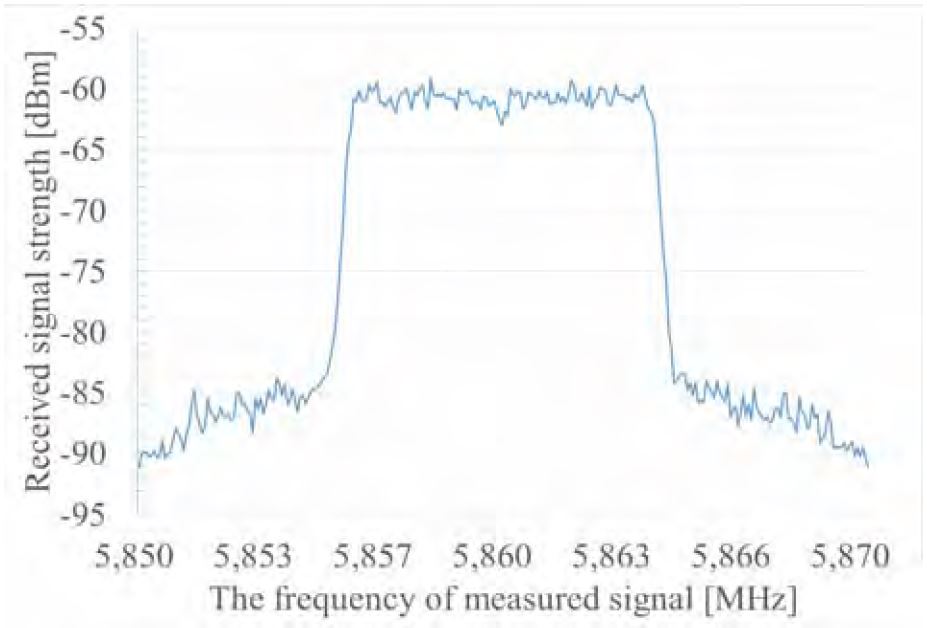
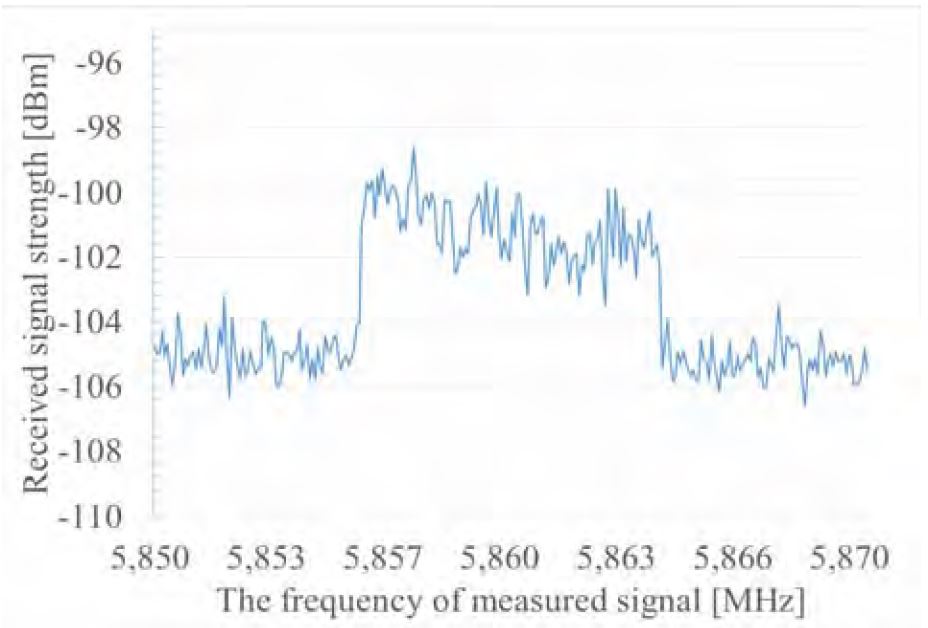
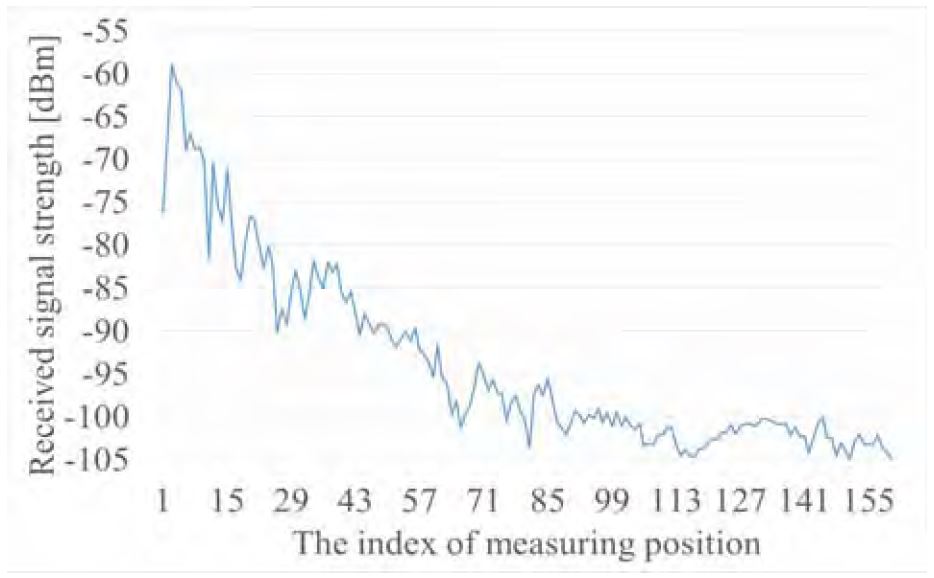
Figure 5 shows the maximum number of signals measured at index 3 for each frequency. The x-axis represents the frequency of the WAVE signals and the y-axis represents the WAVE reception signal strength. Figure 6 shows the maximum signal strength for each frequency at index 100. The x-axis represents the frequency of the measured WAVE signals and the y-axis represents the WAVE reception signal strength. From Figure 5 and Figure 6, we can see that WAVE signals at around 5.860 GHz were received from the 10 MHz band, and that a –60.8 dBm signal is inputted in a 30-m section. Furthermore, a signal of around –101.1 dBm was received in a 1-km section. Similar to Figure 5 and Figure 6, Figure 7 shows the mean value of the center 10 MHz band at 5.860 GHz by distance.
Figure 7 shows the measured results of the 5.860 GHz WAVE signals according to the index (in 10-m intervals) from the roadside station. The x-axis represents the position index, and measurements were made in 10-m intervals during movement from the first measurement point. The y-axis represents the strengths of the received WAVE signals measured at the receiving terminal. It can be seen that the measured values decrease in logarithmic form with distance, so the log-distance model mentioned in Section 2 can be applied. The measured strengths of the received signals between indexes 1–3 was weak because, as shown in Figure 3, the sign in front of the transmitter antenna was obscuring the path between the transmitter and receiver antennas. Furthermore, slightly low WAVE signals were recorded in the sections about 200 m and 600 m from the first measurement due to the fixed obstacles obscuring the transmitter. The strength of the received WAVE signals decreased as the distance from the first measurement grew, and it fell to –100 dBm or lower after around the 1 km mark.
4.2 WAVE Communication Channel Modeling
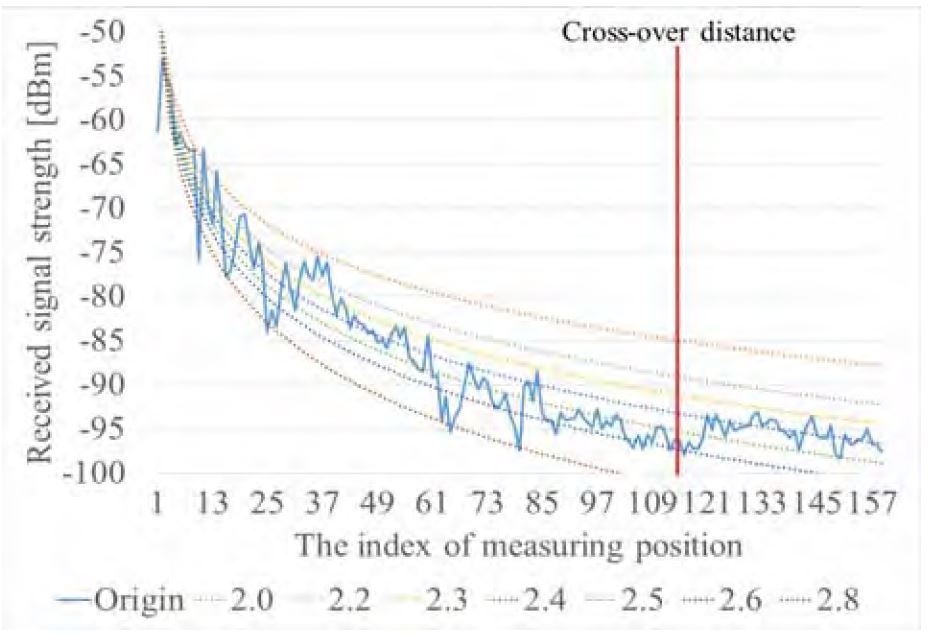
Channel modeling was performed based on the measured results of the WAVE signals. The dual-slope log-distance model, which can take propagation characteristics according to the reference distance into partial account by using a two-ray ground-reflection model that can consider the reflection coefficient of the ground, was applied. The advantages of this method were its ability to analyze communications for transmission and reception distances larger than those that other communication methods allow for and its ability to reflect the signal characteristics that vary by distance in free space. Figure 8 shows the log-distance model created when coefficients of 2.0-2.8 were applied to determine the optimum coefficient k1 from Equation (5). Here, the x-axis represents the position index and the y-axis represents the WAVE reception signal strength. The red line in this graph denotes the crossover distance, which is the point at which the propagation attenuation characteristics change. The curve created by k1 is applied only to the graph sections to the left of the red line. Because the measured data represents the maximum value at each index position, it only has to correspond to the model curve on top of the measured data graph according to the coefficient. Therefore, the most appropriate attenuation graph for the measured data is obtained at k1 = 2.4.
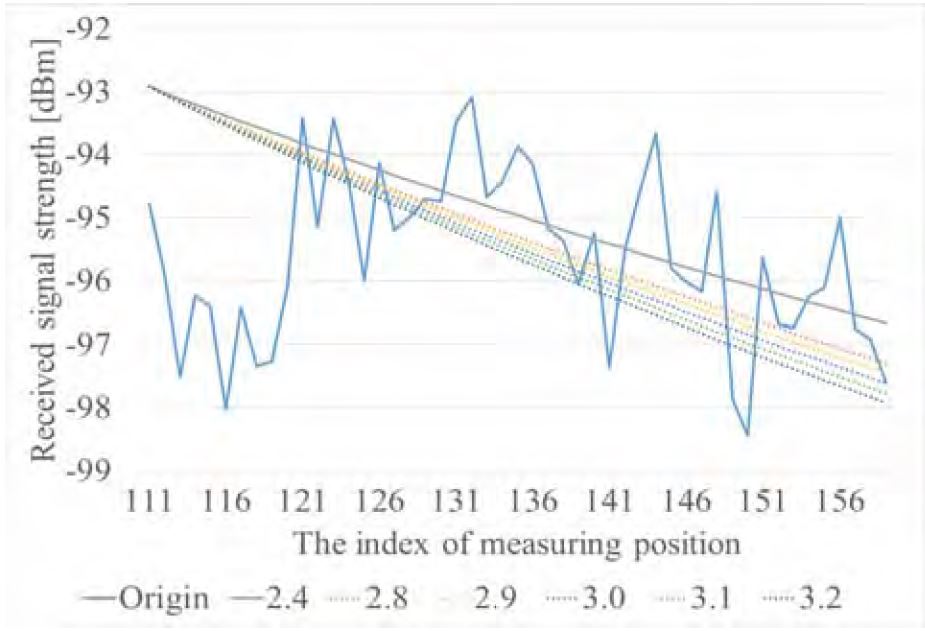
Because a two-ray ground-reflection model was applied, Friis’ model is not applicable after the crossover distance, as described in Chapter 2. Therefore, a new coefficient k2 was required. The new model was applied to the graph sections after the distance dx based on dx ≈ 1109 m, which was derived from Equation (4). As shown in Figure 9, the coefficient was varied between 2.8 and 3.2 in order to determine the value of k2 . The x-axis in this graph represents the position index and the y-axis represents the WAVE reception signal strength. The most appropriate parameter value for the coefficient k2 was determined to be 3.0.
Finally, the parameter values required for the modeling process were determined, as shown in Equation (9). The final modeling equation can be produced using these values.
| (9) |
| (10) |
Equation (10) shows the model derived from the above process in this study.
5. Conclusion
This paper analyzed the V2I environment of the 5.9-GHz band WAVE communication used on public roads by considering the existing communication channel model and proposed a basic large-scale fading model based on the data measured on both an experience road and a test road in a public road environment. The parameter values were determined by the measurements, which were then applied to a dual-slope log-distance model that was based on a two-ray ground-reflection model to derive a WAVE communication channel model.
In the future, we will research a large-scale fading model that takes fixed obstacles, such as mountains and urban areas (which are commonly near highways) into account and derive a small-scale fading model that is suitable for South Korean road environments.
Acknowledgments
This research was supported by a grant (15TLRP-B101406-01) from the Transportation & Logistics Research Program funded by Ministry of Land, Infrastructure and Transport of Korean government.
References
- Korea Communication Agency, “V2X Communication”, Has emerged as the Intelligent Transport System's core technology, p06.
- T. W. Hwang, “Development trend of vehicles and communication technology”, The Journal of Communications Radio, 10(54), p92-93, (2012).
-
Ros, Francisco J., Juan A. Martinez, and Pedro M. Ruiz, “A survey on modeling and simulation of vehicular networks: Communications, mobility, and tools", Computer Communications, 43, p1-15, (2014).
[https://doi.org/10.1016/j.comcom.2014.01.010]

- Sommer, Christoph, et al. , “A computationally inexpensive empirical model of IEEE 802.11 p radio shadowing in urban environments", Wireless On-Demand Network Systems and Services (WONS), 2011 Eighth International Conference on, IEEE, (2011), p84-90.
- T. S. Rappaport, “Wireless Communications: Principles and Practice", second ed”, Prentice Hall, (2002).
- H. Friis, “A note on a simple transmission formula, in: 1.R.E. and Waves and Electrons”, p254-256, (1946).
- Intelligent Transport Systems (its), STDMA recommended parameters and settings for cooperative its; access layer part, Technical Report, ETSI TR 102 n861 V1.1.1, ETSI, (2012).
- Q. Chen, F. Schmidt-Eisenlohr, D. Jiang, M. Torrent-Moreno, L. Delgrossi, and H. Hartenstein, “Overhaul of IEEE 082.11 modeling and simulation in ns-2, in:MSWiM’07", Proceedings of the 10th ACM/IEEE International Symposium on Modeling, Analysis, and Simulation of Wireless and Mobile Systems, p159-168, (2007).
-
S. B. Park, J. W. Ahn, and E. G. Kim, “Design and implementation of secure vehicle communication protocols for WAVE communication systems", Journal of the Korea Institute of Information and Communication Engineering, 19(4), p841-847, (2015).
[https://doi.org/10.6109/jkiice.2015.19.4.841]

-
Y. S. Song, and H. J. Yun, “Link budget of WAVE communication system for a reliable ITS service under highway environments", Journal of The Korea Institute of Intelligent Transport Systems, 14(4), p80-85, (2015).
[https://doi.org/10.12815/kits.2015.14.4.080]

-
J. S. Park, G. D. Choi, J. W. Kim, and H. R. Cho, “A study on the EMI in special power distribution zone on ship", Journal of The Korea Society of Marine Engineering, 38(6), p730-736, (2014).
[https://doi.org/10.5916/jkosme.2014.38.6.730]

-
G. D. Choi, J. W. Kim, and H. R. Cho, “A study on the EMF strength standard in propulsion system on ship", Journal of The Korea Society of Marine Engineering, 39(9), p929-934, (2015).
[https://doi.org/10.5916/jkosme.2015.39.9.929]


