Performance evaluation of principal component analysis for clustering problems
Copyright © The Korean Society of Marine Engineering
This is an Open Access article distributed under the terms of the Creative Commons Attribution Non-Commercial License (http://creativecommons.org/licenses/by-nc/3.0), which permits unrestricted non-commercial use, distribution, and reproduction in any medium, provided the original work is properly cited.
Abstract
Clustering analysis is widely used in data mining to classify data into categories on the basis of their similarity. Through the decades, many clustering techniques have been developed, including hierarchical and non-hierarchical algorithms. In gene profiling problems, because of the large number of genes and the complexity of biological networks, dimensionality reduction techniques are critical exploratory tools for clustering analysis of gene expression data. Recently, clustering analysis of applying dimensionality reduction techniques was also proposed. PCA (principal component analysis) is a popular methd of dimensionality reduction techniques for clustering problems. However, previous studies analyzed the performance of PCA for only full data sets. In this paper, to specifically and robustly evaluate the performance of PCA for clustering analysis, we exploit an improved FCBF (fast correlation-based filter) of feature selection methods for supervised clustering data sets, and employ two well-known clustering algorithms: k-means and k-medoids. Computational results from supervised data sets show that the performance of PCA is very poor for large-scale features.
Keywords:
Clustering algorithm, Dimensionality reduction, PCA, Feature selection1. Introduction
Clustering analysis is widely used in data mining to classify data into categories on the basis of their similarity. It is the formal study of methods and algorithms for the natural grouping, or clustering, of objects according to measured or perceived intrinsic characteristics or similarities. Clustering methods are especially useful for exploring interrelationships among neighbors. Applications range broadly from pattern recognition to microarrays, multimedia, bibliometrics, bioinfomatics, and gene profiling.
Clustering algorithms can be classified into two general categories: hierarchical and non-hierarchical methods. Hierarchical methods classify the original data into similar categories without predetermining the number of clusters. Several hierarchical methods have been developed : linkage methods [1], Ward’s method [2], DIANA algorithm [3], and DPC (density peaks clustering) [4] algorithm, etc. Linkage methods include single, complete, and average or centroid linkage. For example, the single linkage method is to connect the nearest neighbor by Euclidean distance. In contrast to the single linkage, complete linkage method is to cluster the farthest neighbor. Rodriguez et al. [4] proposed an efficient DPC algorithm that cluster centers are characterized by a higher density than their neighbors.
Non-hierarchical methods are clustering algorithms in which the number of clusters is predetermined. These include k-means [5], k-medoids (PAM(patitioning around medoids) [3]), CLARA (clustering large applications) [3], and so on.
In gene profiling, however, because of the large number of genes and the complexity of biological networks, dimensionality reduction techniques are critical exploratory tools for clustering analyses of gene expression data. Recently, clustering methods themselves have been proposed as ways of reducing dimension. Dimensionality reduction techniques are based on feature extraction methods: SVD (singular value decopositon) [6], PCA [7], LSA (latent semantic analysis) [8], RP (random projection) [9]. Feature extraction is generally a procedure of unsupervised learning to apply the clustering analysis. In particular, PCA is a useful method of feature extraction for clustering problems. Yeung et al. [10] showed that PCA was efficient to apply clustering analysis in gene profiling problems. Song et al. [11] performed a comparative study of dimensionality reduction techniques to enhance trace clustering performances, and showed that dimensionality reduction could improve trace clustering performance in relation to the computation time and average fitness of the mined local-process models.
However, Yeung et al. [10] and Song et al. [11] compared the classification accuracies for the full data and the reduced data by PCA. In this paper, to specifically and robustly evaluate the performance of PCA for clustering analysis, we exploit an improved FCBF (fast correlation-based filter) of feature selection methods for supervised clustering data sets. We employ two well-known clustering algorithms: k-means and k-medoids. Computational results from supervised learnig show that the performance of PCA is very poor for large-scale features.
The remainder of this paper is organized as follows. Diensionality reduction techniques and clustering methods are introduced in Sections 2 and 3, respectively. In Section 2, we focus on PCA of feature extraction methods, and briefly mention the feature selection of dimensionality reduction techniques. In Section 3, we deal with two well-known clustering algorithms: k-means and k-medoids clustering algorithm. In Section 4, the computational results for performance are presented. Finally conclusions are drawn in Section 5.
2. Dimensionality Reduction Techniques
The dimensionality of data refers to the number of features or attributes that describe each record in real-world data. Most data mining applications are composed of high-dimensional data, in which not all of the features are relevant. Highdmensional data can contain many irrelevant, redundant or noisy features that may greatly decrease the performance of data mining process. In addition, many algorithms become computationally intractable because of the so-called “curse of dimensionality”.
In data mining field, reduction-dimensionality is an important step in the preprocessing data. Dimensionality reduction techniques not only profilerate the data mining algorithms faster, but also provide higher accuracy of a data mining process so that the model can be represented better from the data.
Dimensionality reduction techniques usually involve two steps: feature extraction and feature selection. Feature extraction is generally an unsupervised learning procedure for applying the clustering analysis. Feature extraction methods include SVD, PCA, LSA, and RP. Typically, PCA is a popular method of feature extraction for clustering problems. Yeung et al. [10] showed the efficiency of PCA to apply clustering analysis in gene profiling problems. Song et al. [11] performed a comparative study of dimensionality reduction techniques to enhance trace clustering performances.
However, Yeung et al. [10] and Song et al. [11] analyzed the performance of PCA for only full data sets. To evaluate PCA performance for clustering problems, we exploited feature selection for the supervised clustering cases. We selected an I-FCBF as the feature selection method, known as the best [12].
2.1 PCA
The most popular feature extraction method for reducing the dimensionality of a large data set is a form of PCA known as the Karhunen-Loeve method. PCA is to reduce the dimensionality of data by transforming the full original attribute space into a smaller space by using an important property of eigenvalue decomposition. The basic idea of PCA is to derive new variables that are combinations of the original ones, and that are uncorrelated and arranged in order of decreasing variance.
The full procedure of this algorithm is given in [13].
- (i) Normalization: make each attributes have the same mean (zero) and variance.
- (ii) Calculate the covariance matrix Σ.
- (iii) Calculate the eigenvectors ui and eigenvalues λi of Σ.
- (iv) Sort these eigenvalues in decreasing order and stack the eigenvectors λi corresponding to the eigenvalues λi in columns to form the matrix U.
2.2 I-FCBF (Improved FCBF)
Feature selection is usually a supervised dimensionality reduction procedure that involves removing irrelevant and redundant features of high-dimensional data. The filter methods of feature selection can be broadly divided into two classes: univariate and multivariate approaches. Univaiate filter methods are computationally very efficient due to the ignorance of the dependency between features. Thus, with univariate approaches, computing time is extremely fast, but they produce less accurate solutions. To overcome this flaw of the univariate filter, in which the dependency between features is ignored, multivariate approaches have been proposed in the literature. The FCBF [14], I-FCBF [12], and mRMR (minimum Redundancy Maximum Relevance) [15] are well-known efficient multivariate approaches. Among them, we exploite the I-FCBF to evaluate performance of PCA.
The pseudocode of I-FCBF is as follows.
3. Clustering Methods
Many clustering methods including hierarchical and nonhierarchical algorithms have been developed. Non-hierarchical methods are clustering algorithms in which the number of clusters is predetermined. These include k-means, k-medoids (PAM), CLARA, and so on. Among them, we employed two well-known methods for clustering algorithms (k-means and k-medoids) in order to compare the performance of PCA. In this section, we briefly mention the two methods.
3.1 k-means method
The k-means algorithm is one of the simplest unsupervised learning algorithms for cluster analysis. The algorithm aims to partition observations into k clusters that each observation belongs to the cluster of minimizing the following objective function,
| (1) |
where ||xi(j) − cj||is the Euclidean distance between observation ||xi(j) − cj|| and cluster center cj.
The algorithm is composed of the following steps:
- (i) Select k observations randomly. Set these observations to be the initial centroids.
- (ii) Assign each observation to the cluster that has the nearest centroid.
- (iii) Once all observations have been assigned, recalculate the positions of the k centroids.
- (iv) Repeat steps (ii) and (iii) until the centroids no longer move.
3.2 k-medoids method
The k-medoids algorithm is similar to the k-means clustering algorithm. However, k-menas algorithm is sensitive to outliers. For this reason, the k-mediods algorithm considers representative observations called medoids instead of centroids. Because it chooses the most centrally located observation in a cluster, it is less sensitive to outliers than the k-maens algorithm. The most common realization of K-medoids algorithm, PAM, is selected in this study. The PAM procedure is as follows:
- (i) Select k observations randomly. These observations are the initial medoids.
- (ii) Assign each observation to the cluster that has the nearest medoid.
- (iii) Select a non-medoid observation randomly.
- (iv) Compute the total cost of swapping the old medoid with the currently selected non-medoid observation.
- (v) If the total cost of swapping is less than zero, then perform the swap operation to generate a new set of k medoids.
- (vi) Repeat steps (ii), (iii), (iv) and (v) until the medoid locations stabilize.
4. Computational Results
To evaluate the performance of PCA, five data sets were selected from the literatures. These data sets are shown in Table 1. For example, the ORL dataset contained 1024 features, 400 samples, and 40 classes. The class sizes of ISOLET, COIL, and ORL are 26, 20, and 40, respectively. Their sizes are larger than the data set of Lung and Carcinom. Features of Lung and Carcinom have a large number of 3312 and 9182, respectively.
To evaluate the performances of clustering methods, the following measure of popular Rand index [16] is usually used,
| (2) |
- a: the number of pairs in the original data set S that are in the cluster X and Y
- b: the number of pairs in S that are not in the cluster X and not in the cluster Y
- c: the number of pairs in S that are in cluster X and not in the cluster Y
- d: the number of pairs in S that are not in cluster X and in the cluster Y.
In our experiments, we employed the following measure of adjusted Rand index [17] for more accurate analysis.
| (3) |
In general, the higher the value of the adjusted Rand index, the better the performance of the clustering algorithms.
In this study, computational experiments were conducted on an Intel i7 PC with 3.4 GHz CPU and 8 GB RAM. All source codes were implemented with the R language.
PCA is an unsupervised procedure of dimensionality reduction techniques. To robustly evaluate the performance of PCA, we employed five supervised data sets and I-FCBF of supervised feature selection for reduction-dimensionality.
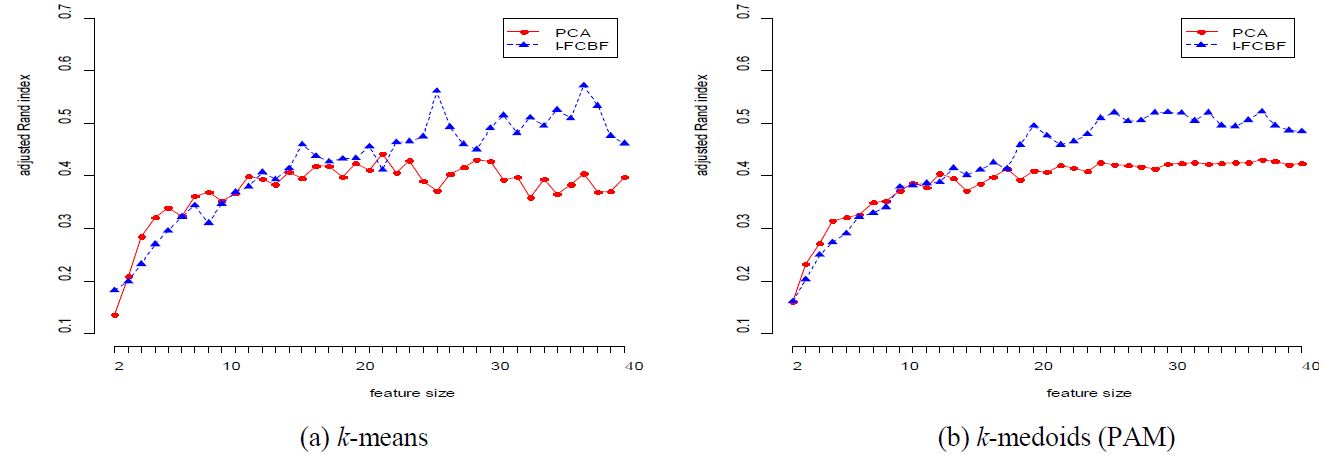
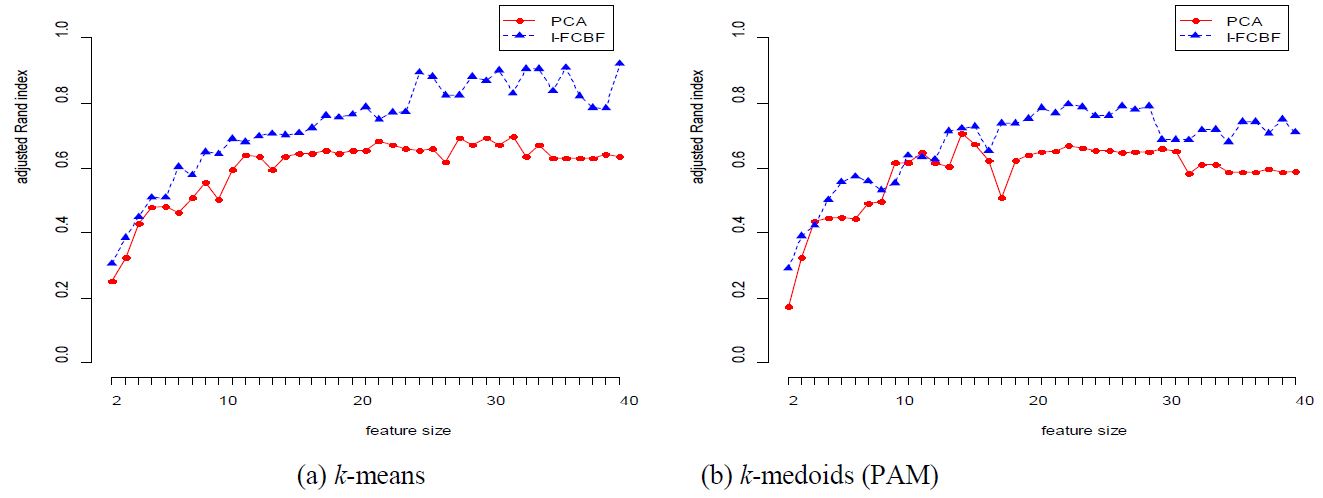
The results for adjusted Rand index are shown in Tables 2 - 6. For the ORL data set (Table 2), we note that the performance of PCA is very close to that of I-FCBF. However, as the reduction dimension grows, the performance of PCA was more or less worse than that of I-FCBF for k-means and k-medoids.
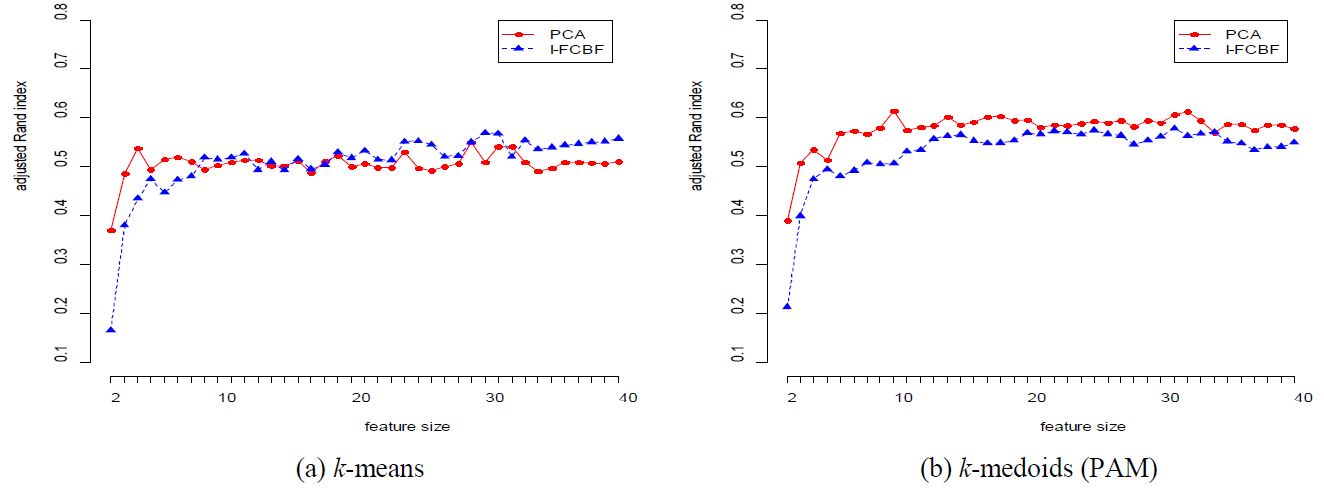
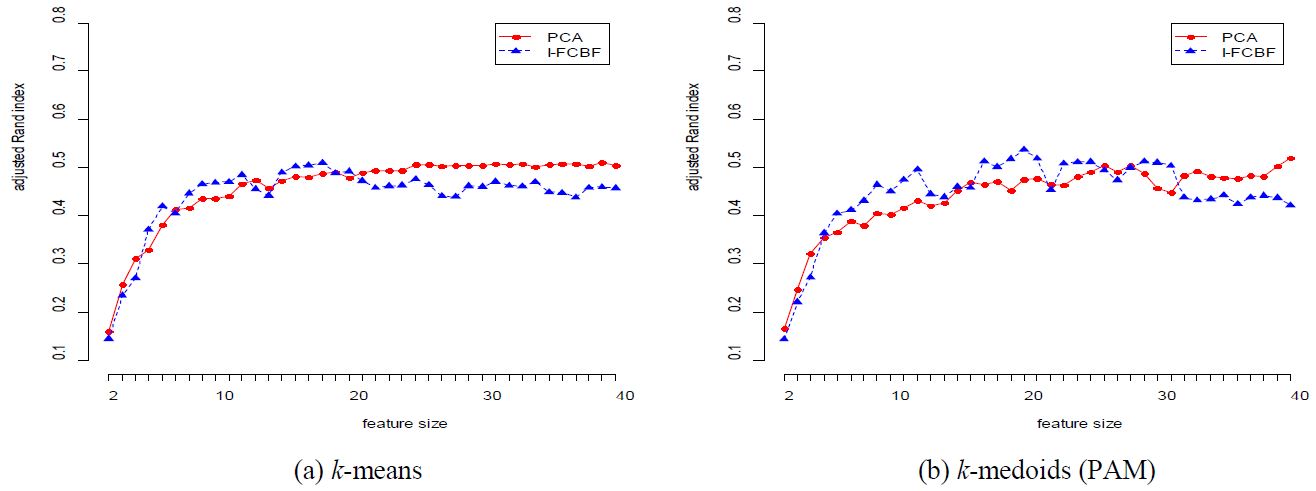
The results for the COIL data set are given in Table 3 and Figure 2. In this case, the performance of PCA is very good for most cases. However, as the reduction dimension grows, the performance of PCA becomes worse than that of I-FCBF for k-means method. For the ISOLET data set, we note that the performance of PCA is very close to that of I-FCBF of supervised feature selection. That is, this means that PCA obtains good results with ISOLET which has relatively few features (617).
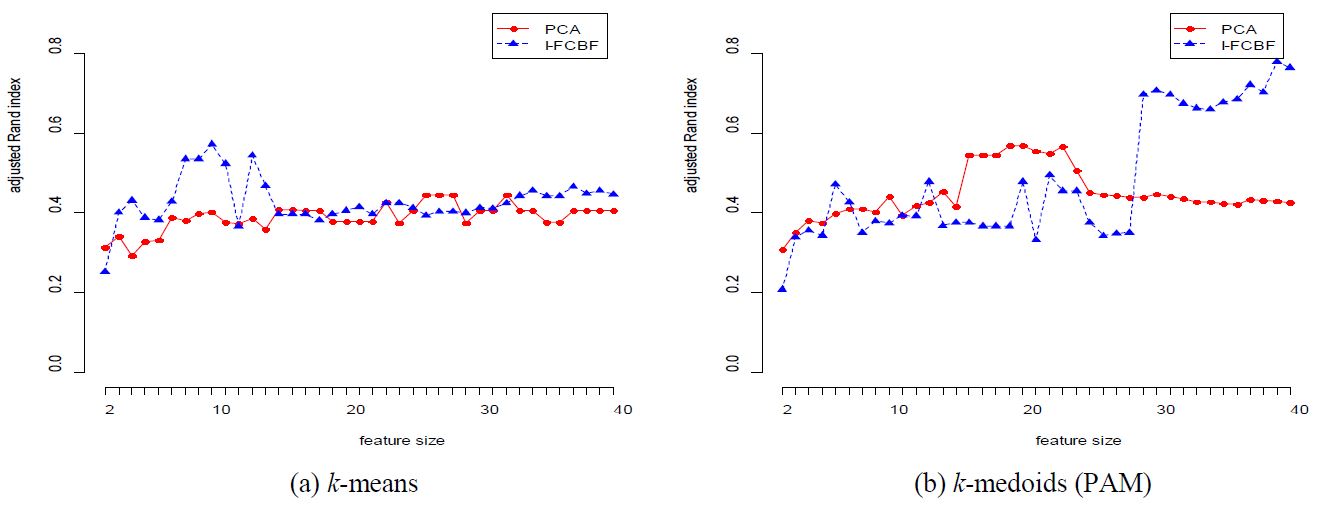
We also tested data sets with large-scale features. From Table 1, the Lung and Carcinom data sets have a large number of 3312 and 9182, respectively. For these data sets, however, we observed that the PCA performance was very poor for k-medoids. Specifically, from Table 5, the value of the adjusted Rand index of PCA is 0.4248 for k-medoids when the number of dimensions is 40, whereas I-FCBF obtained the value of 0.7647. This is an appreciably gap ( >0.3) in adjusted Rand index. We also obtained very similar results for the Carcinom data set. From Table 6, as the number of dimensions grows, we note that the PCA performance is very poor for both methods.
5. Conclusions
Through the decades, many clustering techniques have been developed, including hierarchical and non-hierarchical algorithms. Recently, dimensionality reduction using cluster analysis has also been proposed. A popular method of feature extraction in clustering problems is PCA. Yeung et al. [10] showed the efficiency of PCA for clustering analysis in gene profiling problems. Song et al. [11] performed a comparative study of dimensionality reduction techniques for enhancing trace clustering performances.
To evaluate the performance of PCA robustly, we employed five supervised data sets and I-FCBF of supervised feature selection for reduction-dimensionality, using two well-known clustering algorithms: k-means and k-medoids.
From our computational results, we observed that PCA obtained good results for the relatively few features of ORL, COIL, and ISOLET. For large-scale features, however, we noted that the performance of PCA was very poor for both methods as the number of dimensions grew.
In future work, we intend to develop a compensated and efficient PCA for large-scale features.
References
- T. Sorensen, “A method of establishing groups of equal amplitude in plant sociology based on similarity of species and its application to analyses of the vegetation on Danish commons”, Biologiske Skrifter, 5, p1-34, (1948).
-
J. R. Ward, and H. Joe, “Hierarchical grouping to optimize an objective function”, Journal of the American statistical association, 58(301), p236-244, (1963).
[https://doi.org/10.1080/01621459.1963.10500845]

- L. Kaufman, and P. J. Rousseeuw, Finding groups in data: an introduction to cluster analysis, John Wiley & Sons, (2009).
-
A. Rodriguez, and A. Laio, “Clustering by fast search and find of density peaks”, Science, 344(6191), p1492-1496, (2014).
[https://doi.org/10.1126/science.1242072]

- J. B. MacQueen, “Some Methods for classification and Analysis of Multivariate Observations”, Proceedings of the fifth Berkeley Symposium on Mathematical Statistics and Probability, 1(14), p281-297, (1967).
- K. Barker, “Singular value decomposition tutorial”, The Ohio State University, 24, (2005).
- I. Jolliffe, Principal Component Analysis, John Wiley & Sons, (2002).
-
T. K. Landauer, P. W. Foltz, and D. Laham, “An introduction to latent semantic analysis”, Discourse processes, 25(2-3), p259-284, (1998).
[https://doi.org/10.1080/01638539809545028]

-
E. Bingham, and H. Mannila, “Random projection in dimensionality reduction: applications to image and text data,”, Proceedings of the Seventh ACM SIGKDD International Conference on Knowledge Discovery and Data Mining, New York: Association for Computing Machinery, p245-250, (2001).
[https://doi.org/10.1145/502512.502546]

-
K. Y. Yeung, and W. L. Ruzzo, “Principal component analysis for clustering gene expression data”, Bioinformatics, 17(9), p763-774, (2001).
[https://doi.org/10.1093/bioinformatics/17.9.763]

-
M. Song, H. Yang, S. H. Siadat, and M. Pechenizkiy, “A comparative study of dimensionality reduction techniques to enhance trace clustering performances”, Expert Systems with Applications, 40(9), p3722-3737, (2013).
[https://doi.org/10.1016/j.eswa.2012.12.078]

-
J. T. Kim, H. Y. Kum, and J. H. Kim, comparative study of filter methods based on information entropy”, Journal of the Korean Society of Marine Engineering, 40(5), p437-446, (2016).
[https://doi.org/10.5916/jkosme.2016.40.5.437]

-
M. Du, S. Ding, and H. Jia, “Study on density peaks clustering based on k-nearest neighbors and principal component analysis”, Knowledge-Based Systems, 99, p135-145, (2016).
[https://doi.org/10.1016/j.knosys.2016.02.001]

- L. Yu, and H. Liu, “Feature selection for high- dimensional data: A fast correlation-based filter solution”, International Conference Machine Learning, 3, p856-863, (2003).
-
H. Peng, F. Long, and C. Ding, “Feature selection based on mutual information criteria of max-dependency maxrelevance and min-redundancy”, IEEE Transactions on pattern analysis and machine intelligence, 27(8), p1226-1238, (2005).
[https://doi.org/10.1109/TPAMI.2005.159]

-
W. M. Rand, “Objective criteria for the evaluation of clustering methods”, Journal of the American Statistical Association, 66(336), p846-850, (1971).
[https://doi.org/10.1080/01621459.1971.10482356]

-
L. Hubert, and P. Arabie, “Comparing partitions”, Journal of Classification, 2(1), p193-218, (1985).
[https://doi.org/10.1007/BF01908075]


