Fluid–structure interaction simulation of a floating wave energy convertor with water-turbine driven power generation
Copyright © The Korean Society of Marine Engineering
This is an Open Access article distributed under the terms of the Creative Commons Attribution Non-Commercial License (http://creativecommons.org/licenses/by-nc/3.0), which permits unrestricted non-commercial use, distribution, and reproduction in any medium, provided the original work is properly cited.
Abstract
The Floating Wave Energy Convertor (FWEC) mooring design has an important requirement associated with the fact that, for a wave energy converter, the mooring connections may interact with their oscillations, possibly modifying its energy absorption significantly. It is therefore important to investigate what might be the most suitable mooring design according to the converter specifications and take into account the demands placed on the moorings in order to assure their survivability. The objective of this study is to identify a computational fluid dynamics method for investigating the effects of coupling a wave energy device with a mooring system. Using the commercial software ANSYS AQWA and ANSYS FLUENT, a configuration was studied for different displacements from the equilibrium position, load demands on the moorings, and internal fluid motion. These results and findings form a basis for future efforts in computational model development, design refinement, and investigation of station keeping for FWEC units.
Keywords:
Floating water energy converter (FWEC), ANSYS AQWA, ANSYS Fluent1. Introduction
There are many studies concerning wave energy converters (WEC); some models have already been deployed in the field, such as the Pelamis system and hydroelectric barrel (HEB) devices. This research introduces a similar energy converter shown in Figure 1. This device is a caisson-type floating wave energy convertor. The pitching motion of the device causes a column of water to rise and fall periodically in the double-hull housed in the caisson, creating a bi-directional flow that drives an internal turbine.
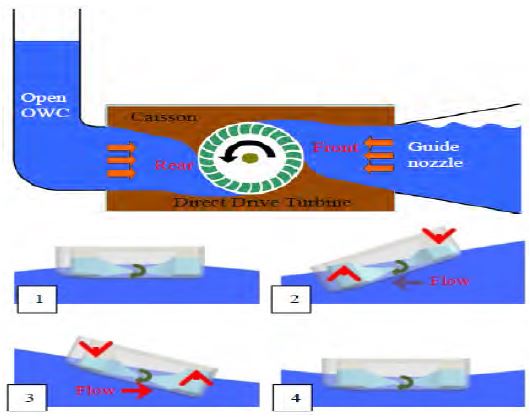
General model of a water energy converter: (1) balanced device in the case of maximum amplitude of a wave shape; (2) left tilt; (3) right tilt; (4) balanced device in the case of minimum amplitude of a wave shape.
Power generation is achieved through rotating an internal cross-flow turbine located between the two caissons. The pitching motion causes a column of water to shuttle between the two caissons, driving the turbine.
ANSYS AQWA is used to simulate and identify the motions of a deployed FWEC including pitch, roll, yaw, heave, sway, and surge. Information from the AQWA simulation is then fed into ANSYS Fluent computational fluid dynamics (CFD) software to evaluate internal fluid motion and turbine blade velocities and to characterize the effect of the pitching motion on the blade velocities.
Many scholarly articles have discussed using ANSYS Fluent to simulate the effects of water flow on blade motion. Key findings and techniques from these articles have been taken into consideration. In [2][3], the writers adopt the use of a dynamic mesh with ANSYS, which includes re-meshing and smoothing. The completed mesh model is then exported to ANSYS Fluent to conduct a CFD simulation. Coupling a user-defined function (UDF) with a 6-degreeof- freedom (6-DOF) constraint, ANSYS Fluent resolves the motion of the blade under the effects of a moving fluid. The UDF macro has been specially created to compile water flow parameters to calculate the blade rotational moment as its output. Finally, using the 6-DOF technique, ANSYS Fluent resolves the rotational angles and motion of the turbine blades.
However, the dynamic meshing used by researchers [2][3] has a very high computational cost. The requirement of using a smooth mesh with an infinitesimally small mesh size results in a very small time step. Additionally, previous results have not been promising; neither of these studies achieved a simulation involving a complete revolution. Björk [2] could only obtain a maximum rotational angle of 60°, while the blade rotational angle in study carried by Boqvist [3] was less than 550. The advantage of the sliding mesh technique is its shorter simulation time while simulating the blade’s rotational motion and its effects. The same UDF macro was built to calculate the rotational angle of the blades.
Land and Koh [4] used the same sliding mesh technique to simulate the rotational motion of blades. However, in this study, they are not assumed to have a fixed angular velocity. This difference in the underlying assumption affect the ability to obtain realistic results and to investigate the turbine flow with respect to the WEC pitching motion.
Various studies have been conducted for the development of this device with their results published. Choi et al. [5][6], Prasad et al. [7] and Faizal et al. [9] validated designs through CFD and experiments. Choi et al. [6] and Lee et al. [8] used numerical and experimental investigation to confirm the performance of a cross-flow turbine in a reciprocating flow and reported a turbine efficiency of 48.6%. Faizal et al. [9] conducted experiments on a 6-DOF ocean simulator with a prototype scale of 1:3 for no-load conditions and loaded conditions to investigate the efficiency of the PTO system.
2. Implementation Method
Agamloh et al. [12] used CFD to perform coupled fluid–structure interaction simulation of a wave energy device. In this study, the wave function, wind load, and current load are considered to judge the power of the device. In addition, significant research has been performed on the mooring lines of WEC, such as the work by Johanning et al. [10], that proposed a mooring line system that includes a three-cable catenary. Martinelli et al. [11] showed a model of a mooring line chosen based on the shape of the WEC device. The mooring line model was chosen to maximize the amplitude of pitch motion (rotation about the Y-axis) of the WEC from what was learned from experience in the field. Pitching is at its maximum amplitude when a device moves in accordance with wave motion.
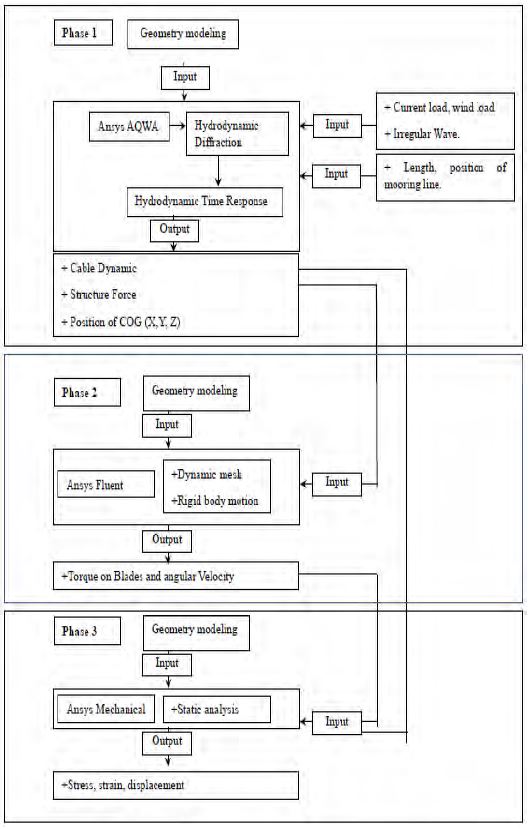
The objective of this study is to identify a CFD method to investigate the influence of the coupling between a wave energy device and its mooring system. In ANSYS Workbench, FSI (one-way and two-way coupling) analysis can be performed by connecting the coupling participants to a component system called system coupling. A participant system is a system that either supplies or receives data in a coupled analysis. Here, ANSYS Fluent (participant 1) and ANSYS Mechanical (participant 2) act as coupling participants. A depiction of the workflow of an FSI simulation using system coupling with coupling participants is shown in Figures 2 and 3. Initially, system coupling collects information from the participants to synchronize the entire simulation set-up, and then the information to be exchanged is given to the respective participants. The next step in the work process is organizing the sequence of information exchange. The solution part of the chart varies for different methods of coupling. Finally, the coupling convergence step is evaluated at end of every coupling iteration.
A one-way coupling follows the work instructions described in Figure 3. As it launches the first time step, Fluent iterates until convergence is attained and transfers the pre-requested information (fluid forces) to ANSYS Mechanical so that this solver begins the iteration process for the same time step to obtain converged nodal displacements. Next, the coupling service (system coupling) collects the convergence status from both the participants and launches the next time step. On the other hand, the two-way coupling has a more intrinsic solver facility that follows a more advanced work sequence. When any time step (coupling step) is launched, Fluent acquires a converged solution according to its own convergence criteria and transfers the fluid forces to ANSYS Mechanical. Then the displacement value of a structural member is obtained with help of the solution provided by Fluent for the same time step. Now a difference exists compared to the one-way coupling. The solution calculated by ANSYS Mechanical is sent back to the system coupling and ANSYS Fluent, including nodal displacements, to determine a new set of fluid forces according to the nodal displacements of the previous time step. This is said to be a coupling iteration and continues until the convergence criterion for data transfer is reached. In order to identify each step clearly, the process is divided into three simulation phases:
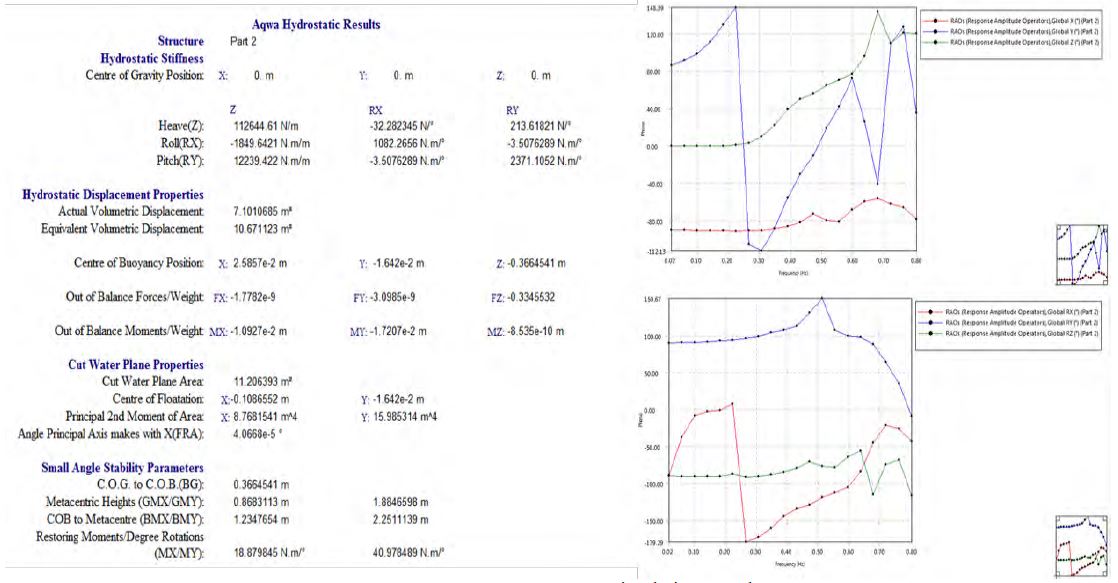
Phase 1: Hydrodynamic analysis of the FWEC is performed. The mooring configurations, wind, current, and irregular wave patterns are considered as the inputs for the ANSYS AQWA simulation to determine the response of amplitude (ROAs) for transitional and rotational directions by using hydrodynamic diffraction analysis. Additionally, utilizing hydrodynamic time response analysis, heave motion, surge motion, pitching speed of the FWEC, and the maximum and minimum cable forces on the FWEC are considered in this phase.
Phase 2: Fluid flow analysis using Fluent simulations is done in this phase. The results of the pitching angular velocity from the first phase are used as input data to determine the angular velocity of the FWEC turbine blades, maximum blade angular velocity, average imposed torque on the turbine blade, and average pressure on the blade. Additionally, the relationship between the blade angular velocity and the FWEC pitching motion is determined. For the Fluent simulation, the dynamic mesh is utilized to simulate the relative motion between the rotor and hull areas. Moreover, to consider the turbulence effects of the flow, a K-ε model is used.
Phase 3: Strength analysis for FWECs is an important part of the design process. In this phase, the static structural analysis of the FWEC is simulated. In the FWEC setup, components experiencing the highest stresses are the cable restrainer located at the body of the FWEC and the turbine blades. The maximum equivalent forces on the outer hull of the FWEC from the results of phase 1 are applied to the outer hull in a static simulation.
The best way to determine a floating device’s phenomena numerically is to solve the problem through fluid-structure flexible interaction (FSI). This way reveals the influence of internal fluid and the wave force on the outer hull and its strength, but requires a complex simulation whose solution requires substantial time. Additionally, supercomputers have been used to run the model simultaneously, i.e., both internal fluid motion force and external wave force. However, we have performed only one simulation and have captured results that show good potential for further improvement and implementation of this method to other floating device analyses.
3. ANSYS AQWA Equations
3.1 AQWA - Line
The equation of motion below can be used to determine the free floating RAOs of the structure [1]:
Where,
M(S) = mass matrix,
M(a) = added mass matrix,
C = linear damping matrix,
K(s) = total system stiffness matrix,
F = wave force on system (per unit wave amplitude), and
X = response amplitude operators.
When X = X0e−iwt and F = F0e−iwt , the solution of the equation of motion has the form
Where,
and H is the transfer function that relates input forces to output responses.
3.2 AQWA – FER
The effects of mooring lines on a body alter the external forces and stiffness matrix for the floating body and change the calculation of the equation of motion:
M(s) = mass matrix,
M(a) = hydrodynamic added mass matrix,
K(h) = hydrostatic stiffness matrix, and
F(t) = external harmonic forces on the structure.
The system damping C(s) and stiffness matrix K(s) are
C(s) = C(h) +C(w) and
K(s) = K(h) + K(m) + K(d) + K(a),
where
C(h) = hydrodynamic damping matrix
C(w) = damping due to wind = 0,
K(m) = stiffness due to mooring lines,
K(d) = hydrodynamic stiffness due to environmental effects (wind, waves, and currents), and
K(a) = stiffness due to articulations.
3.3 ANSYS FLUENT theory
From the characteristics of low pressure and turbulent flow, the k-epsilon model is used to describe the flow of fluid in internal devices. K-epsilon is a model with two equations to describe turbulence of flows. The first convective variable is turbulent kinetic energy k, which determines the energy in a turbulent flow, and the second convective variable is dissipative turbulence ϵ, which determines the scale of turbulence. The convection equations used to model the Kepsilon standard [13] are as follows:
Turbulent kinetic energy k
Dissipative turbulence ϵ
Viscous turbulence is modeled as follows:
where
S is the modulus of ratio average stress tensor:
The influence of push force is given by:
The Pradtl number is Prt = 0.85.
Thermal expansion coefficients are
4. Model and analysis
4.1 Model in ANSYS AQWA
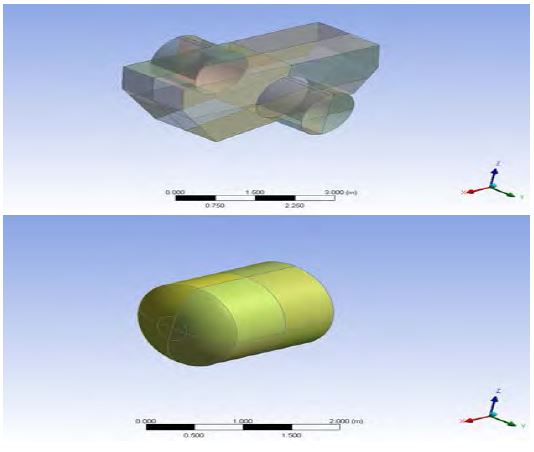
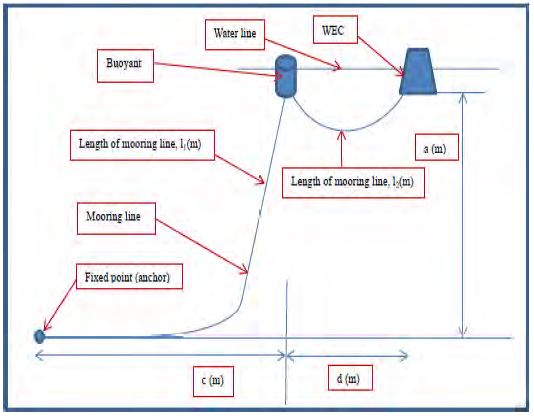
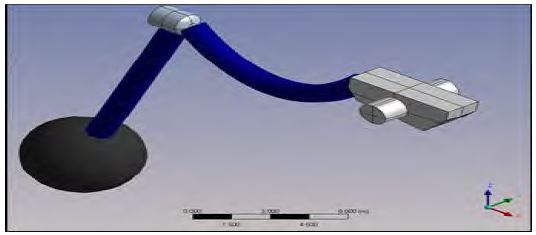
Figure 4 shows the geometry of the FWEC and buoy used in ANSYS AQWA. Figure 5 and Table 1 detail the schematic and dimensions of the mooring line used for station keeping with the FWEC device. This system is modeled in ANSYS AQWA as shown in Figure 6 and the naming convention for device motions corresponding to the coordinate system in ANSYS AQWA is listed in Table 3. WEC is modeled as a rigid body with six free DOFs for motion. To determine the best mooring line configuration, we solved many cases of mooring lines previously. In this research, we choose the most effective configuration used for sea trials to determine the relationship between pitch motion of a WEC and rotational speed of the device. Additionally, the model mooring configuration and parameters in Figure 5 are the same as in the sea trail.
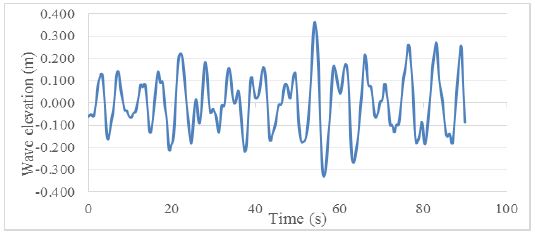
The load applied in ANSYS AQWA is shown in Table 2, which includes a wind load of 20 m/s and irregular Pierson- Moskowitz-generated waves with significant wave heights of 0.48 m and a wave period of 4.46 s as show in Figure 7. The Pierson-Moskowitz spectrum is a special case for a fully developed long-crested sea. The spectral ordinate at a given frequency (in rad/s) is given by:
| [22] |
where
Hs: significant wave height (m) and
TZ: average (mean zero-crossing) wave period(s).
4.2 Model in ANSYS FLUENT
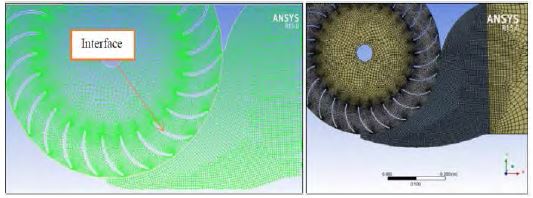
To save time and obtain the best results, the model was divided into multiple parts. The part near the blades and the part containing the blades must have fine-quality meshes and small elements for accurate flow visualization, as shown in Figure 8. In addition, the interfaces of the parts must have the same element sizes.
User-defined functions (UDF) are written as C-functions, which can be implemented dynamically into ANSYS FLUENT to enhance the standard features of the software. Source files containing UDFs can be either interpreted or compiled in ANSYS Fluent [14].
For interpreted UDFs, source files are interpreted and loaded directly at run time in a single-step process.
For compiled UDFs, the process involves two separate steps. A shared object code library is built and then loaded into ANSYS Fluent.
In this study, the sliding mesh technique is used to simulate the motion of the blades. Motion data for the device are imported from the results of ANSYS AQWA. ANSYS Fluent uses the data for the sliding mesh. The function DEFINE_ZONE_MOTION macro is defined in UDF. DEFINE_ZONE_MOTIONmacro specifies the cell zone motion components in a moving reference frame or moving mesh simulation. In the DEFINE_ZONE_MOTION macro, “For” loops are used to set the angular velocity (rad/s) dependent on time.
The DEFINE_ZONE_MOTION macro is used to describe the motion of the blades. The motion of the blades depends on the water pressure on the blades and ANSYS Fluent can export force and moment on the boundary zone. So we write the function in DEFINE_ZONE_MOTION macro to get force and moment and calculate torque on blades, area of blades by the code Lookup Thread (d, 10), where 10 is ID of area blade. By this way, we can take the angular velocity of blade against time. Angular velocity is calculated by multiplying the torque and moment of inertia of a blade. The velocity is used to update the node position in blade zone motion.
Being a closed domain, all solid surfaces interfacing with the fluid are treated as wall boundaries. This relates to the fact that fluid at the wall has the same velocity as the wall. For example, fluid on the surface of the turbine has the same velocity as the rotating blades, whereas fluid at the case surface has zero velocity.
4.3 Model in ANSYS Mechanical
Studies on the strength of FWEC structures have mainly focused on numerical work due to the complexity of the structures involved. It is important to note that, while experimental studies provide necessary physical insight, predictive tasks such as design, analysis, and evaluation of structures are often done by computational methods. Hence, numerical methods have advantages over experimental methods, especially in terms of studying stress distributions and fracture mechanisms.
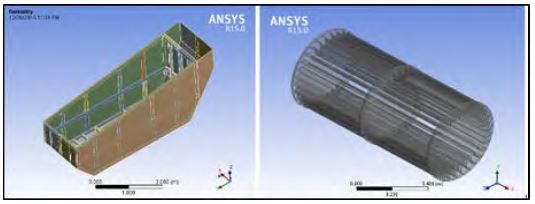
Figure 9 shows the static structural geometry of the hull and the blade. The geometry of the hull includes the shell of the box and a reinforced link for the shell. The parts of the device that do not affect the strength of the box are removed to reduce the computational time required.
The static structural mesh used is composed of tetrahedral elements with finer meshing where appropriate. The boundary conditions of the model used in static structural analysis include maximum pressure on blades taken from ANSYS Fluent, i.e., 2,700 Pa in the Z direction. This pressure is applied to the blades to check stress and deformation.
For the outer hull, the directional forces of cable connections taken from ANSYS AQWA are applied as follows: fx=69,002 N, fy= -61,221 N, and fz= -25,780 N.
5. Results
5.1 Result in ANSYS AQWA
AQWA can generate a time history of the simulated motions of floating structures arbitrarily connected by articulations or mooring lines under the action of wind, waves, and current forces. The positions and velocities of the structures are determined at each time step by integrating the accelerations due to these forces in the time domain using a two-stage predictor-corrector numerical integration scheme. This analysis is used to simulate the real-time motion of a floating body while operating in irregular waves.
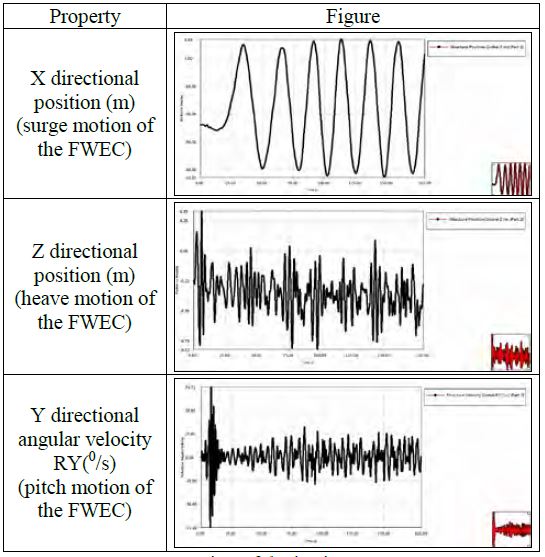
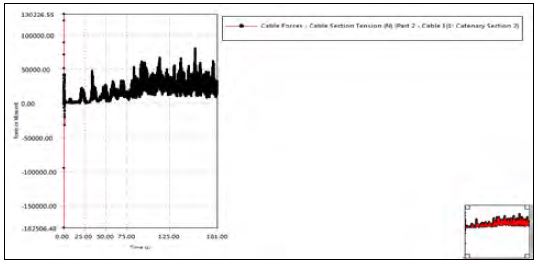
Figure 10(a) shows the resulting output of the simulation in ANSYS AQWA, which includes X direction position (m) (surge motion of the FWEC), Z directional position (m) (heave motion of the FWEC), and Y directional angular velocity RY (0/s) (pitch motion of the FWEC). Results from ANSYS AQWA include other parameters such as sway, yaw, and rotation motion as well as cable force (Figure 11) and structural stress. We discuss these results below.
Between 0 s to 25 s, the heave and pitch motions had large amplitudes, as seen in the enlarged Figure 10(b). After 25 s, the motions were slightly damped. Pitch motion (0/s) after 25 s had a maximum velocity of 27 (0/s) and a minimum velocity of -27 (0/s). Since the applied wave motion function is irregular, the resulting motion is not regular. To obtain an exact evaluation of the motion, results from ANSYS AQWA were considered from 130 s onwards. Input parameters of phase 2 and phase 3 were also used from 130 s onwards.
5.2 Result from ANSYS FLUENT
Results evaluated in ANSYS Fluent include the velocity distribution, pressure distribution inside the device, change of velocity at the blades over time, change of pressure on the blades over time, and torque values on the blades. A comparison is also made for the change in blade velocity with pitch motion and Y direction velocity of the devices.
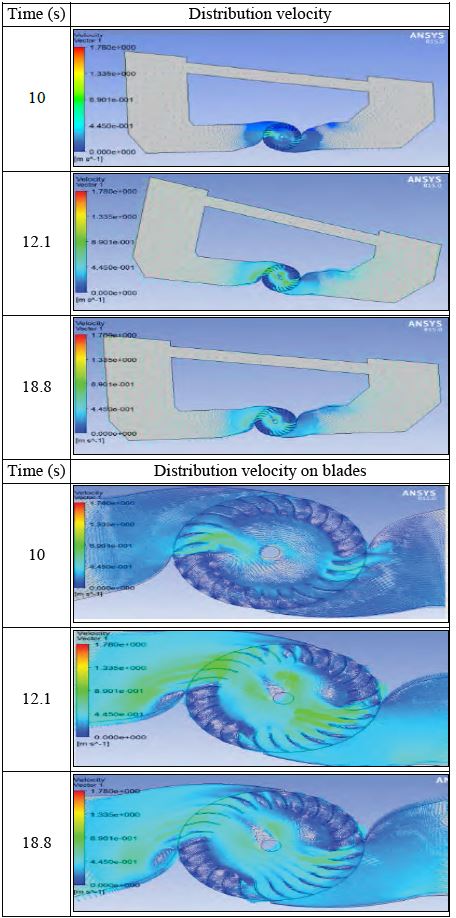
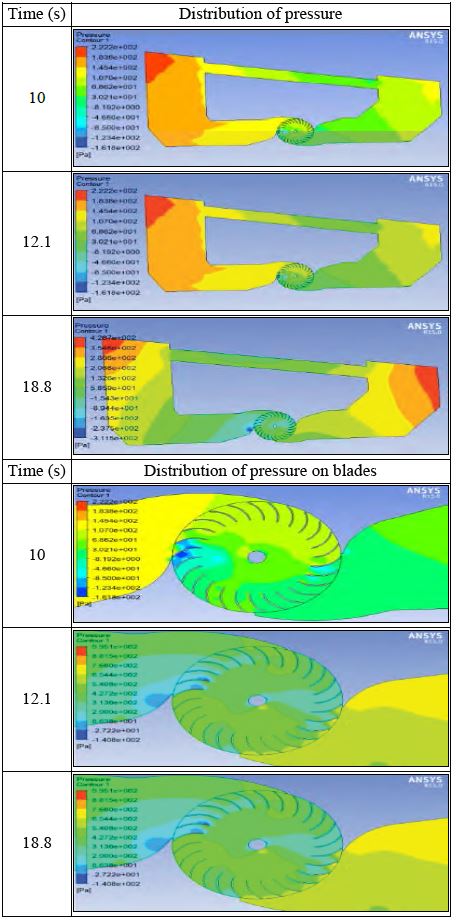
Figures 12 and 13 show velocity and pressure distributions of fluid in an internal device at three different times, 10 s, 12.1 s, and 18.8 s. General velocity distribution and pressure distribution show the general fluid flow and general pressure of the fluid. Velocity and pressure distributions on the blades show local distributions of fluid near the turbine blades. At 10 s, the device had a small rotational angle. The difference between water levels in the device is very small, and therefore water velocity through the blades was small. The maximum velocity observed was 1.78 m/s, which was concentrated at less important locations. At 12.1 s and 18.8 s, the difference between water levels in the device was larger, so the velocity of the fluid was larger and the velocity of 1.78 m/s appeared at many locations. The direction of water movement depends on the tilt angle of the device. The inversion of tilt angles leads to a change of direction for the moving water, as illustrated in Figures 12 and 13. In these figures, we observe the difference of tilt angles for the device at 12.1 s and 18.8 s; the direction of fluid motion was opposite at these times. Moreover, the distribution of fluid velocity also depends on the rotational velocity of the device, pitch motion, and rotational velocity of the blades. The effect on the velocity of water due to rotation of the blades is smaller than the effect on the velocity of the water due to rotation of the device.
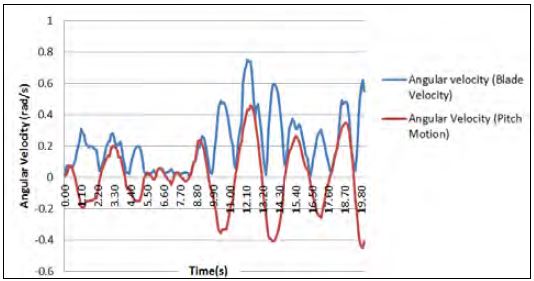
Figure 14 shows the relationship between pitch motion and blade velocity, linear-angular velocity (pitch motion). For the Y directional angular velocity RY (0/s) (pitch motion of the FWEC), the units of velocity (0/s) were changed into (rad/s) between 130–150 s. Angular velocity (pitch motion) has negative or positive values, and as the blade is rotated in one direction, it therefore has negative or positive values, as well. It can be seen that similar changes occur between velocity lines, and depends on blade velocity and angular velocity (pitch motion). The peaks (maximum velocity values) of pitch motion were the same as for peaks of blade velocity. This shows that the difference of phases between velocity lines is very small. A small difference in the phases means that the shapes of turbine blades, their moments, and materials (blade materials affect the inertial moments of the blades) are suitable for satisfying the design of the turbine.
Figure 14 also shows the difference between velocity values. At earlier time points, the difference between the two velocities was small. The difference was close to zero from 5.5–7 s; during 0–4.5 s, pitch motion had a velocity of (-0.2)–(-0.18) rad/s, and blade velocity was 0.2–0.3 rad/s. In this case, the difference during 0–4.5 s had a value of 0.1 rad/s. From 9.9–20 s, the maximum value of the difference was 0.1 rad/s during this period. The maximum approximate value of the difference in velocities was 0.3 rad/s at 12.2 s and at 12.2 s the blade velocity and pitch motion had maximum values. Therefore, when pitch motion has a large value, the blade is in a high position, and the difference between the two values is high.
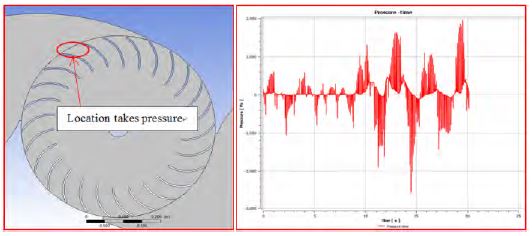
In Figure 15, the graph shows that the maximum pressure on the blade is 2,000 Pa and the minimum is approximately -2,800 Pa.
From results for velocity and pressure, the relationship between pitch motion and angular velocity is shown. This is useful in judging the power of a device. The sliding meshing technique used in ANSYS Fluent provides a pathway to improving the design of the system and its efficiency.
The water column velocity distribution and pressure distribution show general fluid flow and pressure; at the column for the velocity distribution on the blade, and distribution of pressure on the blade shows the local distribution of fluid at a location near turbine blade. In general, it is expected that, when the difference between water levels in the device is small, the effective water velocity and thus blade velocity are small, and when the water level difference is relatively larger, a higher fluid flow velocity results.
5.3 Pro-type Test Result
Table 4 results were obtained from a real sea test. The tabulated results are maximum peak values obtained instantaneously for peak efficiency. As observed from the torque graph in Figure 16, the nominal peak torque value is close to the obtained value. The torque sign changed from negative to positive approximately when the water stream hit the turbine blades. Factors that could lead to uncertainties include friction losses in the bearings and generator, which were not considered in the simulation. Limitations still exist in applying the problems in this study with realistic loading and examining how FWECs behave in various changing loading conditions. These aspects have an effect on the solutions obtained for the generated energy, which will be considered in future studies.
5.4 Result from ANSYS Mechanical
Static structural analysis was presented for the equivalent stress and deflection on the outer hull and deflection of the turbine blades of the modeled FWEC. The resultant structural forces and maximum torque were considered as input for static structural analysis of the outer hull and turbine blades of the FWEC.
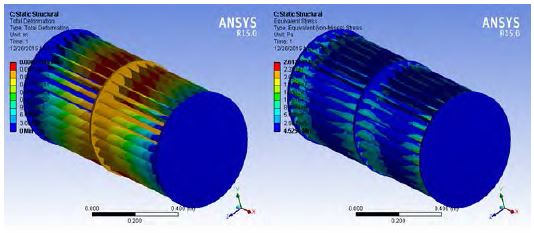
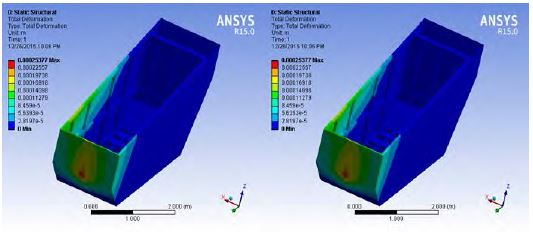
Figures 17 and 18 show the results of total deformation and stress distribution on the blades and outer hull. The maximum deformation value of the blades was 0.000276 mm. The position of maximum deformation was the middle of the blades. The maximum stress (von Mises stress) was 2.61220 MPa. The positions of maximum stresses were at the edges of the blades. The maximum stress ratio of the blades was 0.09 (<1), and hence the blades were safe under the effect of water pressure. In addition, the maximum stress and deformation, as expected, were located at the contact joint between the cable and the device. The stress ratio of the outer box was 0.432, which meant that the stress was within a safe margin. However, under the effects of severe wave conditions, stress values can be high and would be nearly equal to the strength of the hull, leading to potential damage. Consequently, the device is suitable to work in the following conditions: a wave height of 0.48 m and wave period of 4.8 s with a wind load of 20 m/s. The simulation results provided great insight into modifying and upgrading structural strength while maintaining device efficiency. Areas in need of further consideration to improve structural integrity are the mooring connection point, the blades, and stiffeners.
6. Conclusions
Good results were obtained for the response of the FWEC under the effects of wave height using ANSYS Workbench via the finite element method and the coupled field FSI. The structural static states of the main components of the device were calculated and judged in the ANSYS Static structural module, which gave helpful insights for future development.
This paper proposed a simulation method to evaluate the effectiveness of the device through combining ANSYS AQWA and ANSYS Fluent. The results obtained are in good agreement with the experimental results when the correct choice of cable parameters is considered.
The simulation showed very good results in terms of changes in blade rotation over time and the dependence of the blade speed on the rotational speed of the device. However, to obtain a clearer evaluation of the relationship between the two velocities, a longer time period is suggested.
This article only reviews one case of a mooring configuration. Future work will be performed using this method to optimize and improve FWEC mooring design and efficiency. Additionally, the interfacing procedure in this paper was applied to transfer information from the hydrodynamic and motion analysis of rigid floating bodies. The interface code can be extended to transfer pressure and body forces due to the elastic modes, as well. In this way, structural response analysis of flexible floating bodies with hydro-elasticity can be performed in the future.
References
- C. Smith, Dynamic Response of the SparACE, B.E.(Bachelor of Engineering) Thesis, Faculty Of Science, Engineering & Technology, The University of Tasmania, Australia, (2009).
- C. Björk, 3D-modeling of Swing Check Valve with Connection to Dynamic Behavior used in System Studies, M.S. Thesis, Department of Energy Sciences, Lund University, Sweden, (2015).
- E. Boqvist, Investigation of a Swing Check Valve using cfd,”, M.S. Thesis, Department of Mechanical Engineering, Linköping University, Sweden, (2013).
- G. L. Lane, and P. T. L. Koh, “CFD Simulation of a Rushton Turbine in a Baffled Tank,”, Inter Conf on CFD in Mineral & Metal Processing and Power Generation CSIRO 1997, p337-385, (1997).
-
Y. D. Choi, C. G. Kim, and Y. H. Lee, “Effect of wave conditions on the performance and internal flow of a direct drive turbine”, Journal of Mechanical Science and Technology, 23(6), p1693-1701, (2009).
[https://doi.org/10.1007/s12206-009-0414-4]

- Y. D. Choi, C. G. Kim, Y. T. Kim, J. I. Song, and Y. H. Lee, “A performance study on a direct drive hydro turbine for wave energy converter”, Journal of Mechanical Science and Technology, 24(11), p1-10, (2010).
-
D. Prasad, M. A. Zullah, M. R. Ahmed, and Y. H. Lee, “Effect of front guide nozzle shape on the flow characteristics in an augmentation channel of a direct drive turbine for wave power generation”, Science China: Technological Sciences, 53, p46-51, (2010).
[https://doi.org/10.1007/s11431-010-0020-9]

- Y. H. Lee, C. G. Kim, Y. D. Choi, I. S. Kim, and Y. C. Hwang, “Performance of a direct drive hydro turbine for wave power generation,”, IOP Conf. Series: Earth and Environmental Science 25th IAHR Symposium on Hydraulic Machinery and Systems, 12, (2010).
- M. Faizal, B. H. Kim, C. G. Kim, N. J. Lee, M. R. Ahmed, and Y. H. Lee, “Numerical and experimental studies on the PTO system of a novel floating wave energy convertor,”, Proceedings of the AFORE 2012, p248, (2012).
-
L. Johanning, G. H. Smith, and J Wolfram, “Mooring design approach for wave energy converters,”, Proceedings of the Institution of Mechanical Engineers, Part M: Journal of Engineering for the Maritime Environment, December 1, 220(4), p159-174, (2006).
[https://doi.org/10.1243/14750902jeme54]

- L. Martinelli, P. Ruol, and G. Cortellazzo, “On mooring design of wave energy converters: the seabreath application,”, Proceedings of the 33rd International Conference Coastal Engineering (ICCE), Santander, Spain, p1-12, (2012).
-
E. B. Agamloh, A. K. Wallace, A. von Jouanne, “Application of fluid–structure interaction simulation of an ocean wave energy extraction device”, Renewable Energy, 33(4), p748-757, (2008).
[https://doi.org/10.1016/j.renene.2007.04.010]

- J. D. Anderson, Computational Fluid Dynamics, The Basics with Applications, 1st, New York, McGraw- Hill, (1995).
- ANSYS, ANSYS Fluent UDF Manual, 275 Technology Drive Canonsburg, PA 15317.

