Study on velocity profiles around spiral baffle plates in a horizontal circular tube without inner tubes
Copyright © The Korean Society of Marine Engineering
This is an Open Access article distributed under the terms of the Creative Commons Attribution Non-Commercial License (http://creativecommons.org/licenses/by-nc/3.0), which permits unrestricted non-commercial use, distribution, and reproduction in any medium, provided the original work is properly cited.
Abstract
Usually shell and tube heat exchangers are employed to recover energy between fluids. Recently, numerous papers on these heat exchangers have been published; however, the velocity and temperature profiles or comparison of the features of the flow with or without inside tubes have rarely been described.
In this research, experimental and numerical studies were carried out to investigate the characteristics of the flow around the spiral baffle plates without inside tubes in a horizontal circular tube using a particle image velocimetry method and ANSYS 14.0~15.0 version (Fluent). The results showed that swirling flow was produced between the spiral baffle plates. The tangential components were strong between the two spiral baffles; however, the axial or radial velocities components were indicating nearly zero. From the spiral motion in the space of the two baffles, it is considered that there were no dead zones between the spiral baffle.
Keywords:
Spiral baffle plate, Particle image velocimetry, Swirling flow, Shell and tube heat exchanger1. Introduction
Heat exchangers have been widely employed in industrial applications. They are devices that enable the flow of thermal energy between two or more fluids at different temperatures.
As improving heat transfer at a heated surface, this method includes the techniques, such as a treated surface, rough surfaces, extended surfaces, a coiled tube, displaced-enhancement devices, vortex- generator devices, and additives to the fluids. In addition, a twisted tape or a spiral baffle plate is one of the main inserts that can improve the heat transfer rate.
Hasanpour et al. [1] reviewed twisted tape inserts in heat exchangers. Numerous works have emphasized on the increased heat transfer rate, decreased pressure drop, or minimized friction factor.
Halfdan Knudsen et al. [2] investigated a helical flow shell and tube heat exchanger using a designed pitot tube for Re = 7000 - 18000. A detailed analysis of the shell side flow distribution was performed using a three-dimensional (3D) finite-volume technique using porosity models. The 3D simulation code compared well with the experimental works, but did not satisfactorily predict the pressure drop. Young-Seok Son et al. [3] simulated a shell and tube heat exchanger with spiral baffle plates using a commercial thermal-fluid analysis code, CFX4.2. The results showed that spiral baffle plates induced vortices in the shell side flow field and enhanced heat transfer between the shell and tube side fluids.
A few studies have focused on the effect of baffles and flow patterns inside heat exchangers. Among these studies, that of Gupta et al. [4] performed the influence of a horizontally placed rod-type helical baffle using an X-ray technique. Van Dijk et al. [5] observed the physical behavior of dense fluidized beds using an X-ray technique and proposed that the velocity of the apex was not severely affected despite the clear effect of the baffle on the bubble dynamics.
Paisarn Naphon et al. [6] studied heat transfer enhancement and pressure drop in a horizontal tube with a twisted wire brush for Re = 6000 - 20000. The authors reached the conclusion that the twisted wire brush inserts had a significant effect on the enhancement of heat transfer; however, the pressure drops also increased.
As a study on the effect of the baffle, Elias et al. [7] investigated the effect of different particle shapes (e.g., cylinders, bricks, blades, and platelets) on the overall heat transfer coefficient, heat transfer rate, and entropy generation, of the shell and tube heat exchanger with different baffle angles and a segmented baffle. They found that the heat transfer rate for every nanoparticle shape was higher for 20 baffle angles. Xesus Nogueira et al. [8] conducted numerical and experimental studies on the oscillatory flow within a baffle tube that contained tri-orifice baffles using particle image velocimetry (PIV). Their findings showed that a numerical scheme was suitable for computation in complex flow situations. Chang et al. [9] recently conducted numerical and experimental studies to investigate the effect of baffles using the PIV technique with and without swirl. Their results showed that particles with swirl for the parallel flow have two more recirculations.
Recently, Azmi et al. [10] employed twisted tapes for heat transfer with TiO2 nanofluid in a horizontal circular copper tube. The authors found that the heat transfer coefficient was increased by 23.2 % of with an Re of 23917 at a 1.0 % volume concentration. However, they did not include the velocity of the nanofluid. Suresh et al. [11] utilized helical screw tape or rod type spiral plates to enhance heat transfer with Al2O3/water in a horizontal tube. They also did not mention the velocity of the nanofluid. When twisted tapes, spiral baffle plates, and helical tapes are used for heat exchangers, they changed the velocities profiles.
Until now, numerous studies have researched with and without nanofluids to improve heat transfer for a heat exchanger. Conversely, there are few studies that have described velocity profiles near the baffles. In this work, as a fundamental research for developing a shell and tube heat exchanger, the velocity profiles were studied, without the inner tubes at the entrance, between, and the outlet of the spiral baffle plates, in a horizontal circular tube using a 3D PIV technique and ANSYS software 14.0 ~ 15.0 version (Fluent).
2. Experimental works
2.1. Apparatus
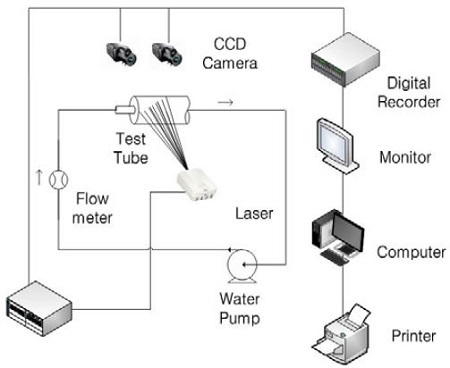
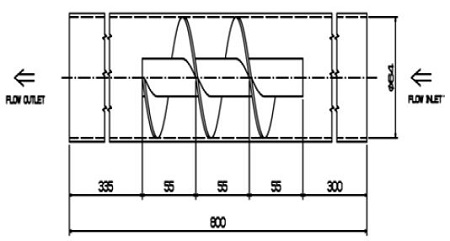
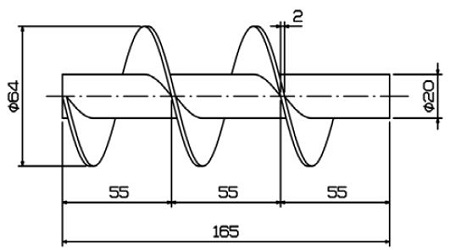
Figure 1 shows the layout of the experimental setup and stereo PIV system employed in this study. This system was equipped with two CCD cameras, a laser (2 W), and a water circulation pump. The reasonable Re was selected using the flow meter by operating the water circulating pump. The PIV system measured particles moving in the test tube. The experimental apparatus is indicated in Figure 2 with spiral baffle plates. The experimental testing tube was manufactured with an acrylic pipe (d = 64 mm, L = 800 mm, thickness = 3.0 mm) without the inner tubes. The spiral baffle, with a thickness of 2 mm, a diameter of 64 mm, and a length of 165 mm, was installed in the test tube. The spiral baffle was located at X = 300 mm from the entrance of the test tube. The detailed schematic diagram of the spiral baffle plate is shown in Figure 3.
The flow rate was measured using a flow meter installed at the inlet of the main tube. The measurement region was X, the horizontal direction of the tube, Y, the vertical direction, and Z, the out-of-plane direction. Given that the test tube was circular, the images captured by the two cameras were significantly distorted. Thus, a square box (700L × 100W × 180H) was installed outside the circular tube, and the empty space between the circular tube and the square box was filled with water to reduce the distorting effect. The experimental conditions are shown in Table 1.
2.2. PIV measurement
Two digital high-speed cameras (Basler 2.3 k × 1.7 k, 250 fps) with lenses (60 mm, MICRO NKKOP) were used for the stereoscopic measurements and were arranged as shown in Figure 1. The flow field was visualized with a continuous laser light sheet (thickness = 2 mm to 3 mm, Ar ion laser, 2 W). The two cameras were horizontally installed and maintained at 30° angles toward the measurement area. The seeding particles (nylon, ρ = 997 kg/m3, d = 100 μm) were suspended in the working fluid (water) for the PIV measurements and were added at the entrance of the main pipe (d = 64 mm, L = 800 mm).
2.3 PIV Calculations
To carry out 3D measurements with the two-camera system, camera calibration should be performed before main experiments.
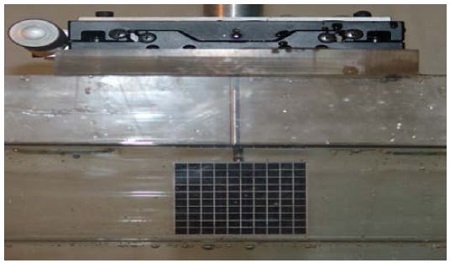
A test kit was manufactured using acryl materials for calibration, which had an identical size to the test tube with water. This kit is shown in Figure 4 with the transfer equipment. The calibrator was a flat plate (50 mm x 50 mm) on which grid lines were formed at regular intervals with 10 mm lines. This plate was traversed back and forth in the camera lens direction so that the grid images at six locations could be obtained. This plate was traversed inside the test tube in order to consider the refractive indexes of the working fluid (water) and the acrylic walls. To accomplish this, a cover on the circular cylinder tube was installed. During the main experiments, this cover was completely closed to prevent leakage of water. The calibration method and 3D measurement algorithms developed by Doh et al. (2004) [12] were used for the camera calibration and stereoscopic PIV measurements. The collinear equation, Equation (1) was used for 3D calculations. Here, cx and cy are the focal distances for the x and y components of the coordinate; Δx and Δy are the lens distortions; l refers to the distance between the origin O (0, 0, 0) and the principal point (X0, Y0, Z0) of the camera; (x, y) represents the photographical coordinate of the image centroid of the calibration targets; and (Xm, Ym, Zm) represents the point, P. The position of the calibrator when the photographical coordinate (camera coordinate) and the physical coordinate are set in a collinear line after rotation of the tilting angles, mx and my, corresponding to the point at which the normal vector from the origin, O (X0, Y0, Z0), of the camera coordinate meets with the X-Y plane. In Equation (1), there are 10 unknown parameters: six exterior parameters (l, mx, my) and four interior parameters (cx, cy, k1, k2) In order to calculate these 10 unknown parameters, the regression method by Doh et al., (2004) was adopted.
| (1) |
where,
Once all unknown camera parameters were calculated, the relationship between the photographic (camera coordinate) and the absolute coordinates (physical coordinate) of the target or particle image were expressed as shown in Equation (2). (X, Y, Z) represents the absolute coordinate of the target position, P, in the photographic coordinate. The matrix, MM, used for rotational transformation contains the 10 unknown parameters.
| (2) |
where,
If the camera center is set to vector (X0, Y0, Z0), the collinear equation for one object (or particle) can be expressed as P (X, Y, Z) = (a1 q + X0, a2 q + Y0, a3 q + Z0), where q is an arbitrary vector. Here, a1, a2, and a3 represent the corresponding terms that can be reconstructed from Equation (3). The cross-sectional points constructed from the following two collinear equations for the two cameras were defined as the 3D positions in the absolute coordinate.
| (3) |
In Equation (3), t and s were obtained by the least square method. Here, the coefficients (a11, a12, a13, b11, b12, and b13) represent the corresponding terms that can be reconstructed from Equation (2) for camera 1,(a21, a22, and a23) and camera 2 (b21, b22, and b23). The cross-sectional points do not always intersect at one point due to measurement uncertainties. Therefore, the center of the shortest distance between the two collinear equations was used as the final 3D position of the object, as defined in Equation (4).
| (4) |
where XA, YA, and ZA represent the absolute coordinates for camera A defined by Equation (3), and XB, YB, and ZB represent the absolute coordinates for camera B. After obtaining the positions of the vector two sets of the 2D vector terminals obtained by the same method used by Cho et al. [13], in which the gray level cross-correlation method was adopted but the Gaussian fitting method, was adopted to obtain the sub-pixel resolution. The interrogation size for the correlation calculation was set to 32 x 32 and the calculation grid was set to 42 x 21.
The measured velocity components U, V, and W were defined as the horizontal, vertical, and azimuthal components, respectively. The measured velocities were normalized with the time mean velocity calculated from the flow rate.
3. Results and discussion
3.1 Raw image of the particles between the two spiral baffles
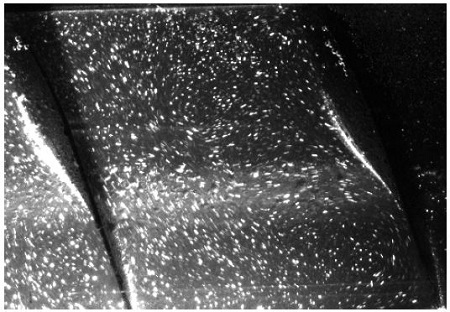
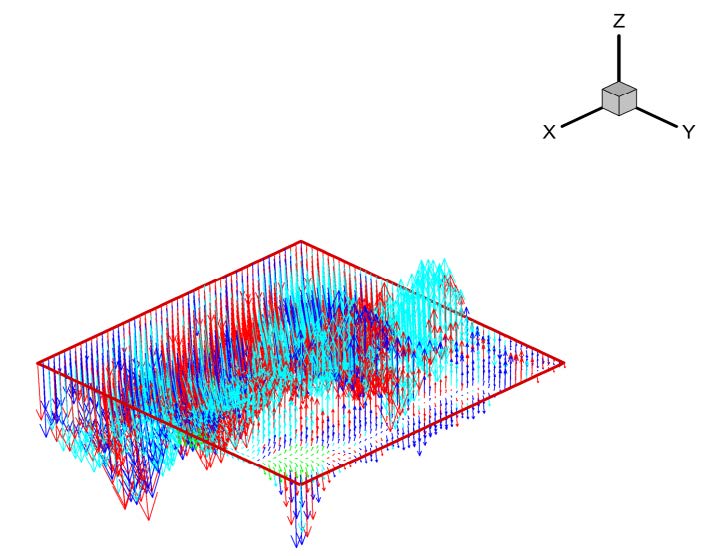
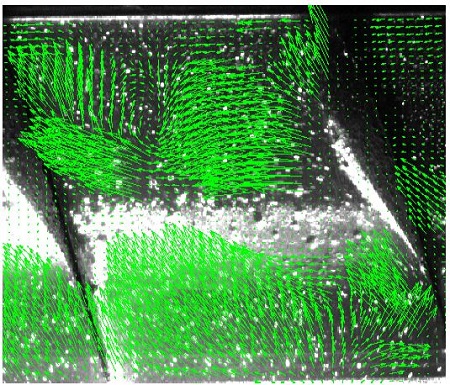
A PIV system was employed to measure the velocity profiles in the horizontal circular tube with spiral baffle plates at several locations, such as the entrance, between, and the outlet of the spiral baffle. Figure 5 shows the raw image of particles between two baffles (X = 355~410) for Re = 9850. It is clear that the particles were moving through the passage of the two baffles; some particles were recirculating behind the first baffle, and then moved to the next baffle. Figure 6 and 7 indicate the velocity vectors between the two baffles as calculated from the raw image in Figure 5. The velocity vectors were moved by some flow angles but other vectors were recirculating behind the first baffle or the upside of the passage.
These conditions are considered with the narrow passage or the flow angles by the spiral baffle plates. These results are similar to those of Yong-Gang Lei et al. [14]. The authors performed numerical simulations to study the impacts of various baffle inclination angles on fluid flow and heat transfer of heat exchangers with helical baffles. In particular, there were no dead zones between the spiral baffles; it is considered from the spiral motion in the space of the baffles.
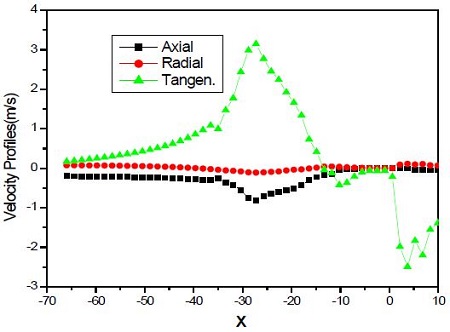
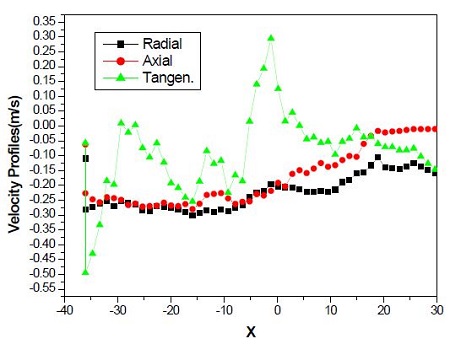
The local velocities were calculated from the velocity vectors from Figure 7 for the entrance of the baffle, between, and the outlet. Figure 8 presents the local velocity profiles to be calculated between the two spiral baffles. The tangential components were strong between the two baffles; however, the axial or radial velocities were indicating nearly zero. These things are regarded with producing swirling flow between the spiral baffle plates. However, the axial and radial components were nearly zero or a negative value, which usually show a strong intensity of swirl in a circular tube.
The tangential components were compared, at the entrance, between, and the outlet of the baffle, in Figure 10. The interesting results were that these tangential velocities at the entrance of the first baffle were strongly affected by the baffle, and the values were higher than those from between the baffles. This thing is supposed to be the friction between two baffles. However, these components were not much bigger than the other positions at the outlet and reduced with increasing X. This thing is supposed that the swirl intensity after the spiral baffle was gradually decreased along X locations.
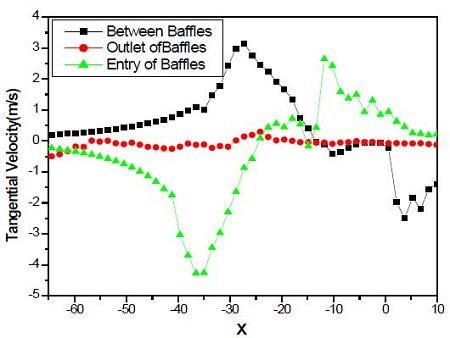
Variation of tangential velocity at the entry(X=230~300), between(X=355~410) and the outlet(X=465~535) of the spiral baffle plates for Re=9,850
From these results, the tangential velocities have higher values than the axial and radial values along the test tube. Therefore, the tangential components will be strongly affected in the inner tubes of the shell and tube heat exchanger.
In addition, it is possible to reduce the dead space between the two baffles like the vertical baffle, which will result in improved thermal efficiency.
4. Numerical works
Numerical simulations were performed to study the effects of the spiral baffle in the horizontal circular tube using ANSYS 14.0~15 version (Fluent). Three kinds of numerical models were employed for the numerical works: 15 pitch of the spiral baffle plates, 3.0 pitch, and 3.0 pitch of the twisted tapes, from the experimental model shown in Figure 3. To confirm the numerical models, the mass flow rates were used. Boundary conditions are included in Table 2. For this study, inlet boundary, outlet, turbulent intensity (10 %), and the room temperate were used.
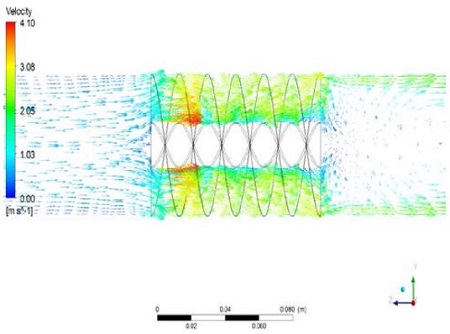
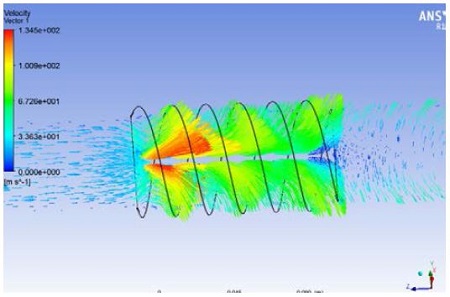
Figure 11 shows velocity vectors at the entry, between, and the outlet of the 3.0 pitch of the spiral baffles along the test tube for Re = 9850. The velocity vectors profiles show nearly uniform flow near the baffle; however, the profiles have a much higher value at the entrance of the baffle, and then indicated a strong magnitude of components between the baffles. They are concerned with producing the swirling flow between the baffles as shown in the experimental works. Nonetheless, these strong velocity vectors were reduced along the baffles. This was because these features were related to the friction on the baffles or the decreased swirl intensity.
Another interesting result was a negative recirculating zone at the outlet of the baffle along the test tube. However, this feature was smoothly reduced with the Z distance.
In addition, there were strong velocity vectors near the tube wall and negative vectors at the center of the test tube. These characteristics were considered to be caused by a decaying swirling flow after the spiral baffle plates.
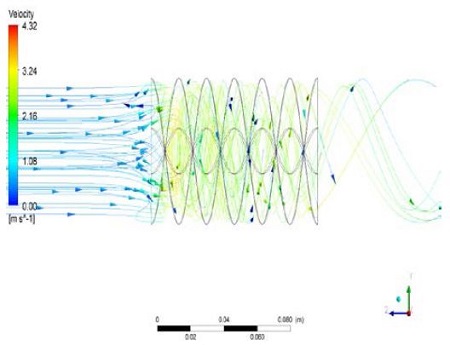
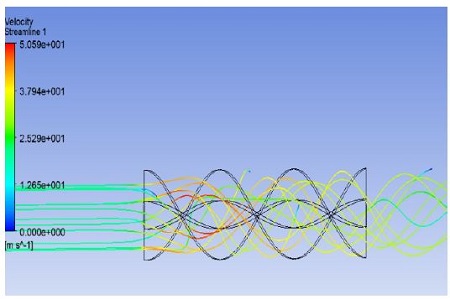
Figure 12 involves the streamline along the test tube with the 3.0 pitch of the spiral baffle for Re = 9850. At the entrance, the streamlines were nearly uniform; however, the profiles changed the helical shape path line between the baffles, and this result continued along the test tube.
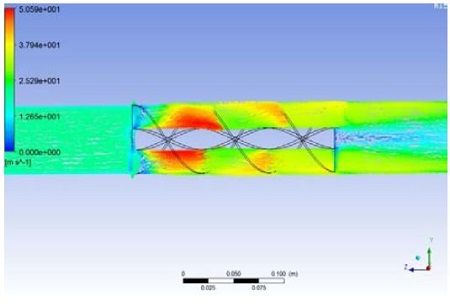
To determine the effect of the Re, Figure 13 presents the detailed velocity vector profiles along with the test tube using the 1.5 pitch of the spiral baffles for Re = 31800. At the entry of the baffle, it clearly showed the velocity vectors flowing into the baffle with some flowing angle, and then they produced stronger vector profiles between the baffles. This result was due to the production of strong swirling flow at the higher Re. In addition, they made the powerful recirculating zone with the swirling flow, and the flow was expanded at the outlet of the baffle; therefore, the swirl intensity was decreased along the test tube.
Figure 14 involves the streamline along the test tube with the 1.5 pitch of the spiral baffle. At the entrance, the streamlines were nearly parallel with the Z-axis, but these profiles changed the helical shape path line between the baffles. These results were continued along the test tube. These features come from the higher Re and shorter spiral baffles.
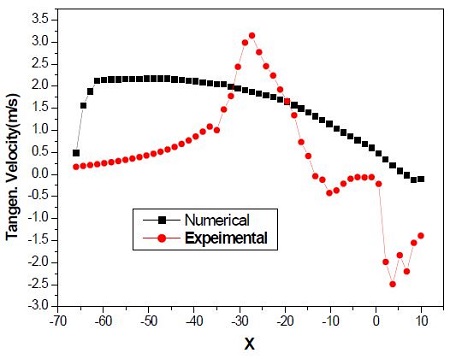
Velocity vectors with a 3.0 pitch of the twisted tape are shown in Figure 15. The strong velocity vectors were very similar to those of the spiral baffle, but the intensive recirculating zone was much different from that of the spiral. The rod (20 mm) of the spiral baffle is assumed to be affected on the recirculation zone. Comparisons of the experimental tangential velocity with that of the numerical analysis are shown in Figure 16. The tangential velocities were at Z = 355-410 for the n umerical work, but the experimental results were measured at X = 355-410. The two velocity profiles slightly disagreed with each other. It is considered to be the clearance between the spiral baffle plates and the test tube; therefore, there were some flow rates between the clearance. This affected the velocity profiles between the spiral baffle plates.
5. Conclusions
This study has been carried out to obtain information on velocity at the entrance, between, and the outlet of the spirue. ANSYS 14.0~15.0 version (Fluent) was employed for several numerical models, such as, 1.5 pitch of the spiral baffle plates, 3.0 pitch, and 3.0 pitch of the twisted tapes from the experimental model.
Through the experimental and numerical results, the following conclusions were drawn and are summarized below.
- 1. From the spiral motion in the space of the two baffles, it is considered that there were no dead zones between the spiral baffles. As expected, swirling flow was produced between the spiral baffle plates. The tangential components were strong between the two spiral baffles, but the axial or radial velocities components were indicating nearly zero.
- 2. Tangential velocities at the entrance of the first baffle were strongly affected by the baffle and these values were larger than those from between the baffles. This result is assumed to be due to the friction between the two baffles, or affected on the inner tubes in a shell and tube heater exchanger.
- 3. For the streamline along the test tube with the 3.0 pitch of the spiral baffle at the entrance, the streamlines appeared nearly uniform; however, the profiles changed the helical shape path line between the baffles, and these characteristics continued along the test tube.
- 4. The velocity vectors, with a 3.0 pitch of the twisted tape, showed that strong velocity vectors were very similar to those of the spiral baffle, but the intensive recirculation zone was much different from that of the spiral. It is supposed the rod (20 mm) of the spiral baffle to be affected on the recirculation zone.
- 5. The agreement between the experimental tangential velocity and the predicted results showed that the two velocity profiles slightly disagreed with each other. It is considered to be the clearance between the spiral baffle plates and the test tube wall. This affected the velocity profiles between the spiral baffle plates.
Acknowledgments
This research was supported by the ReSEAT program funded by the Ministry of Science, ICT and Future Planning through the National Research Foundation of Korea and the Korea Lottery Commission grants
References
-
A. Hasanpour, M. Fahadi, and K. Sedighi, “A review study on twisted tape inserts on turbulent flow heat exchangers: The overall enhancement ratio criteria”, International Communications in Heat and Mass Transfer, 55, p53-62, (2014).
[https://doi.org/10.1016/j.icheatmasstransfer.2014.04.008]

- H. Knudsen, A. Augtegard, E. Aaess, and O. K. Sonju, “Investigation of a novel helical flow shell and tube heat exchanger”, Heat Transfer 1998, Proceedings of 11th IHTC, vol.6, 1998, Kyongju, Korea, 55, p53-62, (2014).
- Y. S. Son, and J. Y. Shin, “Performance of a shell and tube heat exchanger”, KSME International Journal, 15(11), p1555-1562, (2001).
-
B. B. Gupta, J. A. Howell, D. Wu, and R. W. Field, “A helical baffle for cross-flow microfiltration”, Journal of Membrane Science, 102, p31-42, (1995).
[https://doi.org/10.1016/0376-7388(94)00241-P]

-
J. J. van Dijk, A. C. Hoffmann, D. Cheesman, and J. G. Yates, “The influence of horizontal internal baffles on the flow pattern in dense fluidized beds by X-ray investigation”, Power Technology, 98(3), p273-278, (1998).
[https://doi.org/10.1016/S0032-5910(98)00069-2]

-
P. Naphon, and T. Suchana, “Heat transfer enhancement and pressre drop of the horizontal concentric tube with twisted wires brush inserts”, International Communications in Heat and Mass Transfer, 38(2), p236-241, (2011).
[https://doi.org/10.1016/j.icheatmasstransfer.2010.11.018]

-
M. M. Elias, I. M. Shahrul, I. M. Mahbubul, R. Saidur, and N. A. Rahim, “Effect of different nanoparticle shapes on shell and tube heat exchanger using different baffle angles and operated with nanofluid”, International Journal of Heat and Mass Transfer, 70, p289-297, (2014).
[https://doi.org/10.1016/j.ijheatmasstransfer.2013.11.018]

-
X. Noguerira, B. J. Taylor, H. Gomez, I. Colominas, and M. R. Mackley, “Experimental and computational modeling of oscillatory flow within a baffled tube containing periodic-tri-orifice baffle geometries”, Computers and Chemical Engineering, 49, p1-17, (2013).
[https://doi.org/10.1016/j.compchemeng.2012.09.015]

-
T. H. Chang, H. S. Lee, K. J. Oh, D. H. Doh, and C. H. Lee, “Velocity profiles between two baffles in a horizontal circular tube”, Journal of Thermal Science, 23(6), p544-551, (2014).
[https://doi.org/10.1007/s11630-014-0739-0]

-
W. H. Azmi, K. V. Sharma, P. K. Sarma, R. Mamat, and S. Anuar, “Comparison of convective heat transfer coefficient and friction factor of TiO2 nanofuid flow in a tube with twisted tape inserts”, International Journal of Thermal Sciences, 81, p84-93, (2014).
[https://doi.org/10.1016/j.ijthermalsci.2014.03.002]

-
S. Suresh, K. P. Venkitaraj, and P. Selvakumar, “Comparative study on thermal performance of helical screw tape inserts in laminar flow using Al2O3/water and CuO/water nanofluids”, Superlattices and Microstructures, 49(6), p608-622, (2011).
[https://doi.org/10.1016/j.spmi.2011.03.012]

-
D. H. Doh, T. G. Hwang, and T. Saga, “3D-PTV measurements of the wake of a sphere”, Measurement Science and Technology, 15(6), p1059-1066, (2004).
[https://doi.org/10.1088/0957-0233/15/6/004]

-
G. R. Cho, M. Kawahashi, H. Hirahara, and M. Kitadume, “Application of stereoscopic particle image velocimetry to experimental analysis of flow through multiblade fan”, JSME International Journal Series B, 48(1), p25-33, (2005).
[https://doi.org/10.1299/jsmeb.48.25]

-
Y. G. Lei, Y. L. He, R. Li, and Y. F. Gao, , “Effects of baffle inclination angle on flow and heat transfer of a heat exchanger with helical baffles”, Chemical Engineering and Processing: Process Intensification, 47(12), p2336-2345, (2008).
[https://doi.org/10.1016/j.cep.2008.01.012]


