Corrosion behaviors of cement mortar specimens with different cover thickness in natural sea water
Copyright © The Korean Society of Marine Engineering
This is an Open Access article distributed under the terms of the Creative Commons Attribution Non-Commercial License (http://creativecommons.org/licenses/by-nc/3.0), which permits unrestricted non-commercial use, distribution, and reproduction in any medium, provided the original work is properly cited.
Abstract
This paper presents electrochemical corrosion behaviors of cement mortar specimens in the high salinity condition. Chloride ion is known as the most detrimental parameter to cause the corrosion in reinforced concrete. Increasing the concrete cover thickness is one of the corrosion protection methods against chloride ion; so, this study mainly focuses on the effects of mortar cover thickness on corrosion protection. In specimens, rebar, which was a height of 200 mm and a diameter of 10 mm, was installed at the center of the small size form. Later on, mortar was injected into the form, and 10, 20, 30, 40, and 50 mm of the different mortar cover thicknesses were selected. Potential measurements, linear polarization resistance tests, and cyclic potentiodynamic polarization tests were performed for specimens that were exposed to seawater. These results were compared with visual inspection results of rebar. The results show that an increase in the cover thickness contributes to corrosion protection. In addition, the result of electrochemical corrosion tests generally agreed with that of an autopsy visual inspection.
Keywords:
Corrosion, Cement, Mortar, Salinity, Polarization1. Introduction
Over the past few decades, most heavy structures, such as bridges and harbors, have been constructed using concrete because reinforced concrete structures exhibit both high strengths and long service lives [1]. In general, reinforced concrete is known as a strong corrosion-resistant material. The reinforcing bars (rebar) in concrete are protected from corrosion because a strong passive film prevents them from reacting with other corrosive substances [2].
However, serious deterioration due to corrosion can occur when reinforced concrete structures are exposed to harsh conditions [3]. Chloride ions and carbon dioxide are major causes of corrosion because they locally or completely destroy the passive film through chemical processes [4]-[6]. Chloride ions are an especially critical cause of corrosion in reinforced concrete. Once chloride ions penetrate into the concrete cover and reach the rebar surface, the passive film is destroyed by the production of hydrochloric acid through chemical reactions. Once the passive film is broken, the corrosion rate increases drastically [7]. Careful corrosion analysis is required, especially for marine bridges and port structures [8][9]. As these structures are located at the coast and subjected to repetitive wet and dry cycles, the reinforced concrete structures rapidly deteriorate because of the abundance of both oxygen and seawater, which contains chloride ions [10].
To prevent corrosion, chemical protection, such as coatings, and electrochemical protection, such as cathodic protection, can be useful [11] however, these solutions require monitoring and periodic repair. A good alternative solution is to increase the concrete cover thickness; this study primarily focuses on the effects of the concrete cover thickness on corrosion protection [12]. Experiments were performed on cement mortar specimens with different cover thicknesses to evaluate the protective effects. To evaluate the corrosion characteristics, electrochemical tests, such as potential measurements and potentiodynamic polarization techniques, were conducted. Following the electrochemical tests, the rebar in the concrete was separated from the cement mortar specimens and visually inspected to evaluate the degree of surface corrosion.
2. Experimental Method
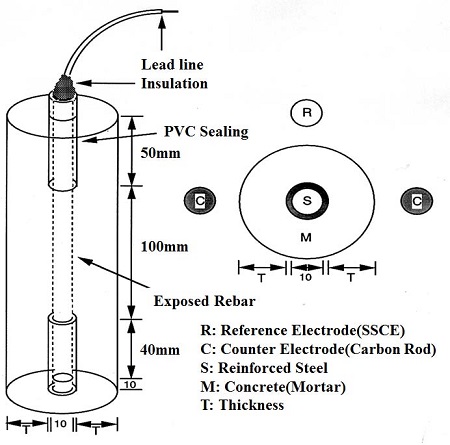
Figure 1 shows a schematic drawing of a cement mortar specimen. Ordinary round rebar (D10), which functioned as a working electrode, was positioned at the center of a small concrete specimen with a height of 200 mm and diameter of 10 mm. With the exception of the central area of the rebar (length of 100 mm), the specimen was sealed with polyethylene and silicon resin, which minimized the corrosion of the rebar due to the invasion of chloride ions from the top or bottom of the specimen. This meant that only chloride ions that entered from the side of the specimen could influence the corrosion behavior.
Following the positioning of the rebar, mortar was injected into the mold. Type 1 Portland cement (KSL 5201) was used. The cement mortar mixture had a fine aggregate: cement: water ratio of 2:1:0.45. Various cover thicknesses of 10, 20, 30, 40, and 50 mm were selected. Subsequently, curing was conducted by periodically pouring water over the specimen at the laboratory temperature of 25 °C. Following curing, a hole with a diameter of 1 mm and depth of 7 mm was drilled at the upper end of the rebar, and a copper cable was connected at this location for electrochemical testing. Moreover, the top and bottom of the specimen were sealed with epoxy to prevent chloride ion invasion via these sites.
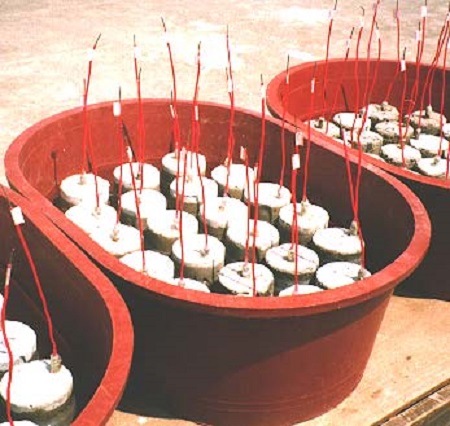
As shown in Figure 2, all the specimens were exposed to natural seawater at a depth of 15 mm. Subsequently, the tests commenced. The seawater was replaced periodically to ensure that the experimental conditions were similar to actual seawater conditions.
As a function of the degree of steel corrosion, the corrosion potential provides an indication of the risk of corrosion for the steel in the concrete, and it is linked by empirical comparisons to the probability of corrosion. The corrosion potential of the reinforcement in the mortar specimens was initially measured on alternating days until a stable potential was reached. Subsequently, it was measured every week. The potential measurements were initially performed on the specimen for a period of six years. A digital multimeter, Fluke 233 (Fluke Corporation), was used to measure the potential, and a saturated calomel electrode (SCE) was selected as the reference electrode for the potential measurements.
A linear polarization resistance test is usually used to obtain a rapid estimate of the corrosion rate of a rebar specimen without damage to the metal surface. From this analysis, the polarization resistance (Rp) is indicated by the slope of the potential (E)–current density (I) relationship at the corrosion potential (Ecorr). The corrosion current density (Icorr) can be calculated from the Rp through electrochemical equations. For the linear polarization resistance tests, potentiodynamic tests were also adopted with the following test conditions; scan range: ±30 mV vs Eoc, scan rate: 0.167 mV/sec (10 mV/min). For the linear polarization tests, a reference electrode, namely a silver/silver chloride electrode (SSCE), was installed at the polarization test cell. Using the test results, Tafel analyses were used to calculate the polarization resistance (Rp) and corrosion current density (Icorr).
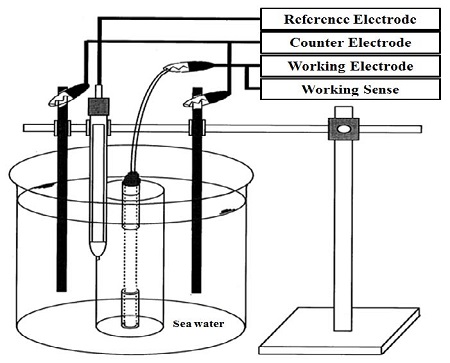
In addition, potentiodynamic polarization tests were performed to evaluate the relationship between the corrosion potential and current density, as well as the corrosion rate. These tests are also useful to qualitatively evaluate the passivation of a metal in a specific environment [13]. Figure 3 depicts a schematic drawing of the potentiodynamic polarization test. In this test cell, two counter electrodes, fabricated using carbon, were positioned at both sides of the specimen. A uniform current distribution could be obtained from the arrangement of the two counter electrodes. A commercial potentiostat, Reference 600 (Gamry Instruments), was used to conduct the potentiodynamic polarization tests, and an SSCE was utilized as the reference electrode.
Cyclic potentiodynamic polarization tests were performed to evaluate the corrosion characteristics and passivation state on the rebar surfaces. The corrosion potential, pitting potential, re-passivation potential, and corrosion current density were thoroughly investigated via the test. Silverman [14] states that the results of cyclic potentiodynamic polarization tests are highly related to the surface characteristics of a rebar. For example, the test results of a rebar surface with a passive film will differ to those that exhibit pitting or uniform corrosion.
Each rebar was removed from the cement mortar specimens after the experiments were performed. Subsequently, a visual inspection of each rebar was conducted, and the observations were compared with the results of the potential measurements, polarization resistance tests, and cyclic potentiodynamic polarization tests.
3. Experimental Results
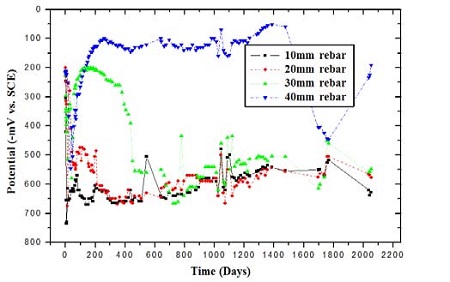
Figure 4 presents the variation in the potential of the specimens over a period of 6 years; an average value per month is presented to eliminate error factors. The results clearly show that the potential of each rebar differs depending on the cover thickness. Specifically, the specimen with the cover thickness of 40 mm has a greater potential, of approximately -100 mV/SCE, compared with the other specimens. The potential for the specimens with a cover thickness of 30 mm remains at -200 mV/SCE for a period of 400 days. However, the potential of the specimens with a cover thickness of 30 mm decreases to approximately -600 mV/SCE, and fluctuates frequently. In the case of the specimens with cover thicknesses of 10 and 20 mm, the corrosion potentials decrease over 100 days.
The polarization resistance (Rp) and corrosion current density (Icorr) results obtained from the linear polarization resistance tests are shown in Table 1. As the cover thickness of the specimens increased, the polarization resistance increased and corrosion current density decreased. In the case of the specimens with cover thicknesses of over 40 mm, the passive film on the rebar surface was maintained for 7 years. From these results, it is evident that the specimens with the cover thicknesses of 40 mm and 50 mm have superior corrosion resistance to the other specimens, and the passive film is maintained for the specimens with cover thicknesses of over 40 mm. In addition, these results demonstrate that it is important to select an appropriate cover thickness to prevent corrosion due to chloride ions.
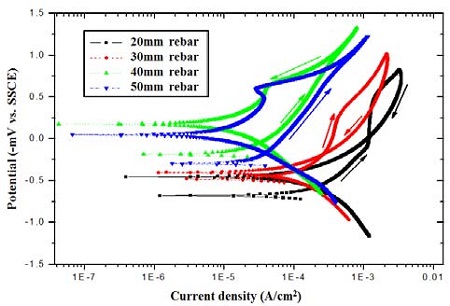
Figure 5 represents the results of the cyclic potentiodynamic polarization tests for the specimens with the various cover thicknesses of 20, 30, 40, and 50 mm. The corrosion current density of the specimen with the cover thickness of 40 mm is very low, less than 6 × 10⁻⁷ A/cm2. In addition, the specimen with the cover thickness of 40 mm shows passivity behavior since it not only demonstrates a positive hysteresis pattern, which shows a lower current density in the reverse scan compared with those of the forward scan during the potentiodynamic polarization tests, but also high repassivation potential values. From the results, it is evident that a strong passive film has formed on the rebar surface.
However, corrosion occurs in the case of the specimens with cover thicknesses of less than 40 mm. This is indicated by negative hysteresis behavior; higher current densities are obtained in the reverse scan compared with those of the forward scan during the potentiodynamic polarization tests. The corrosion current density of the specimen with the cover thickness of 20 mm is 5 × 10⁻⁴ A/cm2, which is the highest amongst all the specimens.
In addition, in the case of the specimen with a cover thickness of 20 mm, pitting corrosion occurred (negative hysteresis behavior). A lower pitting potential, as well as the highest pitting current density, was obtained for this specimen. It is assumed that the passive film on the rebar surface was primarily destroyed by the extremely high current density due to the penetration of chloride ions.
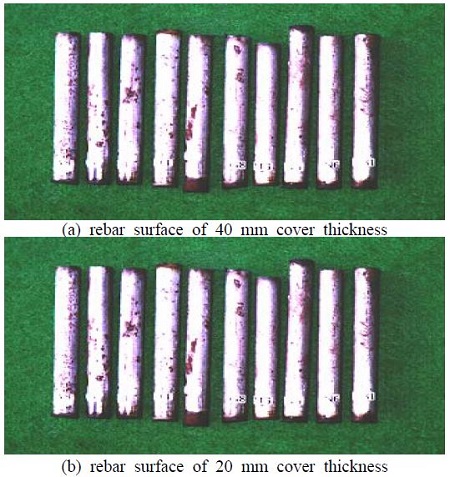
To measure the quantitative effects of the various cover thicknesses, the rebar was removed from the specimen, and a visual inspection was performed. As shown in Figure 6, the rebar specimens were classified according to the cover thickness. In general, all the specimens with a cover thickness of 40 mm show less traces of corrosion compared with those with a cover thickness of 20 mm. In the case of the specimens with a cover thickness of 40 mm, less than 10% of the surface area is corroded while in the case of the specimens with a cover thickness of 20 mm, more than 70% of the surface area shows traces of corrosion.
From the results, it is evident that the cover thickness is a major factor for the maintenance or restoration of the passive film on the concrete reinforcement, which functions as a protective layer against chloride ion invasion. Finally, it can be determined from the visual inspection that the trend associated with the corrosion generally correlates with the results obtained from the electrochemical tests.
4. Conclusion
From this study, the following conclusions can be drawn:
- 1. Potential measurements can be satisfactorily used to evaluate the degree of corrosion of reinforce concrete. In the case of the specimens with a cover thickness of less than 40 mm, the reinforcement exhibits severe corrosion.
- 2. From the potentiodynamic polarization tests, it can be determined that the specimens with cover thicknesses of less than 40 mm exhibit pitting corrosion. The rebar surfaces do not maintain a stable state, and the passive film of the rebar surface is destroyed by chloride ions. However, the passive film is maintained for the specimens with a cover thickness of 40 mm.
- 3. The observations made during the visual inspection of the rebar specimens also correlate with the results of the electrochemical tests.
- 4. Amongst various factors, the cover thickness is a major factor for the maintenance or restoration of the passive film on concrete reinforcement, and the trends are distinct, especially for the specimens with cover thicknesses of over 40 mm. From this experiment, it is evident that the presence of chloride ions seriously accelerates the corrosion of concrete reinforcement.
References
-
G. Blancoa, A. Bautistaa, and H. Takenoutib, “EIS study of passivation of austenitic and duplex stainless steels reinforcements in simulated pore solutions”, Cement and Concrete Composites, 28(3), p212-219, (2006).
[https://doi.org/10.1016/j.cemconcomp.2006.01.012]

-
S. Fajardoa, D. M. Bastidasa, M. Criadoa, M. Romerob, and J. M. Bastidasa, “Corrosion behaviour of a new low-nickel stainless steel in saturated calcium hydroxide solution”, Construction and Building Materials, 25(11), p4090-4096, (2011).
[https://doi.org/10.1016/j.conbuildmat.2011.04.056]

-
M. Saleem, M. Shameem, S. E. Hussain, and M. Maslehuddin, “Effect of moisture, chloride and sulphate contamination on the electrical resistivity of Portland cement concrete”, Construction and Building Materials, 10(3), p209-214, (1996).
[https://doi.org/10.1016/0950-0618(95)00078-X]

-
O. T. D. Rincóna, Y. H. Lópeza, A. D. V. Morenob, A. A. T. Acostab, F. Barriosa, P. Monteroa, P. O. Salinasb, and J. R. Monteroc, “Environmental influence on point anodes performance in reinforced concrete”, Construction and Building Materials, 22(4), p494-503, (2008).
[https://doi.org/10.1016/j.conbuildmat.2006.11.014]

- B. Sederholm, J. Almqvist, and S. Randström, Corrosion Properties of Stainless Steels as Reinforcement in Concrete in Swedish Outdoor Environment, NACE International Paper No. 09203, (2009).
-
L. Bertolini, and E. Redaelli, “Throwing power of cathodic prevention applied by means of sacrificial anodes to partially submerged marine reinforced concrete piles: Results of numerical simulations”, Corrosion Science, 51(9), p2218-2230, (2009).
[https://doi.org/10.1016/j.corsci.2009.06.012]

- F. Pruckner, Corrosion and Protection of Reinforcement in Concrete Measurement and Interpretation, A Thesis submitted for the Degree of Doctor at the University of Vienna, p31-32, (2001).
- M. Funahashi, and T. Young, Three year performance of aluminum alloy galvanic cathodic protection system, NACE International Paper No.99550, (1999).
-
S. J. Lee, M. S. Han, and S. J. Kim, “Improvement of Anti-Corrosion Characteristics for Light Metal in Surface Modification with Sulfuric Acid Solution Condition”, Journal of the Korean Society of Marine Engineering, 39, (2015).
[https://doi.org/10.5916/jkosme.2015.39.3.223]

-
J. A. Jeong, C. K. Jin, and J. U. Lee, “A study on the corrosion evaluation and lifetime prediction of fire extinguishing pipeline in residential buildings”, Journal of the Korean Society of Marine Engineering, 39, (2015).
[https://doi.org/10.5916/jkosme.2015.39.8.828]

- J. P. Broomfield, Corrosion of steel in concrete, Second ed, Taylor & Francis, London and New York, (2007).
- L. Bertolini, F. Bolzoni, P. Pedeferri, and T. Pastore, Three Year Tests on Cathodic Prevention of Reinforced Concrete Structures, NACE International Paper No. 97244, (1997).
-
T. S. Nguyen, S. Lorente, and M. Carcasses, “Effect of environment temperature on the chloride diffusion though CEM-I and CEM-V mortars: an experimental study”, Construction and Building Materials, 23, p795-803, (2009).
[https://doi.org/10.1016/j.conbuildmat.2008.03.004]

- D. C. Silverman, “Tutorial on cyclic potentiodynamic polarization technique”, Corrosion, 299, p1-21, (1998).

