Influence of guide vane shape on the performance and internal flow of a cross flow wind turbine
In order to make the vertical-axis cross flow wind turbine commercially feasible, a guide vane is adopted and the effect of the guide vane shape is examined in order to improve the wind turbine performance. CFD analysis on the performance and internal flow of the turbine is carried out for the wind turbine model. The result shows that when the guide nozzle is installed, almost over two times of power coefficient are achieved in comparison with the case of no guide nozzle installation. The guide nozzle acts as a role of suppressing the flow resistance at the blade passage, which is found when the guide nozzle is installed. Moreover, in this study, two kinds of the guide vane with a straight type and a curved type are adopted and compared. The curved guide vane nozzle produces higher power coefficient in comparison with that of straight guide vane nozzle.
Keywords:
Vertical axis cross flow wind turbine, Guide nozzle, Guide vane, Performance, Internal flow1. Introduction
Recently, the environmental problems such as global warming, pollution problems and so on have been considered as inevitable issue. Therefore, the necessity of the use of renewable energy as one of the clean and sustainable natural energy resources has become high[1].
As one of the renewable energy resources, the vertical axis wind turbines for the small scale urban usage are relatively less expensive as initial construction costs and maintenance costs are lower in comparison with those of the horizontal axis wind turbines[2].
Among the vertical axis wind turbines, a cross flow wind turbine has a high torque coefficient at a low tip speed ratio, good self starting characteristics, low noise, high stability and relatively very simple structure to manufacture[2].
However, the cross flow wind turbine has a demerit of relatively low maximum power coefficient as compared to that of other small wind turbines. Therefore, related researches on the use of a guide nozzle in a cross flow turbine to improve the turbine performance has been conducted[3]-[6].
In the present study, in order to improve the performance of a cross flow wind turbine more, guide nozzle with guide vane is suggested to enable uniform inlet flow conditions. The variation in performance and internal flow due to the change in the shape of the guide vane are examined by CFD analysis.
2. Cross Flow Wind Turbine Models and Numerical Methods
2.1 Wind Turbine Models and Guide Vane Shapes
In previous study[6], it has confirmed that cross flow wind turbine with guide nozzle shows considerably higher power coefficient in comparison with that of the turbine without guide nozzle. Moreover, there is an optimum shape of the guide nozzle to produce better performance.
Therefore, in this study, in order to improve the turbine performance more, guide vane is installed at the guide nozzle inlet to make the nozzle inlet flow uniform as well as to match the flow direction with the rotor blade angle. The guide nozzle shape is chosen from previous study results with relatively wide area of nozzle inlet by higher passage height[6].
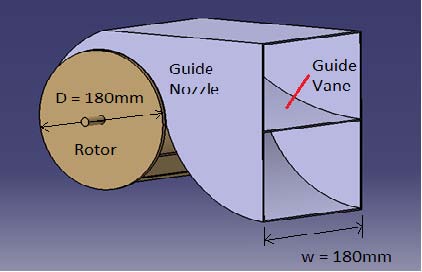
Figure 1 shows schematic view of the cross flow wind turbine model with guide nozzle and guide vane. The guide nozzle is attached to the inlet side of the rotor. The rotor has a 180mm diameter and 180mm width. Guide vane is installed at the middle location of passage height with the same passage width of the rotor width.
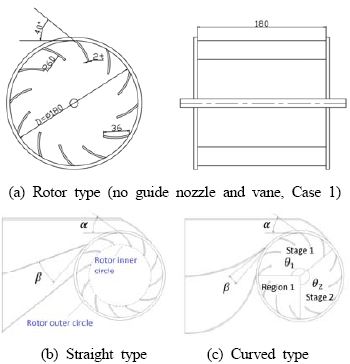
Figure 2 shows diagram of cross flow wind turbine models by rotor type (Case 1), straight guide vane type (Case 2) and curved guide vane type (Case 3), respectively.
The rotor of wind turbine model consists of 12 blades. Each blade has the same inlet angle of α=40°, blade curvature of 60mm and blade length of 36mm with 2mm thickness. However, guide vane angle β is different according to the guide vane shape of Cases 2 and 3. The local torque according to the relative position of the rotor blades on the guide nozzle is investigated and compared by separating the regions of Stage1, Stage 2 and Region 1.
Table 1 summarizes the structural shape definition of the wind turbine models by each case.
2.2 Numerical Methods
For the numerical analysis on the turbine performance and internal flow by the variation of the turbine guide vane shape, a commercial CFD code of ANSYS CFX[7] is adopted.
The grid element number of about 1.1x10⁶ for the whole flow field has been used. Fine tetra-hedral grids for guide nozzle, guide vane and rotor are employed to ensure relatively high accuracy of calculated results.
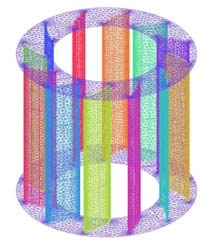
Figure 3 shows the tetra-hedral numerical mesh for the turbine rotor.
The non-dimensional wall distance(y+ value) for a wall bounded flow is also calculated for the rotor and guide nozzle sections. These values are listed in Table 2. The y+ value is kept in the range of y+ ≦ 6.2 in the whole flow field and the y+ value is within the generally acceptable range.
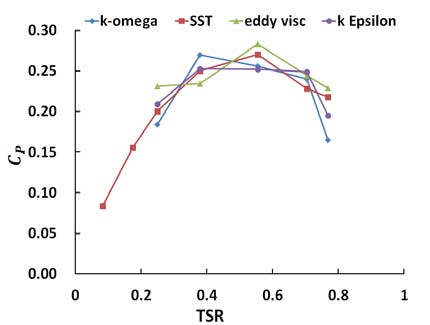
A suitable turbulence model is required for the complex flow phenomena that occurs on the blade surface and inlet nozzle. Therefore, the turbulence model dependence test is carried out by using four turbulence models: k-ω, Shear Stress Transport(SST), Eddy Viscosity Transport Equation and k-ε turbulence models. Out of the four models used, SST model shows relatively gradual change of Cp values by tip speed ratio. Therefore, SST turbulence model is adopted in this study and Figure 4 shows the results of the turbulence model dependence test using the wind turbine model of Case 3.
Table 3 shows the summarized numerical methods and boundary condition.
3. Results and Discussion
3.1 Performance Curve
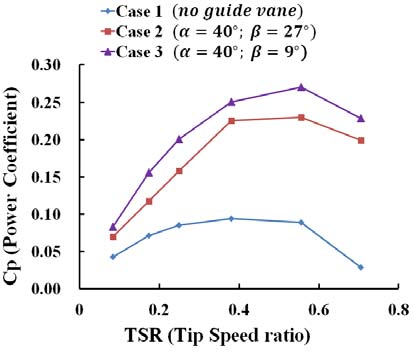
Power coefficient curves are plotted for all the cases that are carried out as shown in Figure 5. Case 1 with no nozzle shows the minimum power coefficient but Case 3 with curved guide vane consisting of guide vane angle of 𝛽= 9° and rotor blade angle of 𝛼= 40° shows the maximum power coefficient. It can also be noted that the introduction of guide nozzle changes the flow of the fluid so the maximum power of Case 3 is generated at 435min-1 (TSR: 0.55). While, without the nozzle, the maximum power of Case 1 is generated at 300min-1 (TSR: 0.38). Moreover, according to the variation of guide vane shape, the difference in power coefficient between the straight guide vane(Case 2) and curved one(Case 3) shows relatively large to about 3%.
In order to examine the influence factors for the performance variation of the wind turbine models, internal flow is investigated.
3.2 Velocity Vectors and Pressure Contours
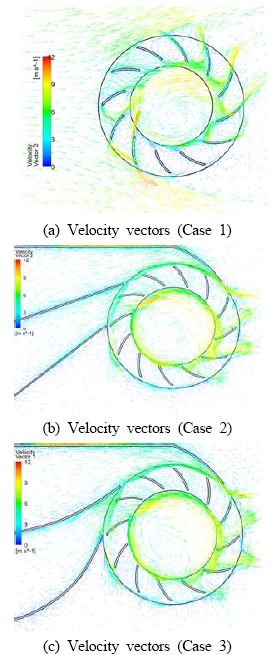
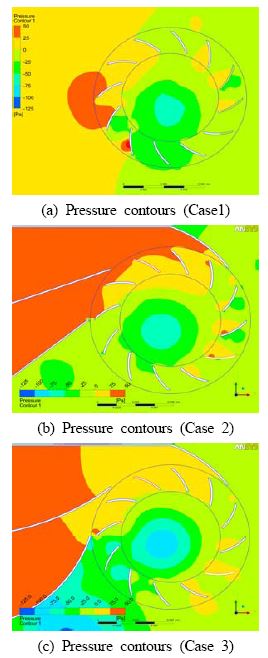
Figure 6 and 7 show the velocity vectors and pressure contours according to the turbine structure variation by Cases 1 to 3.
From Figure 6, it can be observed that uniform inflow at the Stage 1 area of rotor passes at the upper two blade passages in Case 1 but velocity vectors of Cases 2 and 3 show almost uniform inflow at the Stage 1.
The vectors show the change in fluid flow quite drastically between Cases 1 and 2. Cases 2 and 3 show similar fluid flow. It is conjectured that this change affects the turbine performance as seen by the power coefficient curve.
Figure 7 (a) shows pressure contours by Case 1. There exists a high pressure region on the pressure side of rotor blades at the leading position of the flow direction. The high pressure on the blade pressure side means the resistance to the rotation of the rotor.
In addition, Figure 7 (b) shows a fairly high pressure in the nozzle exit, which gradually decreases after entering to the rotor blades and evenly distributes out. Figure 7 (c), by Case 3, shows a similar trend of pressure contours to Case 2. However, pressure at the nozzle outlet and rotor inlet at the Stage 1 by Case 3 shows a slightly lower in comparison with that of Case 2.
3.3 Velocity and Pressure Distributions
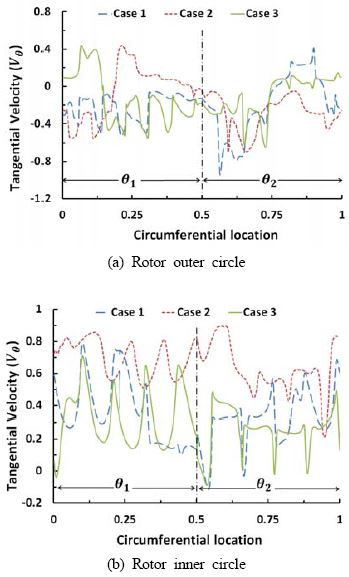
The size of the tangential velocity(vθ) in the blade flow passage is very important because it directly affects the angular momentum of the rotor and the output torque of the wind turbine. Therefore, tangential velocity at Stages 1 and 2 is investigated because, at the stages, principal output power is produced by absorbing the angular momentum of the blade passage flow.
Figure 8 shows the tangential velocity distributions on the inner and outer circumference of the rotor (refer to Figure 2 (b)). θ 1 and θ2 denotes Stages 1 and 2 as shown in Figure 2 (c), respectively. The tangential velocity distribution in the rotor outer circle shows that Cases 2 and 3 have higher velocity distribution in Stage 1 in comparison with that for Case 1. Tangential velocity distribution in the rotor inner circle shows almost higher values in the whole range for Case 2.
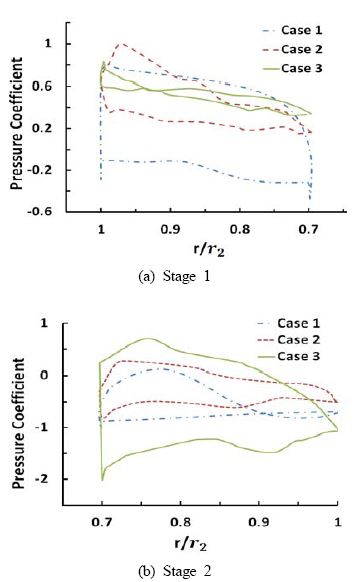
The average pressure distribution on the local blade surface (r/r2) at Stages 1 and 2 are shown in Figure 9. The area of the internal pressure coefficient represents the pressure difference between the suction side and pressure side of the blade surface. In Stage 1, it can be seen that the pressure difference in the upper and lower surfaces is quite small for Cases 2 and 3 with Case 3 at the minimum. However, in Stage 2, the pressure difference increases considerably for Case 3.
The pressure difference has a direct impact on the output power of the wind turbine. The difference is also due to the installation of the guide nozzle, which alters the fluid flow to the blades in Stage 1.
3.4 Averaged Local Torque on the Blade
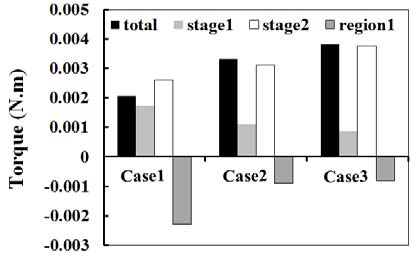
Figure 10 shows the averaged local torque on the blade at each stage by each cases. Stage 2 appears to have the highest torque in all cases and Region 1 is where loss of torque occurs to a large extent. Hence, the guide nozzle is installed to reduce the negative torque in the Region 1. Furthermore, once the nozzle is installed, uniform flow passing through the rotor passage increases as seen in Figures 6 (b) and (c). Hence, reducing the negative torque to a large extent.
The negative torque is greatly reduced in Cases 2 and 3 with the least negative torque in Case 3. The maximum positive torque is also achieved by Case 3. Hence, Case 3 shows maximum overall torque output.
4. Conclusion
It can be summed up that the performance of the turbine is directly dependent on the guide nozzle shape, the guide vane angle and the angular speed of the rotor blades.
The installation of guide nozzle almost doubles the power coefficient of the wind turbine and causes a change in the flow field with the highest value of power coefficient changed from the rotational speed of 300min-1 to 435min-1, that is, from tip speed ratio of 0.38 to 0.55. The difference of power coefficient between these two tip speed ratios is larger for the curved guide vane but almost constant with the straight guide vane.
Comparing the different guide vane angles it is noted that the curved one generates a slightly higher power coefficient than the straight one.
Acknowledgments
This paper was supported (in part) by Research Funds of Mokpo National University in 2010.
References
- B. Sorensen, Renewable Energy Conversion, Transmission and Storage, Elsevier, (2007).
- K. Seki, and I. Ushiyama, Vertical Axis Wind Turbine, Tokyo, Japan : Power Company Limited, (2008), (in Japanese).
-
J. Fukutomi, and T. Shigemitsu, “Study on performance and flow condition of a cross-flow wind turbine with a symmetrical casing”, Journal of Fluids Engineering, 133, (2011).
[https://doi.org/10.1115/1.4004023]

-
T. Shigemitsu, J. Fukutomi, and Y. Takeyama, “Study on performance improvement of cross-flow wind turbine with symmetrical casing”, Journal of Environment and Engineering, 4(3), p490-501, (2009).
[https://doi.org/10.1299/jee.4.490]

- M. Goto, H. Motohashi, S. Tan, and H. Kojima, “Experimental study on vertical axis wind turbine for inhabited region”, Proceedings of Japan Society of Mechanical Engineers Fluid Engineering Division Conference, 1304, (2001).
- S. W. Son, and Y. D. Choi, “CFD analysis on the cross-flow type wind turbine by guide nozzle shape”, Wind Energy Journal, 1(2), p24-29, (2010).
- ANSYS CFX Documentation, http://www.ansys.com Dec, 10), (2011.
