A study on northern sea route navigation using ship handling simulation

Copyright © The Korean Society of Marine Engineering
This is an Open Access article distributed under the terms of the Creative Commons Attribution Non-Commercial License (http://creativecommons.org/licenses/by-nc/3.0), which permits unrestricted non-commercial use, distribution, and reproduction in any medium, provided the original work is properly cited
Abstract
Recently, the viability of the Northern Sea Route has been receiving a remarkable amount of attention. Owing to global warming, glaciers in the Arctic Ocean have been melting rapidly, which has opened up navigation routes for ships with commercial as well as research purposes. At present, vessels can be economically operated along the Northern Sea Route four months of the year. However, studies have shown that the economical operating time may increase to six months by 2020 and year-round by 2030. Even though the conditions of the Northern Sea Route are extreme, the main reason for its use is that the route is shorter than the existing route using the Suez Canal, which provides an economic benefit. In addition, 25% of the world’s oil reserves and 30% of its natural gas are stored in the coastal areas of the East Siberian Arctic region. Many factors are leading to the expectation of commercial navigation using the Northern Sea Route in the near future. To satisfy future demand, the International Maritime Organization established the Polar Code in order to ensure navigation safety in polar waters; this is expected to enter into force on January 1, 2017. According to the code, a ship needs to reduce its speed and analyze the ice for safe operation before entering into it. It is necessary to enter an ice field at a right angle to break the ice safely and efficiently. This study examined the operation along the course for safe navigation of the passage under several conditions. The results will provide guidelines for traffic officers who will operate ships in the Arctic Ocean.
Keywords:
Arctic ocean, Northern sea route, Commercial navigation, Ship handling simulation, Safety navigation1. Introduction
Currently, the economical operating time of the Northern Sea Route (NSR) is around four months a year. This is expected to increase to six months by 2020 and year-round by 2030 owing to the rapid melting of glaciers caused by global warming. The NSR is the shipping lane connecting Murmansk to the west and the Bering Strait to the east along the Arctic coasts of Northern Russia [1]. Compared to existing routes through the Suez Canal and the Strait of Malacca, it is considered to reduce the total voyage time by around ten days. The Russian government has officially defined the NSR as the route from Novaya Zemlya Archipelago in the west to north of the Bering Strait in the east.
Countries bordering the Arctic Ocean have made it mandatory for ships operating in the Arctic Ocean to have ice navigators onboard. In the 44th session of the Sub-committee on Standards of Training and Watchkeeping (STW) of the International Maritime Organization (IMO) in 2013, the nations of Canada, Iceland, Norway, and the United States submitted documents STW 44/13 and STW 44/13/1 titled “Training Requirements for Officers and Crew on Board Ships Operating in Polar Waters” for consideration. The conclusion of the meeting was to include these requirements in the International Convention on Standards of Training, Certification and Watchkeeping for Seafarers (STCW Convention) and mandatory code. This was adopted in the 94th session of the Maritime Safety Committee, November 17–21, 2014 [2]-[4].
Vessels that operate in ice-covered waters can generally be divided into three categories: icebreakers, icebreaking cargo vessels, and ice-class ships. In general, navigation of the Arctic Ocean involves ice-class ships following behind an icebreaker that breaks the ice.
Up to the nominated point of convoy (NPC), however, ships need to voyage independently in order to receive the assistance of an icebreaker. Although such routes are not at high risk from thick ice sheets, navigation officers must accurately analyze the ice for the ship to safely arrive at the NPC.
While there are many references in the literature that introduce basic methods of ship operation in ice-covered waters, this study aimed to validate their efficiency by using a ship-handling simulator to ensure navigational safety.

Current route and NSR (source: www.google.co.kr)
2. Classification of ice
A navigation officer needs to possess a certain level of expertise on ice for safe operation of a ship on the NSR. The three criteria used to classify ice-covered waters are the concentration, thickness, and floe size [5]. Because this study was focused on simulations related to icebreaking, only the criterion of thickness was considered. Table 1 presents the classification of ice according to thickness.

Ice age (Thickness)
3. Safe navigation standards for the NSR
Ships operating in ice-covered waters must satisfy the standards for an appropriate ice class [6]. The ice class is a safety regulation for vessels that operate in icy waters such as the Arctic Ocean, the Baltic Sea, around Canada, and around Antarctica. Table 2 introduces the ice class rules of classification societies based on ice thickness. In general, merchant ships follow the Finnish–Swedish Rules [7].
Ice Class Rules (Ice Thickness)
Common cargo ships were used in this study. Table 3 describes their specifications, and Table 4 provides their operational capacity in a channel and broken ice.
Ship's Particular
RS (Russian Maritime Register of Shipping) ice class
4. Ship handling for safe navigation
4.1 Preparation and precaution for entering ice-covered waters
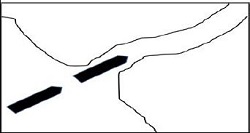
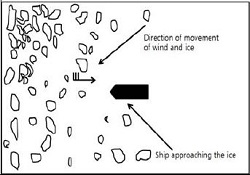
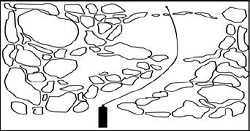
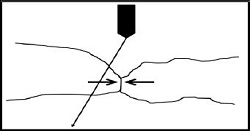
Ice class ships that pass through ice-covered waters must be guided by icebreakers. In other words, they must identify the location of the NPC and the sequence and form of the convoy. The draft of the ship must be maintained as trim by the stern in order to prevent propeller damage by ice. The ice chart should be secured to precisely analyze the form and concentration of the ice in the target waters. Table 5 summarizes items of precaution in terms of ship handling in ice-covered waters. In detail, when a ship is entering ice-covered waters, a perpendicular angle should be maintained at a reduced speed during the icebreaking. If the ship faces upwind, small ice fragments will detach to enable safe navigation. If the ship faces downwind, icebreaking is more challenging because the ice becomes concentrated. Above all, the golden rule of icebreaking is that taking an alternative route without ice is always more efficient than having to break ice even it means going a further distance. When a ship is operating towards upwind in open sea with a low concentration of ice, small ice fragments will move in the opposite direction, which increases the level of safety [8].
Ship-Handling in Ice
4.2 Simulation review
This study used the NTPRO 5000 Ship-Handling Simulator (ice navigation simulator), which was recently developed by Transas of Russia and certified as an ice navigation simulator by Det Norske Veritas (DNV) [9]. Its high level of reliability is corroborated by the fact that Russian shipmasters and navigation officers who have been or are operating in the Arctic Ocean use the same equipment to train domestic and overseas seafarers.
To handle a ship in ice-covered waters, the most critical stage is entering the ice. This study focused on this aspect for the validation. A higher ice class is capable of faster icebreaking and breaking thicker ice. Thus, the level of efficiency can be verified even without reviewing the entire range of ice class. LUI was used in this study; this is a ship that is capable of breaking ice with a thickness of 0.4 m at a maximum speed of 5 kts. Because the maximum icebreaking capacity is 5 kts, the range of speed was determined to be 4–5 kts. It is difficult for not only LUI but also most engine-powered ships to generate a speed of 3 kts or less. Ice thicknesses from 0.4 to 0.1 m were considered at decrements of 0.1 m. In addition, the dependency of the level of force and efficiency on the breaking angle was considered. Tables 6 –8 present the scenario and analysis results. In detail, Table 6 indicates the lateral and longitudinal forces on ice of a constant thickness (0.4 m) relative to the vessel speed. The maximum design capacity of LUI (i.e., speed of 5 kts for a thickness of 0.4 m) was used as the reference value to analyze the change in force. A feature of NTPRO 5000 was used to calculate the force. The results confirmed that decreasing the speed by 1 kts from the maximum to 4 kts caused the average lateral and longitudinal forces to decrease by 40.2%.
Force decrease rate according to the speed
Table 7 presents the lateral and longitudinal forces depending on the ice thickness at a constant speed. The maximum design capacity of LUI was again used as the reference. At a 0.3 m thickness (decrease of 0.1 m), the average level of force declined by 22.9%. At a 0.2 m thickness the average force dropped by 56.7%; at a 0.1 m thickness, the force dropped by 83.5%. In short, the level of force rapidly declined as the ice became thinner.
Force decrease rate according to the thickness
Table 8 presents the lateral and longitudinal forces relative to the approach angle starting from perpendicular in increments of 10°. The value are again based on the use of the maximum LUI capacity as the reference. The level of force was found to be larger at all other angles compared to the. The force was particularly large at an approach angle of 10° compared to at 20° or 30°. However, above an approach angle of 50°, the simulation showed that icebreaking becomes very challenging even with the capacity of LU1.
Force increase rate according to the broken angle
Table 9 presents the analysis results for speeds exceeding the maximum capacity of LUI. The speed was increased in increments of 1 kts from the maximum speed capacity up to 8 kts. The amount of force increased by 44.6% when the LUI was accelerated from its maximum speed of 5 kts to 6 kts. Increasing the speed to 7 kts increased the level of force by 213.9%, and increasing it to 8 kts increased the level of force by 405.2%.
Force increase rate according to the speed
Table 10 indicates the analysis results for ice thicknesses that surpassed the capacity of LUI. The ice thickness was increased in increments of 0.1 m from 0.5 m up to 0.7 m. At a thickness of 0.6 m, the amount of force rose by 257.4% compared to that used for the maximum icebreaking capacity of 0.5 m. However, the level of force increased by 714.4% at 0.7 m and by 797.6% at 0.8 m.
Force increase rate according to the speed
5. Conclusion
Because the NSR reduces the navigation distance and facilitates the transport of abundant underground resources around the Arctic Ocean, its usage is expected to increase in the future. This has escalated the need for a standard on safe navigation. The International Code of Safety for Ships Operating in Polar Waters (Polar Code) was established by the IMO for this purpose. This study analyzed ship handling from the perspective of safe navigation by officers with a simulator and developed the following conclusions:
- ① Icebreaking within the design capacity of the ice class is feasible, but the amount of force rises by more than 100% at an approach angle of more than 30°.
- ② At a speed of 7 kt, the level of icebreaking force increases sharply by more than 200% compared to the reference value at 5 kts.
- ③ When the ice thickness is increased 0.1 m above the design ice class capacity of 0.4 m, the amount of force rises by more than 250%. If the increase is more than 0.2 m, the force increases rapidly by 700%–800%.
In the future, additional studies should be carried out through simulations of various navigation scenarios regarding the entry of ice-covered waters, including the handling of a convoy or what to do when the ship is surrounded by ice.
References
- K. S. Choi, “Environment of the northern sea route and views of navigation”, Journal of the Society of Naval Architects of Korea, 47(3), p8-12, (2010), (in Korean).
- Korea Institute of Maritime and Fisheries Technology Report, “Final report of prepare to ice navigator training course”, p11, (2013), (in Korean).
- H. K. Kang, K. P. Kim, J. S. Kang, D. H. Kim, and T. B. Ha, “The rules and winterization technology on ships intended for cold climate operation”, Journal of the Korean Society of Marine Engineering, 35(6), p721-731, (2011), (in Korean).
- J. S. Kang, K. P. Kim, H. K. Kang, and D. H. Kim, “Prevention technologies of environmental contamination and IMO action in arctic ice-covered waters”, Proceeding of the Korean Society of Marine Engineers Conferenc, p237-239, (2011), (in Korean).
- Makarov Training Center, “Admiral makarov state maritime academy makarov training center ice navigation”, p195-197, (2014).
- Y. G. Kim, J. W. Oh, Y. C. Kim, and U. K. Kim, “A study on the propulsion shafting design of ice class vessel”, Proceeding of the Korean Society of Marine Engineers Conference, p183-183, (2012), (in Korean).
- Finnish Maritime Administration, “Finnish-swedish ice rules”, (2002).
- Seamanship International Ltd, “The ice navigation manual”, Chapter 3, (2010).
- Transas, Products & Solutions, http://www.transas.com/products/simulation/navigational-simulators/NTPROIce Accessed December 14, 2015.