Electrical system design in FLNG offshore unit
Copyright © The Korean Society of Marine Engineering
This is an Open Access article distributed under the terms of the Creative Commons Attribution Non-Commercial License (http://creativecommons.org/licenses/by-nc/3.0), which permits unrestricted non-commercial use, distribution, and reproduction in any medium, provided the original work is properly cited
Abstract
In recent years, Floating Liquefied Natural Gas (FLNG) Unit have attracted considerable attention. Generally, liquefied natural gas (LNG) units are produced in onshore liquefaction terminals from gas supplied from onshore gas fields or large-scale offshore gas fields near the coast. However, the development of these gas fields has approached saturation. Large-scale offshore gas fields far from the coast, as well as undeveloped medium- and small-scale offshore gas fields, have recently attracted attention. Among several proposed concepts, the floating LNG plant in the form of the FLNG system was chosen for further evaluation and development, considering worldwide receiving infrastructure. The design of a 2.5 million tonne per annum FLNG unit has been completed with a capacity corresponding to that of modern onshore liquefaction plants. Various simulation tests were performed to evaluate the performance of the electrical power plant, focusing on the efficiency of the electrical system to secure the aspects of plant safety. This design study analyzes the electrical system for the FLNG unit to improve the safety of operation and maintenance in the field.
Keywords:
Floating liquefied natural gas unit, Liquefied natural gas, Million tonne per annum1. Introduction
With growing global environmental concerns like CO2 emission reduction and treaty negotiations, the demand for liquid natural gas (LNG) is forecast to increase as a clean and lower-carbon energy source. However, the natural gas supply will be sufficiently limited to encourage natural gas exploitation in remote areas with harsh or hostile meteorological conditions. For the development of offshore gas fields, floating LNG terminals, referred to as FLNG (floating liquefied natural gas) units, are attractive options, because they save the expense of long undersea pipelines and long berthing pier construction, as the units are positioned above offshore gas fields in proper mooring systems.
The FLNG unit was first seriously discussed more than a decade ago, and was abandoned because of the absence of suitable tank technology. It developed as a LNG carrier with self-supporting prismatic-shaped IMO type B LNG tanks (SPB tanks) and Membrane Make III type.
Recent studies at Hyundai Heavy Industries Co., Ltd (HHI) have demonstrated that the FLNG unit using the SPB tank system is both technically and economically justifiable for future needs. A conceptual design with a capacity corresponding to that of most modern onshore liquefaction plants was completed. Simulation testing of various scales both vesseland plant-related matters has been conducted to confirm the influence of wave-excited motion in harsh conditions on the performance.
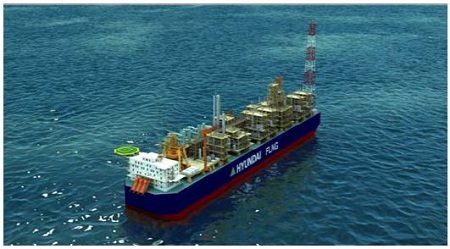
The study presents various aspects of FLNG features and the conceptual design of the 2.5 MTPA (million tonnes per annum) FLNG unit, which is a single-train plant with high availability by redundancy system and equipment. The unit has a compact layout similar to a gas turbine power plant [1][2].
LNG plant design tends to increase the train capacity as much as possible to take advantage of the economics of scale. Train capacities of more than 2.5 MTPA are typical for baseload plants. However, small-scale offshore gas fields can be developed using FLNG units with smaller capacities. A small-scale FLNG unit is commercially feasible. When condensate credit or incentives from producing or importing countries, such as low feed gas prices or low-interest-rate financing, is obtainable, the economics of the project improve further.
2. Plant Layout and Safety
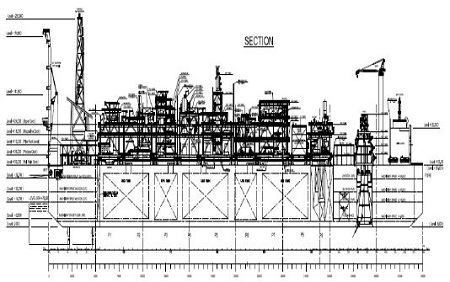
The processing equipment is installed on the upper deck to guard against spills and gas leakage accidents and to allow easy maintenance and servicing. The marine and utility equipment, such as sea water and fresh water pumps, is arranged in the hull machinery space. The clearance around each piece of equipment is chosen to meet the requirements stipulated in rules and regulations.
The height of the flare racks, which are used to burn the gas exhausted from the plant equipment and tanks under startup and shutdown conditions, for the safety of both plant operations and the process equipment, is determined to maintain a heat flux lower than the required thermal radiation levels. The aero-derivative PGT25+G4 gas turbine is adopted, considering the limiting constraints of the floating production storage and offloading (FPSO) units, and has the following features compared to gas turbines (GTs) commonly used in onshore plants.
- 1. High thermal efficiency, yielding less fuel gas consumption
- 2. Quick start and easy operation
- 3. Easy inspection and maintenance by a module exchange concept
- 4. Compact and light in weight
Safety measures for the FLNG unit are incorporated in addition to those required for ordinary onshore plants.
- 1. Spills of cryogenic liquids are guided to a safe area and treated safely. Compartments with gas appliances are isolated to ensure safety and are equipped with ventilators and gas detectors
- 2. The GTs are installed windward to permit isolation from gas sources at adequate distances. The flare stacks are installed on the side opposite that of the LNG carrier berth
- 3. Gas detectors and alarm systems are arranged in required areas, with considerations for the characteristics of leaking fluids, the possibility of leakages, and the importance of the affected equipment. Alarms are installed in the control room and in accommodation areas
- 4. Fire prevention and extinguishing facilities are planned similarly to those for onshore plants and marine facilities
- 5. The same emergency shutdown system is adopted as that used in onshore plants and ships
Some equipment cannot be operated stably because of the decreased performance under rough weather conditions. Receiving raw gas supplies must be suspended and the plant shifted to standby state in advance as the circumstances may require by the observation of meteorological information [1]-[4].
3. Methodology for Electrical System Studies
3.1 Method for the Short-Circuit Calculation
The short circuit levels were computed by DIgSILENT PowerFactory software, using the methodology prescribed in the IEC 61363 Standard, except for the calculation of the thermal equivalent current Ith, which is assessed by the IEC 60909 Standard [5]-[7].
3.2 Method for the Load-Flow Assessment
All load-flow calculations were performed using the completed Newton-Raphson method. The tolerances applied were 1 W, 1 kvar, or 0.1% of the power flow on each busbar.
The shunt parameter of the lines (capacitance) and of the transformers (no-load current and iron losses), where available, were fully considered by П or T equivalents.
The generators were the external grid, representing the external network, if any (not in this case, being an isolated system), could be set as PQ sources, PV sources, or slack busses. In this study, the external grid (Ghunan) was represented as slack bus, while the generators were set in PQ or PV mode. In some cases, the generators were grouped in station controllers that represented the effect of the secondary-level voltage controls. For each station controller, a controlled bus was defined and the corresponding required voltage was set; all generators included in that station controller contributed to the production of the reactive power needed to obtain the required voltage, according to pre-defined participation rules (i.e. proportionally to their rated MVA or Mvar).
The transformers tap changers, where applicable, were fully considered and their optimal position could be automatically computed.
The load-flow assessment allowed the collection of many results. In this study, the following characteristics were assessed.
- 1. For the nodes: the voltage results (kV, p.u. and phase and in degrees);
- 2. For the branches: active and reactive power, current at both sides, and the loading referred to the rated capability;
- 3. For the edge elements (generators, motors, load): the active and reactive power, the current, and loading referred to the rated capability.
3.3 Method for the Motor Starting and Transient Stability Simulations
Transient stability studies are performed by means of electro-mechanical transient simulations. This analysis is referred to as electro-mechanical or RMS since it uses the phasors of voltages and currents, rather than instantaneous values.
The electrical system, rotating machines, mechanical elements (turbines, motors, and mechanical loads), and the control systems such as generator automatic voltage regulator and the turbine governor were represented by a system of algebraic differential equations that, integrated in the time domain, yielded the time responses of these systems to possible perturbations.
The time step adopted for the integration of the system of equations was a variable step with a maximum of 10 ms.
The motor-starting studies were performed with the same methodology, representing the dynamics of the entire system rather than only that of the individual motors being started.
4. Short-Circuit Studies
4.1 System configuration and data assumptions
In these studies, the short-circuit levels were verified for the heaviest scenario, which corresponded to the required guaranteed production rate of 12.7 MM3/D and the offloading of LNG tanks located forward the unit (scenario named OFFLOADING FORE).
In this scenario, the total system load was ~48.8 MW, with 24.3 MW for direct on-line (DOL) motors, 18.4 MW for motors under variable-speed drivers (VSD), and a static load of 6.0 MW, which corresponded to ~35.7 MW of total DOL motor-related power (motors on duty only). The supply could be produced using two generators.
For the true DOL motors, the short-circuit contribution was considered to be 5 p.u. of the rated currents of the low-voltage (LV) systems, where the LV cables of each motor were not represented explicitly, and 5.5 p.u. of the rated current for the medium-voltage (MV) motor, where the MV cables of each motor were fully represented.
The 13.2 kV/6.9 kV transformers were 20 MVA forward and 15 MVA aft, with short-circuit impedance values of ~10%.
The system representation included all MV and main LV cables between the switchgears and the transformer and between the switchgears and the motors.
To estimate the maximum short-circuit level, the following conditions were applied, at safety advantage:.
- 1. The heaviest case of three main turbo generators operating in parallel was considered;.
- 2. At safety advantage, and following standard recommendations, a contribution of 3 p.u. of VSD motors was considered. This should be considered as an additional margin, since these systems should not contribute to the short-circuit level.
For this purpose, a DOL motor replaces each VSD load in the single-line graphics relevant to the short-circuit calculation.
- 3. All other loads in the system were increased by 10%, in order to account for the evolution of load requirements during detail design.
- 4. For each voltage system, the supply and distribution of the leads to the highest short-circuit level were considered: for the short circuit on the 13.2 kV system, the distribution towards the lowest-voltage levels was considered double-radial; for the 6.6 kV and LV systems, the distribution from the highest voltage levels was single-radial (13.2 kV in bus tie closed, 6.6 kV and 460 V levels in bus tie open configuration).
- 5. For the case exploring the maximum short-circuit level on the 6.6 kV and LV systems, the scenario with three TGs on duty plus the two diesel generator units (5 MVA each one) connected to the system was considered. These parallel operations could occur during start-up or safe.
- 6. The short-circuit was calculated as a solid fault according to the IEC 60909 Standard [5][6][8]-[11].
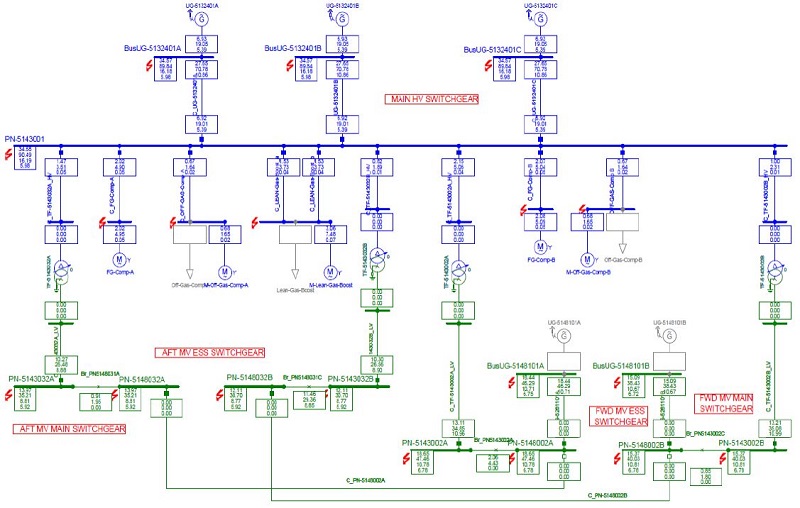
With these assumptions, the obtained short-circuit results have a sure and wide safety advantage as shown in Figure 3.
5. Load-Flow Studies
5.1 System configuration and data assumptions
The data assumptions were identical to those for the short-circuit calculation, with the following differences:
- 1. Two generators of three were set on-duty, in order to verify their capability;
- 2. The motors under VSD were represented as static loads and not as asynchronous machines.
The system was studied both in double-radial configuration (normal operation mode) and in single-radial on the LV systems, in order to verify that the size of all equipment was adequate.
In both configurations, the generators were set in PV mode, with a scheduled voltage of 1.015 p.u. and exact sharing (50% each) of both active and reactive power, assuming that the secondary voltage and power regulators were on duty.
In addition, the study was performed with unbalanced power on the A&B buses of the electrical system. This allowed the determination of maximum variations in conservative operation conditions.
Table 1 summarizes the minimum and maximum voltages in each voltage level and in each configuration [7]-[11].
6. Motor Starting Studies
Motor starting was verified for the largest motor, the FG-Compressor (13.2 kV, rated power 6,900 kW). It was assumed that, during starting, the mechanical load (the compressor) operated with closed valves and therefore absorbed a maximum of 60% of the motor’ rated power at full speed. The inertia of the motor to be started, including the shaft and mechanical load, was assumed to correspond to a Ta = 3 s.
The following case was considered: two turbine generators on duty and the same load scenario as in OFFLOADING FORE, with the unique difference that, in the initial conditions, the FG-Comp-A motor was not yet on duty [8]-[11].
6.1 Starting of the FG-Compressor with 2 TGs on duty
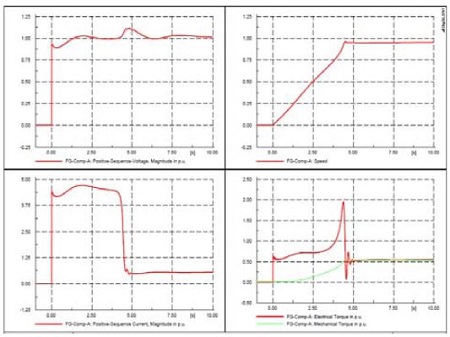
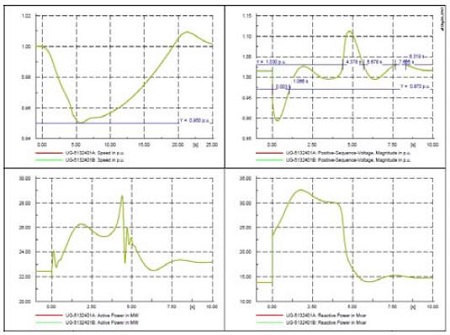
The results, in the form of plots vs. time, are shown in Figure 4 and 5.
Such configuration already considers conditions of downgraded operation; this is considered the worst possible generating condition.
The starting of the motor itself occurs in ~4.5 s.
For the system frequency (generators' speed), with the a m. selected parameter (maximum turbine gradient of 0.8 p.u./min), the lowest frequency peak is 0.95 p.u. (-5%) and the highest, at the completion of starting, is 1.009 p.u. (+0.9%); these values are between the steady-state limits.
For the voltage, at the motor insertion, the generator voltages have a lower peak of ~0.88 p.u. (-12%) and remain below 0.97 p.u. for ~1.2 s; notably, during starting, the motor requires between 30 and 35 Mvar from the generators (~17 Mvar from each), which causes a significant voltage drop, but the proposed AVR is adequate. After the starting is completed, the typical reaction occurs with a voltage peak of 1.11 p.u., with a violation of the upper limit of 1.03 for ~1.3 s, followed by a second, very slight violation lasting ~0.7 s.
The other motors register the transient under-voltage, accompanied by a speed reduction that keeps the ratio V/ within an acceptable range; these variations do not cause the motors to work outside of the stable region, so the absorbed current does not present strong variations. Since all motors must be re-accelerated, the turbine work is heavier than the work due to the motor starting itself.
7. Transient Stability Studies
One critical stability case is the unwanted tripping of one generator, with possible consequences of both active and reactive power requests from the remaining generators with the possible need for load shedding.
The following study analyzed various severe cases. In all cases in which load shedding was performed, it was assumed that the shedding was performed 250 ms after the initial event, where not specified otherwise [8]-[11].
7.1 Case 1: 2 TGs on duty, loss of 1 TG, loading shedding 100[%] Lean Gas Booster
In this case, the total load of the system, ~49 MW, could not be supplied by only one TG, since the turbine limit is 27.8 MW. A load shedding of ~ 21 MW was required.
The load shedding considered must not jeopardize the continuity of process operations or the safety of the unit. The following sequence was then considered as a basis:.
- 1. 4,700 kW load shedding by offloading pumps and secondary utilities
- 2. 4,200 kW from the second fuel gas compressor
- 3. 15,700 kW from the lean gas booster compressor-driven VSD by the opening of the VSD upstream circuit breakers within 350 ms.
In such a scenario, the load shedding of the lean gas booster would be performed by opening the VSD upstream circuit breakers in 350 ms (250 ms for load-shedding PLC initiation and 100 ms additional delay to enable the deactivation of the upstream front bridge).
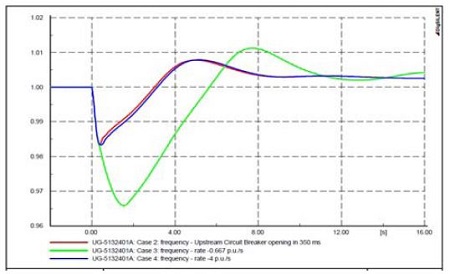
With such a sequence, the lowest speed peak was ~0.983 p.u., so the lower speed limit of -5% was not violated. The voltage lowest limit was 0.89 p.u. and the restoration time to recover within -3% was ~0.41s, lower than the prescribed 1.5 s limit.
7.2 Case 2: 2 TGs on duty, loss of 1 TG, loading shedding 100[%] Lean Gas Booster with mechanical regulation
The offloading Fore scenario was considered with a global absorbed power of 49 MW. The loading shedding sequence remained the same, with the exception that the lean gas booster compressor load shedding was performed by the mechanical regulation system and the overall power gradient of 0.667 p.u./min after the 250 ms load-shedding PLC delay, meaning that the power absorbed by the lean Gas Booster Compressor was considered to be 0 after 1.5 s.
With such a sequence, the lowest speed peak was ~0.9666 p.u., so the lower speed limit -5% was not violated. The voltage lowest limit was 0.89 p.u., and the restoration time to recover within -3% was ~0.76 s, lower than the prescribed 1.5 s limit.
7.3 Case 3: 2 TGs on duty, loss of 1 TG, loading shedding 100[%] Lean Gas Booster with VSD regulation
The offloading Fore scenario was considered with a global absorbed power of 49 MW.
The load-shedding sequence remained the same, with the exception that the lean gas booster compressor load shedding was performed by overruling the VSD speed command by the load-shedding PLC.
Considering the reversible and high-frequency electronic bridges in VSDs, the power electronics should be able to force very high frequency on the motor side to a much lower value than that of steady-state operation: In this way, the motors would temporarily function as generators transferring kinetic energy to the system through the VSD temporarily working with a reversed power flow. The operation would substantially aid the stability of the system, since heavy loads exceeding 20 MW would be very quickly transformed in the generators. This function would only be available for a short time, but sufficient to overcome the critical phase.
To maintain a conservative hypothesis, braking power recovery was not considered in the present simulation. In all cases, the response times of the VSDs were significantly faster than those of mechanical regulation.
Therefore, after the 250-ms delay of the load-shedding PLC, the power decrease of the lean gas booster compressor was considered null after another 250 ms elapsed (0.5 s since TG tripping). This regulation permitted the maintenance of frequency and voltage variations within acceptable ranges and minor mechanical impact on the lean gas booster compressor. This also allowed the lean gas booster compressor motor to remain energized for a quick ramp-up, once the frequency and voltage were recovered.
7. 4 Case 1-2-3 Comparison
The frequency responses among the three hypothesis are compared in Figure 6.
The different hypotheses allow the determination of the maximum range of frequency variations, independently of the VSD architecture and response time that are kept within the projected variation requirements. This equipment shall be considered a crucial advantage to minimize the impact on the electrical system and for the full control of compressor shutdowns and restarts, and therefore offers both advantages of the considered conventional load shedding hypotheses.the considered conventional load shedding hypotheses.
8. Conclusion
Considering the characteristics and margins of standard equipment in predicting future evolutions in design and demand for electrical power, the following calculations validated the general architecture of the FLNG unit.
- 1) The short-circuit study results confirm the adequate rating of the electrical switchgears and equipment selected on overall key one-line diagram for all operating conditions. The normal operating conditions with two turbine generators connected on a 13.2 kV switchboard are validated by the short-circuit studies of transient operations with the connection of the full main power generator set. These studies also include simulations of parallel operations of the essential generators within the main power generating set for start-up, normal shutdown, and routine test conditions as required in the black-start and operation philosophy.
- 2) The load flow studies confirm that the voltage limits are acceptable in different operating loaded conditions and distribution configurations, with the selection of adequate voltage regulation points on the 13.2 kV turbine generator and positions of the offload top changers of the distribution transformers. In such a conservative configuration, the final low-voltage nodes do not exceed ±.5%, ensuring that voltage variations will be maintained in normal operating conditions within the referenced standard requirements.
- 3) The motor starting study results demonstrate the possibility to start the largest DOL compressor on the 13.2 kV switchboard with two turbine generators on duty loaded in the maximum operating point, while maintaining voltage changes, frequency variations, and recovery times within the classification society requirements.
- 4) The transient stability studies were performed considering the failure of one main turbine generator. These studies are based on the possibility to maintain process production upon the de-energization of several secondary utilities and of the lean gas booster compressor as the main electrical consumer. The VSD associated with this motor can be designed and selected to optimize the stability of the overall electrical system, minimize the impact on the compressor, and ease the return to full-production operation.
This study was performed according to the latest information available. The results are highly dependent on the characteristics of the equipment, which are estimated and assumed at the front-end engineering design (FEED) stage. The final calculations shall be performed during the actual project execution or the detail-engineering stage, with guaranteed parameters of the selected equipment.
References
- K. Hanawa, M. Mori, Y. Mouda, and E. Aoki, “An experimental study of floating type LNG terminal”, LNG12 Conference, (1998).
- H. Miyakea, N. Kishimoto, and Y. Kakutani, “Small scale LNG FPSO for marginal gas fields”, LNG12 Conference, (1998).
- C. Pashalis, D. Matthews, and P. Andersen, “Liquefied gas production and export in the offshore environment”, ™ Gas Processors Association, European Chapter, (1993).
- H. Miyake, N. Kishimoto, M. Imafuku, M. Ohyama, Y. Saito, T. Ikebuchi, M. Nakamura, and K. Ueda, “Motions and mooring force of LNG FPSO in waves, wind and current”, Kawasaki Technical Review, (1997).
- IEC 60909, “Short-circuit currents in three-phase a.c. systems- Part 0: Calculation of currents”, (2001).
- IEC 61363, “Electrical installations of ships and mobile and fixed offshore units - Procedures for Calculating short-circuit currents in three-phase a.c”, (1998).
- IEC 60364, “Low-voltage electrical installations - Part 1:Fundamental principles, assessment of general characteristics, definitions”, (2005).
- Turan. Gően, and P. D. van der Puije, “Electrical Power Distribution System Engineering”, CRC Press, (2007).
-
O. I. Elgerd, and P. D. van der Puije, “Electrical power engineering”, ITP, (1998).
[https://doi.org/10.1007/978-1-4615-5997-9]

- ABS, “Floating production installations”, (2015).
- ABS, “Steel vessel rules”, (2015).

