Hydrodynamic performance of a pump-turbine model in the “S” characteristic region by CFD analysis
Copyright © The Korean Society of Marine Engineering
This is an Open Access article distributed under the terms of the Creative Commons Attribution Non-Commercial License (http://creativecommons.org/licenses/by-nc/3.0), which permits unrestricted non-commercial use, distribution, and reproduction in any medium, provided the original work is properly cited
Abstract
Specific hydrodynamic characteristic of pump-turbine during the start and load rejection process of generating mode causes anomalous increase of water pressure, along with large machine vibration, called "S" characteristic. The aim of this study is to understand and explain the hydrodynamic performance of pump-turbine at “S” characteristic region by using a model of pump-turbine system. The operation in the condition of runway and low discharge in a typical “S” characteristic curve may become unstable and complex flow appears at the passage of guide vane and impeller. Therefore, velocity and pressure distribution are investigated to give an all-sided explanation of the formation and phenomenon of this characteristic, with the assistance of velocity triangle analysis at the impeller inlet. From this study, the internal flow and pressure fluctuation at the normal, runway and low discharge points are explored, giving a deep description of hydrodynamic characteristic when the pump-turbine system operates with “S” characteristic.
Keywords:
Pump-turbine, “S” characteristic, Runway region, Instability, Internal flow1. Introduction
Reversible pump-turbines are widely used today owing to their ability to adjust the power production and consumption by fast switching at a reasonable cost. Therefore, increasing number of pumped storage plants are equipped with reversible pump-turbines for accommodating intermittent renewable generators in the power grid, and also for providing ancillary services as readily adjustable stand-by units and as running reserve for nuclear and other thermal generators. The specific hydrodynamic characteristic of a pump-turbine during the start and load rejection process in the generating mode causes an irregular increase in water pressure, along with large machine vibration, called “S” characteristic. The aim of this study is to understand and explain the hydrodynamic performance of pump-turbine in the “S” characteristic region using a numerical three-dimensional model of the pump-turbine system.
Researchers have paid a lot of attention in exploring how to improve the stability during the transition from one operation mode to another. Pejovic [1] presented a brief description of the “S” instability that occurs in each operation mode. Klemm [2] reported the implementation of the misaligned guide vanes (MGV) concept in a pump-turbine system, in order to achieve an improvement in the stability in no-load and extreme part-load conditions. In other studies, the experimental data provided by Yin[3] and Wang [4] showed that an impeller with a broader meridional section had a stable “S” characteristic curve and satisfied the requirements for safe operation in a pumped storage plant. In addition, Olimstad [5] indicated that larger blade angles and thicker inlet profiles influence the ”S” characteristic, which becomes steeper.
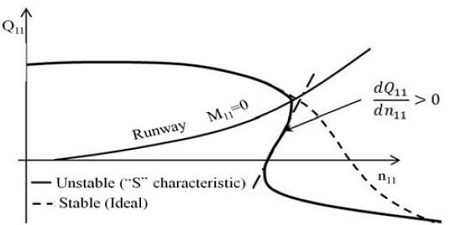
Studies have been conducted by Chen et al. on the same pump-turbine model for analysis on 3D inverse design, internal flow, cavitation and structural analysis [6]-[9]. This study specifically focused on the “S” characteristic curve. The operation in runway and low discharge conditions in a typical “S” characteristic curve may become unstable, and complex flow appears in the passage of the guide vanes and impeller, as seen in Figure 1. Therefore, velocity and pressure distribution are investigated to give an all-sided explanation of this characteristic and its formation, using velocity triangle analysis at the impeller inlet. The hydrodynamic performance in the “S” characteristic region is very important for this study, because it helps in giving a good understanding of the unstable operation that contributes to structural vibrations and noise, thus providing the engineer or designer with information required for finding solutions. The unit discharge and unit speed are given by Equation (1) and (2), respectively. In the equations, Q is the discharge, H is the net head, D is the impeller diameter, and n is the rotational speed.
| (1) |
| (2) |
2. Pump-turbine model and Numerical methods
2.1 Pump-turbine model
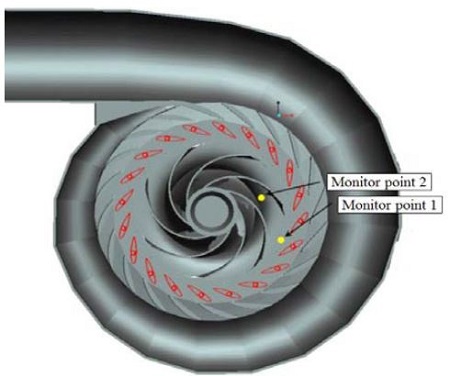
The pump-turbine model is illustrated in Figure 2, which also includes two monitor points that were studied in detail for pressure fluctuations in various operating conditions. As presented in Table 1, there are 7 impeller blades, 19 stay vanes and 20 guide vanes for this model. The rated power of the pump-turbine is 100 kW with a flow rate of 0.336 m3/s, 32 m head, and rotational speed of 1200 min-1. The pump-turbine model is the same as that used in the previous studies [6]-[9]. The design of impeller has been discussed in detail by Chen et al [6].
2.2 Numerical methods
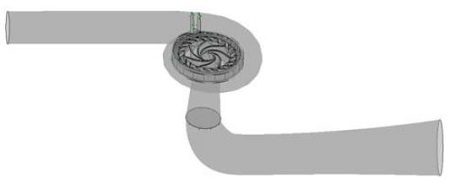
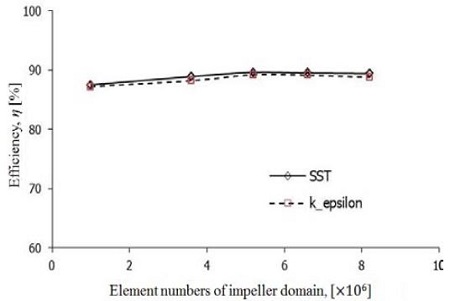
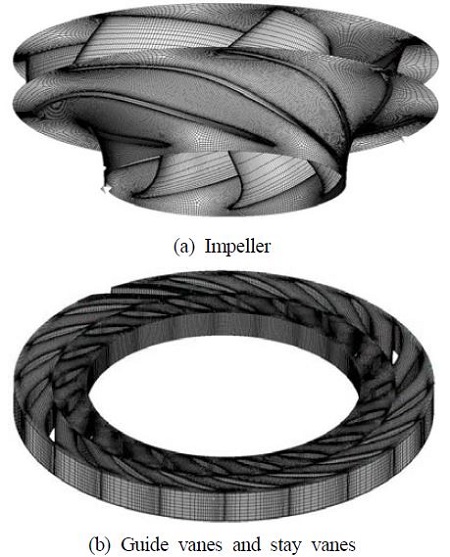
A numerical method similar to the one used in a previous work has been used in this study[6]-[8]. Table 2 presents the numerical methods and boundary conditions for the hydrodynamic performance analysis, and Figure 3 shows the full fluid domain of the pump-turbine model for numerical analysis. The pressure boundary conditions at the inlet and outlet are used to maintain the design head, whereas the flow rate is controlled by the guide vane opening; this value is obtained from the calculated result. Figure 4 presents the validation test results of the numerical method by comparing different mesh element numbers and turbulence models. The SST turbulence model is selected for all calculations in this study, because it is generally used for rotating applications like pumps and turbines, and shows relatively better convergence in contrast to the other models.
3. Results and Discussion
3.1 “S” Characteristic curves
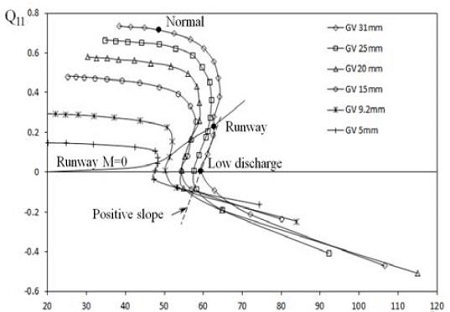
Figure 6 presents the “S” characteristic curves of the pump-turbine in the n11-Q11 coordinate system at guide vane openings of 5∼31 mm in the turbine mode. The “S” characteristic curve exhibits a positive slope around the runway region. When a pump-turbine prototype is brought to such a situation, the operation suddenly switches to the reverse pumping mode, and the discharges are reversed with a substantial increase in vibrations, driven by flow instabilities. In this pump-turbine, the runway point appears at the unit discharge values of 0.231, 0.207, 0.167, 0.166, 0.0757, and 0.0427 m3/s, corresponding to the guide vane openings of 31, 25, 20, 15, 9.2, and 5 mm, respectively.
3.2 Pressure fluctuation (GV 31mm)
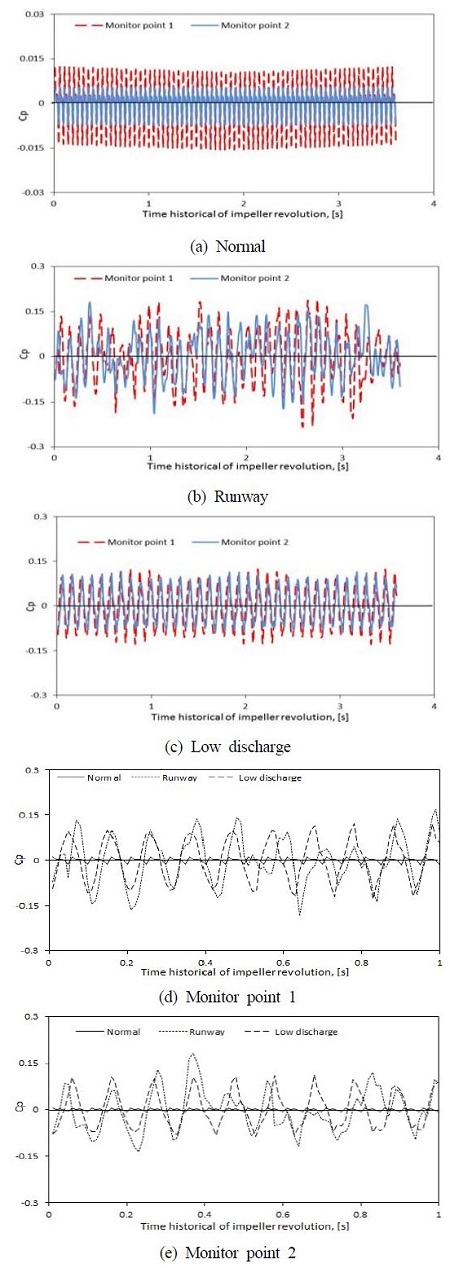
A detailed view of the flow condition in the “S” characteristic curve is presented in Figure 7 by analyzing the pressure fluctuations during normal, runway, and low discharge (guide vane opening of 31 mm) conditions.
The impeller revolutions corresponding to the pressure fluctuations at monitor point 1 (located between the guide vane and the high pressure side of the impeller) and monitor point 2 (located in the middle of the impeller passage), as shown earlier in Figure 2, are presented in Figure 7 (a to e). The fluctuation during normal operation (close to Cp = 0) is insignificant compared to that in the runway and low discharge conditions. The pressure fluctuation becomes evident in the runway condition, and is even more visible in the low discharge condition (close to Cp = 0.10 ~ 0.15).
In the normal condition, as seen in Figure 7 (a), there are no large fluctuations in the pressure coefficient across the time history of the impeller revolution. A similar trend is observed in Figure 7 (a) to (e). It is observed that the fluctuations at monitor points 1 and 2 are very small to have any impact on the impeller structure. However, the same cannot be said for the runway and partial operation conditions, as there are large fluctuations in the pressure coefficient (close to Cp = 0.10 ~ 0.15) across the time history of the impeller revolution, as seen from Figure 7 (b) to (e).
3.3 Internal flow analysis
As the flow rate decreases, the meridional velocity (Vm) decreases at the impeller inlet of the turbine, as explained by Equation (3)
| (3) |
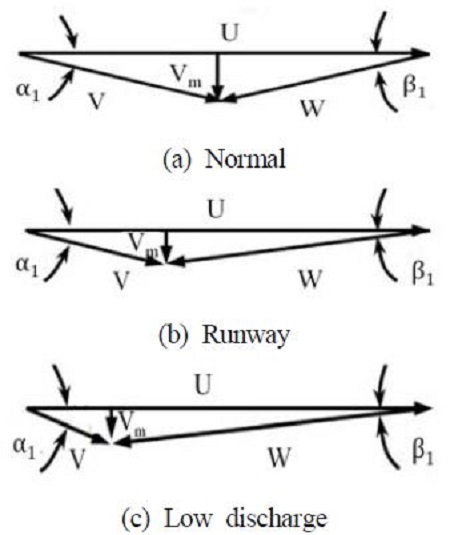
where Q is the flow rate and Aref is the cross sectional area. The flow entering the impeller can be predicted by the velocity triangles in Figure 8 (a) to (c). When the flow enters the impeller, the flow direction is the same as that of the relative flow velocity (W). When the meridional velocity decreases as the flow rate reduces, the relative flow angle (β1) decreases in proportional to the absolute flow angle (α1), which is determined by the guide vane angle and the tangential velocity (U); this propels the flow towards the tangential direction and deviates the blade inflow angle (β=16°). The variation in the relative flow angle (β1) corresponding to the flow rate at the three operational conditions is listed in Table 3.
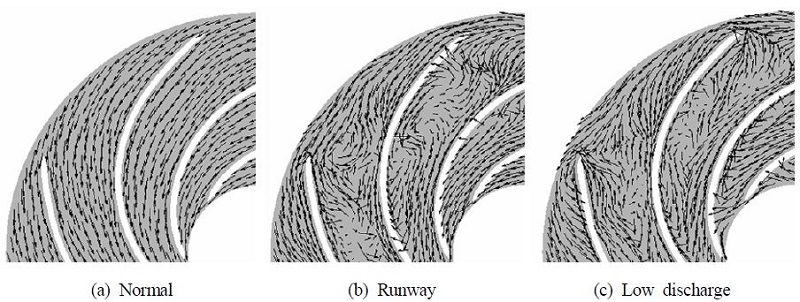
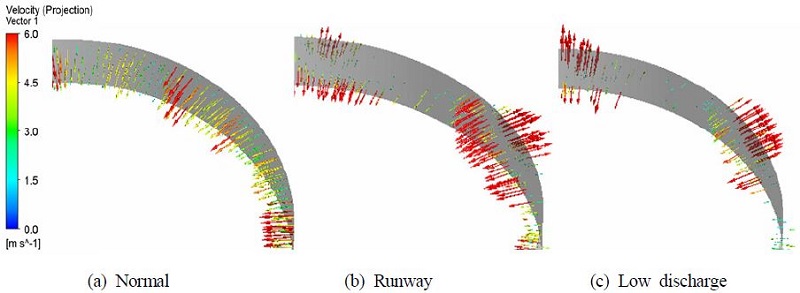
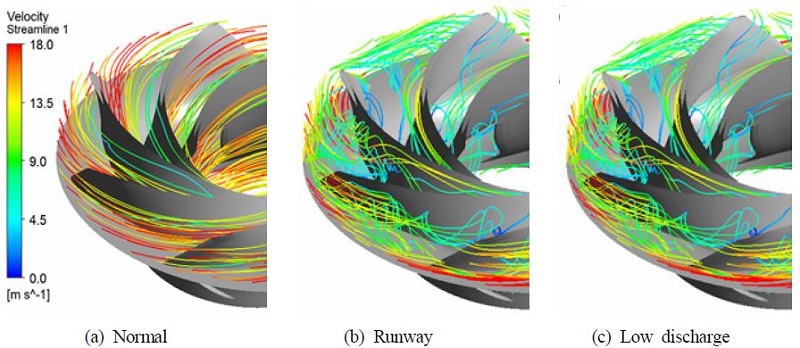
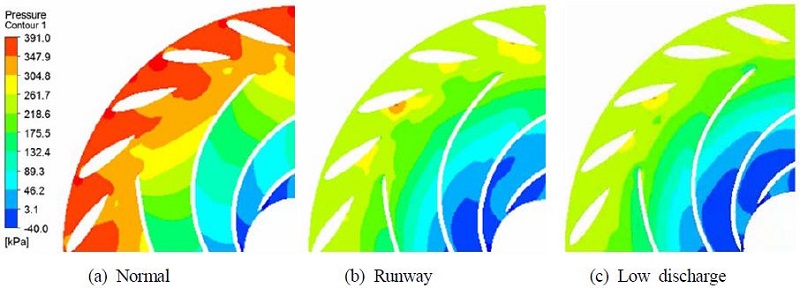
The contours of radial velocity on the rotor-stator interface, velocity vector, streamline, and pressure are presented at the mid-span of the impeller in order to highlight the flow unsteadiness in the runway and low discharge conditions in comparison with the normal operating condition. By comparing the unsteadiness in the normal operating condition with that in the low discharge condition, it is possible to observe that the source of the flow unsteadiness is mainly located in the impeller channels while operating at off-design conditions in the turbine mode.
The radial velocity vectors in Figure 9 reveal the irregular backflow on the rotor-stator interface in the runway and low discharge operating conditions. A portion of the flow goes out of the impeller due to the decrease in the relative flow angle ( β1).
Both the velocity vectors (Figure 10) and streamlines (Figure 11) on the impeller passage show that, in the runway and low discharge conditions, the flow in the impeller is dominated by separation at the inlet and recirculation inside the channels. A vortex appears in the impeller passage in the insufficient flow rate condition, and it occupies the middle of the passage, and the water wall offers resistance for the flow to go through. The chaotic flow condition in the impeller passage causes an increase in low pressure region, as seen in Figure 12.
4. Conclusion
In this study, the internal flow and pressure fluctuation at the normal, runway, and low discharge conditions are explored, giving a detailed description of the hydrodynamic characteristic when the pump-turbine system operates with “S” characteristic. The fluctuation in the normal operation condition is shown to be insignificant compared to that in the runway and low discharge conditions. The pressure fluctuation becomes evident in runway condition, and is even more visible in the low discharge condition. The internal flow investigation in the normal, runway, and low discharge conditions also show similar findings and support the pressure fluctuations observed.
References
- S. Pejovic, Q. F. Zhang, B. Karney, and A. Gajic, “Analysis of pump-turbine “S” instability and reverse waterhammer incidents in hydropower systems”, Proceedings of the 4th International Meeting on Cavitation and Dynamic Problems in Hydraulic Machinery and Systems, Serbia, (2011).
- D. Klemm, “Stabilizing the characteristics of a pump-turbine in the range between turbine part-load and reverse pumping operation”, Voith Forschung and Konstruktion, 28, (1982).
-
J. L. Yin, D. Z. Wang, X. Z. Wei, and L. Q. Wang, “Hydraulic improvement to eliminate S-shaped curve in pump turbine”, Journal of Fluid Engineering, 135, p071105-1, p071105-1, (2013).
[https://doi.org/10.1115/1.4023851]

- Z. J. Wang, B. S. Zhu, X. H. Wang, and D. Q. Qin, “Pressure fluctuations of a pump-turbine in the S-shaped region”, Proceedings of the 6th International Symposium on Fluid Machinery and Fluid Engineering, p19-25, (2014).
- G. Olimstad, B. Borresen, and T. K. Nielsen, “Geometry impact on pump-turbine characteristic”, Proceedings of the 14th International Symposium on Transport Phenomena and Dynamics of Rotating Machine, (2012).
-
C. Chen, B. Zhu, P. M. Singh, and Y. D. Choi, “Design of a pump-turbine based on the 3D inverse design method”, The KSFM Journal of Fluid Machinery, 18(1), p20-28, (2015).
[https://doi.org/10.5293/kfma.2015.18.1.020]

-
P. M. Singh, C. Chen, Z. Chen, and Y. D. Choi, “Investigation into the internal flow characteristics of a pump-turbine model”, The KSFM Journal of Fluid Machinery, 18(4), p36-42, (2015).
[https://doi.org/10.5293/kfma.2015.18.4.036]

-
P. M. Singh, C. Chen, Z. Chen, and Y. D. Choi, “Cavitation characteristics of a pump-turbine model by CFD analysis”, The KSFM Journal of Fluid Machinery, 18(4), p49-55, (2015).
[https://doi.org/10.5293/kfma.2015.18.4.049]

-
C. Chen, P. M. Singh, and Y. D. Choi, “Reliability investigation of a pump-turbine system at various operating conditions”, The KSFM Journal of Fluid Machinery, 18(3), p46-52, (2015).
[https://doi.org/10.5293/kfma.2015.18.3.046]

-
V. Hasmatuchi, M. Farhat, S. Roth, F. Botero, and F. Avellan, “Experimental evidence of rotating stall in a pump-turbine at Off-Design conditions in generating mode”, Journal of Fluids Engineering, Transactions of the ASME, 133(5), p051104-1-051104-8, (2011).
[https://doi.org/10.1115/1.4004088]

- ANSYS Inc, “ANSYS CFX Documentation”, Ver. 13, (2013).

