PCS(Pressure Core Sampler) 개발 및 성능평가실험

Copyright © The Korean Society of Marine Engineering
This is an Open Access article distributed under the terms of the Creative Commons Attribution Non-Commercial License (http://creativecommons.org/licenses/by-nc/3.0), which permits unrestricted non-commercial use, distribution, and reproduction in any medium, provided the original work is properly cited.
초록
비전통 에너지자원은 전통 에너지자원에 비해 지리적으로 넓은 지역에 걸쳐 연속적인 형태로 분포되어 있으나, 잔존 기술적 회수가능 자원량(TRR : Technical Recoverable Resource)은 전통자원과 비슷하여 그 개발이 확대되고 있으며, 특히 셰일가스, 치밀가스, 석탄층 메탄가스, 가스하이드레이트 등의 비전통 가스자원의 개발이 활기를 띄고 있다. 그러나 현재의 물리검층 기술로는 비전통 자원에 포함된 물성, 특히 가스의 함량을 정확히 계산하기 어려우며 관련 기자재 또한 일부 해외 업체에서 독점하고 있다. 따라서 본 연구에서는 지하심부의 시료채취 순간부터 그 지점의 심부압력을 유지하여 시료 내 가스의 손실 없이 코어를 회수하고, 온도와 압력을 실시간으로 기록하는 저류층 PCS(Pressure Core Sampler)를 개발하였으며, 제작된 시제품의 검증을 위한 성능실험을 수행하였다. 모든 성능평가를 통과한 시제품은 In-situ 물성자료의 취득은 물론이고 정확하고 신뢰성 있는 시추코어를 확보하는 데 기여할 것이다.
Abstract
With their wide geographical distribution, unconventional resources are continuously compared against conventional resources, but their development is expanding because TRRs (Technical Recoverable Resources) are similar to conventional resources. In particular, there is active development of unconventional gas resources such as shale gas, tight gas, CBM (coalbed methane) and gas hydrate. However, it is difficult to calculate the material properties of unconventional resources, especially the gas content, with current geophysical logging technology. Additionally, some overseas companies have monopolies on related equipment and materials. Therefore, this study developed a reservoir PCS (Pressure Core Sampler). It can collect core samples without gaseous loss by maintaining high pressure from the moment the core is sampled and record pressure and temperature in real time. Successful performance testing was also carried out for official verification of the manufactured PCS. The reservoir PCS will contribute to the acquisition of geophysical well logging data as well as accurate and reliable cores.
Keywords:
Realtime data detection, Unconventional resources, Reservoir Pressure Core Sampler, Shale gas, Gas hydrate키워드:
실시간 데이터 검출, 비전통가스, 저류층 PCS, 셰일가스, 가스하이드레이트1. 서 론
최근 석유자원 고갈문제로 셰일가스와 가스하이드레이트가 차세대 에너지원으로 각광받고 있다. 가스하이드레이트는 전세계 해양과 시베리아, 알래스카, 극지 등 10조톤에 이르는 막대한 추정 매장량을 가지고 있으며, 셰일가스 또한 전 세계적으로 고르게 분포되어 있다[1]. 현재 확인된 매장량만 187조 4000억 m3으로 향후 전세계가 59년간 쓸 수 있는 양이다[2]. 셰일가스는 기존 주요 자원인 석유에 비해 경제적이고 자원 매장량이 풍부하다는 것이 전문가들의 의견이며, 이 때문에 전 세계 사람들이 관심을 가지고 있다[3]-[5]. 이러한 비전통/전통에너지 자원 개발에 있어 In-situ물성 취득 샘플러가 매장량을 정확히 산정하는데 필수적으로 사용되고 있다. 이는 샘플러가 압력 및 온도에 대한 심부상태의 조건을 정확히 알려주기 때문에 저류층의 총 유기탄소(TOC), 유기물의 성숙도(Tmax 또는 Ro), 공극률 및 투수율에 대한 신뢰성을 높여주기 때문이다[6]. 또한, 비전통/전통 에너지 자원 중 암석강도가 가장 높은 것은 셰일층으로 셰일층에 대한 물성특성을 연구하여 본 PCS 개발에 접목한다면 다른 비전통/전통 에너지 자원 즉, 오일샌드(사암층), 가스하이드레이트(퇴적물층), 석탄액화연료(석탄) 등에서도 PCS를 용이하게 적용할 수 있을 것이다[7].
이 논문은 국내 비전통 석유가스 및 가스하이드레이트 개발 사업의 효율성 증대를 위해 PCS장비의 개발과 이를 활용한 성능평가실험에 관해 살펴보고자 하며, 본 논문은 김상일 외[7]의 연장된 연구 결과임을 밝힌다.
2. 저류층 PCS의 개요
PCS는 1979년 Hunt[8]에 의해 처음 제안되었고, Kvenvolden et al[9]이 최초로 현장(Deep Sea Drilling Project site 533)에 적용하였으며, Dickens et al.[10] 등에 의해 ODP(Ocean Drilling Program) Leg 164, 201, 204에서의 퇴적물 내 가스양과 가스하이드레이트의 분포를 측정하는데 성공적으로 사용된 바 있다. PCS는 심부지층에서 압력 유지 상태의 기체와 액체를 포함한 코어시료 채취 장비로 시추기 전단부에 연결하여 사용하며, 볼밸브 형태의 개폐장치를 이용해 원위치 상태의 압력을 유지한 상태로 가스의 손실 없이 시료를 채취할 수 있다.
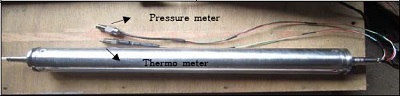
일반적으로 PCS는 ① 시추기의 회전 동력을 PCS에 전달하는 Latch assembly, ② Pressure barrel assembly의 볼밸브 개폐를 담당하는 Actuator assembly, ③ 채취 시료가 원상태의 압력 및 온도를 최대한 보존하도록 용기 역할을 하는 Pressure barrel assembly로 구성되어 있다. 본 연구에서는 여기에 ④ PCS 내부에 탑재가 가능한 모듈형 실시간 데이터 기록장치 DLS(Data Logging System)를 내장하여 시료채취 시, 시료 상태의 정확한 파악과 함께 지상으로 인출 후의 시료 상태를 비교 분석함으로써 In-situ 및 시추 상태까지도 파악 가능하도록 하였다(Figure 1, 2).

Main components of reservoir PCS

PCS 3D modeling
3. 연구내용
3.1 저류층 PCS 시제품 제작
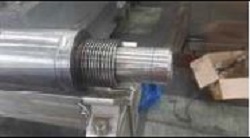
시제품은 크게 PCS본체와 Out casing 부분으로 나누어 제작되었다. PCS본체는 상기 설명한 바와 같이 Latch assembly, Actuator assembly, Pressure barrel assembly, DLS로 구분되며, Out casing의 경우 Drill bit, Reaming shell, Outer tube, Guide pipe, Guide coupling으로 구분된다. PCS 내부 주요 부품은 부식방지를 위해 SUS304를, 그 외 부품은 SCM440 소재를 사용하였다.
Latch assembly part는 시추기의 회전동력을 전달받아 하부로 전달하는 역할을 하며 Actuator 동작을 위해 볼을 떨어뜨리는 Ball Collet ass’y를 포함하여 설계되었다. Ball collet ass’y의 경우 Spring을 사용하여 외부에서 힘을 인가하였을 때 Collet이 상승하면서 끝단이 벌어져 볼을 떨어뜨리는 구조이며, 펌프의 유량이 Actuator 내부로 잘 흘러들어갈 수 있도록 유체흐름을 반영하여 설계, 제작되었다(Figure 3).

Latch assembly part
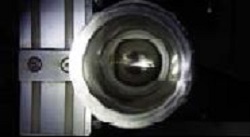
Actuator assembly part의 주요 역할은 하부 코어 채취 후 볼밸브를 닫기 위해 실린더를 작동시키는 것이며, Actuator와 DLS, 압력 및 온도센서 하우징을 포함하여 설계되었다. 주요 설계 포인트는 낮은 유체 압력으로 Actuator를 동작시키기 위해 실린더의 적절한 공차 및 오링을 적용하는 것이며, 2차적으로 센서 및 DLS가 심부에서 외부 압력으로 인해 누수되지 않도록 DLS 하우징을 방수 설계하는 것이다. DLS하우징의 경우 오링을 2중으로 적용하였으며 Actuator는 실린더 동작 및 오링부 누유와 관련하여 제작 후 자체 실험을 통해 문제가 없는 것을 확인하였다(Figure 4).

Actuator assembly
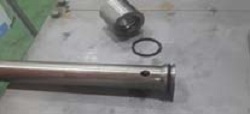
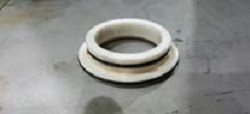
Pressure barrel part는 시료를 채취한 뒤 시료의 압력이 유지될 수 있도록 보존하는 것이 주목적이며, 압력 유지를 위해 Ball valve part를 적용하여 설계하였다(Figure 5). 시추 후 Ball collet이 볼을 Actuator쪽으로 떨어뜨리게 되면 유체의 흐름으로 Actuator와 Core tube가 수직으로 상승하게 되는데 이때 Core tube에 연결된 링크를 통해 Ball valve를 90도 회전하게 된다(Figure 6). 이 과정을 통해 Ball valve를 기준으로 내부는 밀폐 상태가 되어 시료의 압력이 유지된다.

Pressure barrel assembly

Ball valve operation


3.2 실험 방법
제작된 PCS 시제품의 성능평가를 위해 실험 장비를 구축하고 주요 성능 평가항목에 따라 성능 실험을 진행하였다. 실험 방법은 다음과 같다.
PCS의 주요 성능 평가항목은 비전통 가스자원의 채굴환경을 고려하여 선정하였다. 비전통 가스는 근원암에서 생성된 후 저류층으로 이동하지 못하고 생성된 지층에 머물러 있는 천연가스로, 셰일가스, 탄층메탄가스(Coalbed Methane, CBM), 가스하이드레이트 등으로 분류된다. 비전통 가스자원은 종류에 따라 차이는 있지만 대체로 1~2km심도까지 시추하여 채굴하며 가스하이드레이트는 저온고압상태에서 형성되는 특성을 지니고 있다[11]. 따라서 이를 고려하여 PCS의 주요 성능 평가항목을 Table 2와 같이 선정하였으며, 해외 선진제품의 성능을 2차적으로 참고하였다.

Quantitative objectives
정량적 목표 검증을 위해 각 항목별로 실험장비를 제작하였으며, 구성 및 사양은 다음과 같다.
3.2.2.1 PCS 최대사용압력
HPU(Hydraulic Power Unit)을 사용하여 100bar의 압력을 가하여 PCS의 실린더 및 볼밸브 동작을 확인하는 실험이며, 설비 구성은 Figure 11 및 Table 3과 같다.

Test equipment of PCS maximum allowable working pressure
Component of Test equipment
3.2.2.2 PCS 압력손실률
유압자키를 사용하여 볼밸브 내부에 100bar의 압력을 가한 뒤, 일정 시간 경과에 따른 압력 변화를 측정하는 실험이며, 설비 구성은 Figure 12 및 Table 4와 같다.

Test equipment of PCS pressure loss probability
Component of Test equipment
3.2.2.3 실험 계측 장비
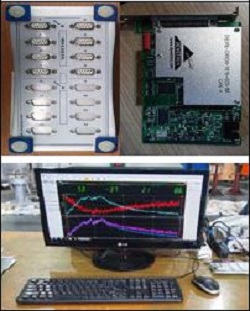
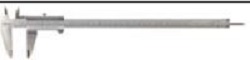
변형률, 압력손실률 등의 객관적인 데이터 값을 얻기 위해 스트레인 게이지 및 모니터링 시스템, 압력게이지, 버니어 캘리퍼스와 같은 계측장비들을 사용하였으며, 압력게이지, 버니어 캘리퍼스와 같은 장비들은 검교정을 통해 데이터에 대한 신뢰성을 확보하였다. 사용된 주요 계측장비의 상세 사양은 Table 5와 같다.
List of measuring equipment.
3.2.3.1 PCS 최대사용압력
본 연구에서 계획된 PCS 최대사용압력은 100bar로, 실린더 동작 유무와 오링파손여부, 주요부 변형 여부 확인을 통해 측정하며 실험 방법은 다음과 같다(Figure 13, 14).

Test procedure of PCS maximum allowable working pressure

Evaluation method of PCS maximum allowable working pressure
3.2.3.2 PCS 최대사용온도
PCS 온도 조건의 경우 기계구조물이므로 재료 물성치와 오링 물성표를 검토하여 목표 온도 범위 내에서 사용가능 여부를 판단한다.
3.2.3.3 PCS 압력손실률
PCS 압력 손실률 측정을 위해서는 볼밸브가 닫혔을 때 Core tube 내 압력 손실률을 측정하는 방법으로 진행되었으며, 실험 방법은 다음과 같다(Figure 15, 16).

Test procedure of PCS pressure loss probability

Evaluation method of PCS pressure loss probability
3.3 실험 결과
최대사용압력 100bar를 인가하였을 때 실린더가 정상적으로 동작하여 볼밸브가 닫히는 것을 확인하였으며, 100bar 상태에서의 시제품 외형변화 및 오링 파손은 발생되지 않았다(Figure 17, Table 6 - 8).

Measurement point of PCS
PCS Dimension measurement result (단위:㎜)
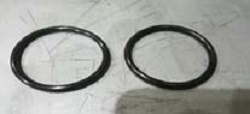
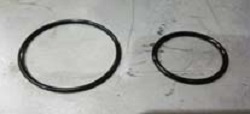
O-ring appearance comparison
Ball valve operation
니트릴 소재 오링의 경우 사용온도가 일반적으로 –30~120℃이며, 120℃일 때 인장강도 변화율이 최대 15% 이내를 만족한다(KS B 2805 O-링 참조).
PCS는 SUS304(내부)과 SCM440(외부)로 제작되었으며 두 재질의 열에 대한 주요 물성치는 Table 9와 같다. SUS304와 SCM440의 열팽창계수가 다르기 때문에 실린더나 볼밸브가 동작할 때 끼임 현상이 발생할 수 있다. 그러나 실린더 동작부는 전부 SUS304로 제작되어 있어 문제가 되지 않으며, 볼밸브의 경우 최대 변형량이 65㎛로 볼밸브 하우징과 1㎜ 여유 공차가 있기 때문에 끼임현상이 발생하지 않는다.
Thermal properties of SUS304, SCM440
PCS의 압력손실률 실험은 Figure 18과 같이 PCS 시제품의 볼밸브 상부에 목표압력 100bar를 가압한 뒤, 60분의 시간동안 볼밸브 상부의 압력변화를 계측함으로써, PCS 시제품의 압력손실률을 3회에 걸쳐 평가하였다.

Measurement point of Ball valve assembly
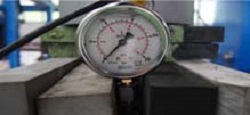
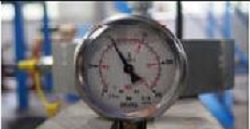
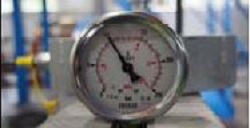
압력게이지를 통한 압력변화를 관찰한 결과 3차례 모두 손실률 5% 이내를 만족하였다(Table 10-11).
Pressure check with Pressure gauge
PCS pressure loss probability result (단위:bar)
추가적으로 볼밸브를 기준으로 압력이 인가되는 상부쪽은 No.1(횡방향), No.3(종방향), 하부는 No.2(횡방향), No.4(종방향) 총 4개의 스트레인게이지를 부착하여 변형률을 계측하였으며 각 스트레인게이지는 10mm의 게이지 길이를 가지며 전체 실험과정동안 초당 10개의 변형률을 기록하였다. 그 결과는 Figure 19와 같다.

Strain from strain gauges during the test
볼밸브를 기준으로 상부측에는 내압이 인가되어 인장력이 작용하였으며, 하부측은 종방향의 경우 인장력을, 횡방향은 압축력이 작용하였음을 알 수 있다. 이는 상부에 인가된 압력으로 인해 Ball valve housing이 팽창함으로써 발생하는 결과임을 알 수 있었다.
Table 12는 스트레인게이지로부터 계측된 최대, 최종 변형률 및 최대 압력에서의 변형량, 응력 및 식 (1)을 통한 압력손실률을 나타낸다.
| (1) |
Strain variation and final pressure calculation
변형률에 따른 최종 압력은 각 스트레인게이지에서 96.7~97.5bar로써, 평균 97.1bar로 계측되었으며, 이는 1시간동안 평균 2.9%의 압력손실률을 나타낸다.
4. 결 론
이 논문의 목적은 국내에서 시도된 적 없는 PCS 제작 및 실험시추를 통해 저류층의 압력과 온도를 심부환경(In-situ)에서 바로 측정함과 동시에 인양되는 과정에서 변화되는 압력과 온도를 기록하는 DL-PCS 작동을 테스트하는 것이며 향후 현장실험도 예정되어 있다. 비전통 에너지자원 중 천연가스와 관련된 사업이 계속적으로 늘어나는 시점에 DL-PCS의 수요는 증가할 것으로 전망되며, 보다 많은 연구를 통해 국내 PCS의 새로운 시장으로 부상할 것으로 예상된다.
Nomenclature
P : Peak pressure (Bar)
P′ : Final pressure (Bar)
ε : Peak strain (um/m)
ε′ : Strain after 1 hour (um/m)
Acknowledgments
본 연구는 지식경제부의 재원으로 한국에너지기술평가원(KETEP)의 지원을 받아 에너지자원융합원천 기술개발사업 중 “비전통 석유가스 저류층 In-situ 물성취득 기술개발”과제(No.2012202300010)의 일부로 수행되었으며, 이에 관계자 여러분에 감사드립니다.
References
- J. S. Lim, “For securing stable energy and resources, ocean development is essential”, Economic Bulletin, 24(4), p12-13, (2013), (in Korean).
-
Y. D. Koo, Y. I. Kim, and K. S. Park, “Global trends of shale gas development information”, Economic and Environmental Geology, 47(2), p193-204, (2014).
[https://doi.org/10.9719/EEG.2014.47.2.193]

- Y. S. Shin, K. S. Park, D. J. Kwak, Y. S. Jeong, J. H. Yoon, and J. Y. Lee, Impacts of Shale Gas Revolution on Korea Industries and Implications, Korea Institute for Industrial Economic & Trade, Korea, (2013).
- H. J. Park, Past, Present and Future of Shale Gas, Center for Energy Governance & Security, Korea, (2014), (in Korean).
- K. J. Cho, “Impact and issues of unconventional resources development on the global industry”, Energy forcus, 10(1), p78-98, (2013), (in Korean).
- Y. J. Lee, “Gas hydrate exploration by using PCS(Pressre Core Sampler): ODP Leg 204”, Economic and Environmental Geology, 38(2), p165-176, (2005).
-
S. I. Kim, Y. H. Cho, J. S. Ki, D. W. Kim, K. K. Lee, H. J. Kim, and K. J. Kim, “Development of a Pressure Core Sampler with built-in data logging system”, The Korea Society of Engineering Geology, 24(3), p423-429, (2014).
[https://doi.org/10.9720/kseg.2014.3.423]
- J. M. Hunt, Methane Hydrates, in : Petroleum Geochemistry and Geology, W.H. Freeman and Co, San Francisco, p156-162, (1979).
-
K. A. Kvenvolden, L. A. Barnard, and D. H. Cameron, Pressure core barrel: application to the study of gas hydrates, Deep Sea Drilling Project Site 533, Leg 76, In Sheridan, R. E., Gradstein, F. M., et al , Init. Repts. DSDP, 76, Washington, DC (U.S. Govt. Printing Office), p367-375, (1983).
[https://doi.org/10.2973/dsdp.proc.76.107.1983]
-
G. R. Dickens, P. J. Wallace, C. K. Paull, and W. S. Borowski, “Detection of methane gas hydrate in the pressure core sampler (PCS): volume-pressure time relations during controlled degassing experiments”, Proceedings of the Ocean Drilling Program, Scientific Results, 164, p113-126, (2000).
[https://doi.org/10.2973/odp.proc.sr.164.210.2000]
- J. C. Ryu, Technical Progress of Unconventional Resource and E&P Business Prospect, Korea Energy Economics Institute, Korea, (2012).