The effect of suction pipe leaning angle on the internal flow of pump sump
Copyright ⓒ The Korean Society of Marine Engineering
This is an Open Access article distributed under the terms of the Creative Commons Attribution Non-Commercial License (http://creativecommons.org/licenses/by-nc/3.0), which permits unrestricted non-commercial use, distribution, and reproduction in any medium, provided the original work is properly cited.
Abstract
A better flow condition for the intake of pump is provided by the sump pump that connects the forebay to the intake of the pump station. If the suction sump is improperly shaped or sized, air-entraining vortices or submerged vortices may develop. These phenomena may greatly affect pump operation if vortices become sufficiently large. Moreover, any remaining vortices in the pump flow passage may result in an increase in the noise and vibration of the pump. Therefore, the vortices in the pump flow passage must be reduced to achieve good pump sump station performance. In this study, the effect of suction pipe leaning angle on the pump sump’s internal flow is investigated. Additionally, a pipe type with an elbow shape is investigated. The results show that the air entraining vortices occur under the condition of a water level ratio H/D = 1.31 for each suction pipe type.
Keywords:
Pump sump, Leaning angle, Internal flow1. Introduction
A better flow condition for the intake of pump is provided by the sump pump that connects the forebay to the intake of the pump station. If the suction sumps are improperly shaped or sized, air entraining vortices or submerged vortices may develop. These phenomena may significantly affect pump operation if these vortices become sufficiently large [1]. Moreover, the addition of noise and vibration from the pump can be increased if free air mixes with the pump flow. Therefore, vortices in the pump flow passage must be reduced to achieve good pump sump station performance [2][3].
Many research results regarding pump sump internal flow analysis can be found. Li et al. [4] studied the three-dimensional simulation of flows in practical water pump intakes. This study made significant strides from a simple intake to a more complex (real) intake and showed good prospects of further use of this 3D model to simulate flows in practical water pump intakes. Ansar et al. [5] studied three-dimensional (3D) pump intake flows with and without a cross flow. In their work, acoustic Doppler velocimetry (ADV) was employed to examine the flow pattern in the approaching flow.
In this study, three leaning angles are employed. Moreover, a suction pipe with different elbow types is also investigated.
2. Suction Pipe Model and Numerical Methods
2.1 Suction pipe model
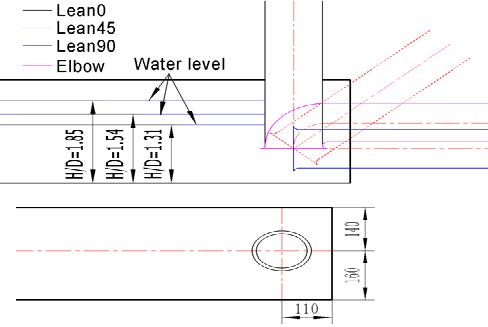
Figure 1 shows a 2-D view of the pump sump model with different suction pipe types. The pump sump model by TSJ (Turbomachinery Society of Japan) [6] was selected for investigating the effect of suction pipe leaning angle on the pump sump internal flow.
The diameter of the suction pipe is D = 130 mm. The distance between the inlet bell and the floor is C = 100 mm. The distance from the rear wall to the pump inlet bell centerline is B = 110 mm. The pump inlet bay entrance width is W = 300 mm. The suction pipe center location is eccentric distribution at the width direction of the pump sump, as shown in Figure 1.
There are three leaning angles for the suction pipe. The leaning angle of 0˚ is the vertical pipe type (Case A). The leaning angle of 45˚ is used in Case B. The suction pipe has a horizontal arrangement in Case C, for which the leaning angle is 90˚. Additionally, a suction pipe with an elbow shape is used in Case D. The suction pipe inlet center is kept the same for all of the cases, as shown in Figure 1. In addition, there are three different water level ratios (from H/D = 1.31 to H/D = 1.85), which are applied to different suction pipe types, as shown in Table 1.
2.2 Numerical methods
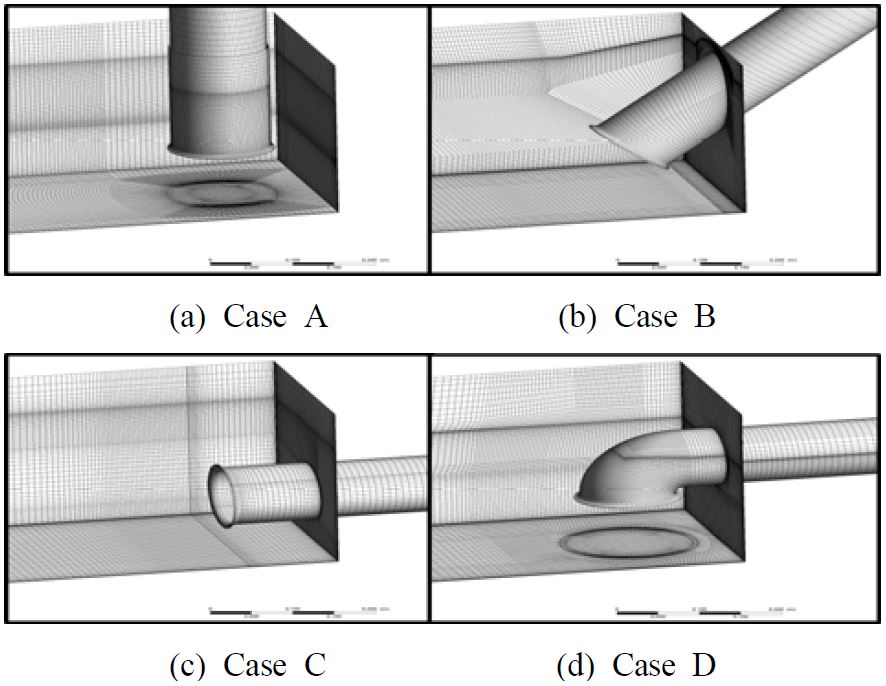
For the numerical simulation, commercial computational fluid dynamics CFD code in ANSYS CFX [7] is adopted. J. Matsui et al. [8], presented the numerical simulation of flow in a pump sump with free surfaces using tetrahedral and hexahedral numerical meshes. According to their study, the tetrahedral numerical mesh cannot simulate a smooth water surface. Therefore, hexahedral numerical meshes of the flow field are applied in each case in this study, as shown in Figure 2. Many elements (roughly 1.3 × 10⁶) are employed to create a mesh in the fluid domain.
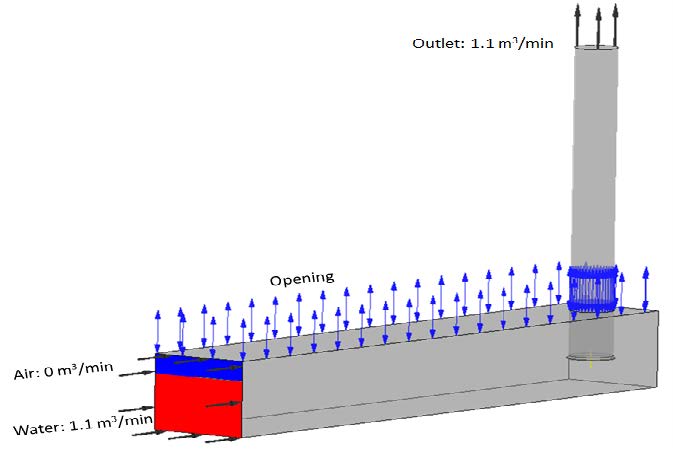
As boundary conditions for the unsteady state calculation, a mass flow rate of 1.1 m3/min is set for the water flow at the inlet and outlet, and a velocity of 0 m/s is set for the air flow. The boundary condition of the opening is set at the open duct. The no-slip condition is applied to all of the walls, as shown in Figure 3. Additionally, the water level for the initial condition is set for different cases. Gravity is included for two-phase transient calculations. The unsteady state simulation is based on the result of the steady state calculation. The SST (shear stress transport) turbulence model is used to realize the complex vortex flow around the pump sump in detail. The SST model is a two-equation turbulence model by Menter et al. [9]. The SST turbulence model is adopted in this study.
The CFD method is very important for investigating the flow analysis. A benchmark study for the given shape of a single pump intake was conducted to determine the reliability of the present CFD analysis method.
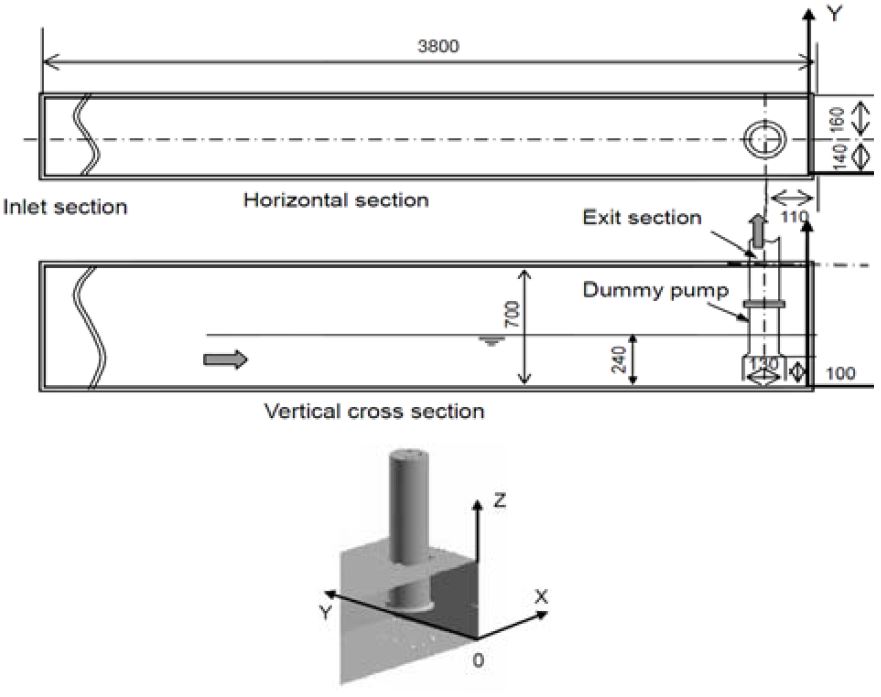
The pump sump model of TSJ was selected for the benchmark simulation. Figure 4 shows the dimension of the TSJ pump sump model. To obtain steadily generated vortices, the center of the pump intake was set on the centerline of the sump [6]. The unsteady state calculation was conducted as a validation test of the present CFD analysis method after the 3D model and the numerical mesh were determined. Table 2 shows the characteristics of the CFD codes contributing to the establishment of the benchmark.
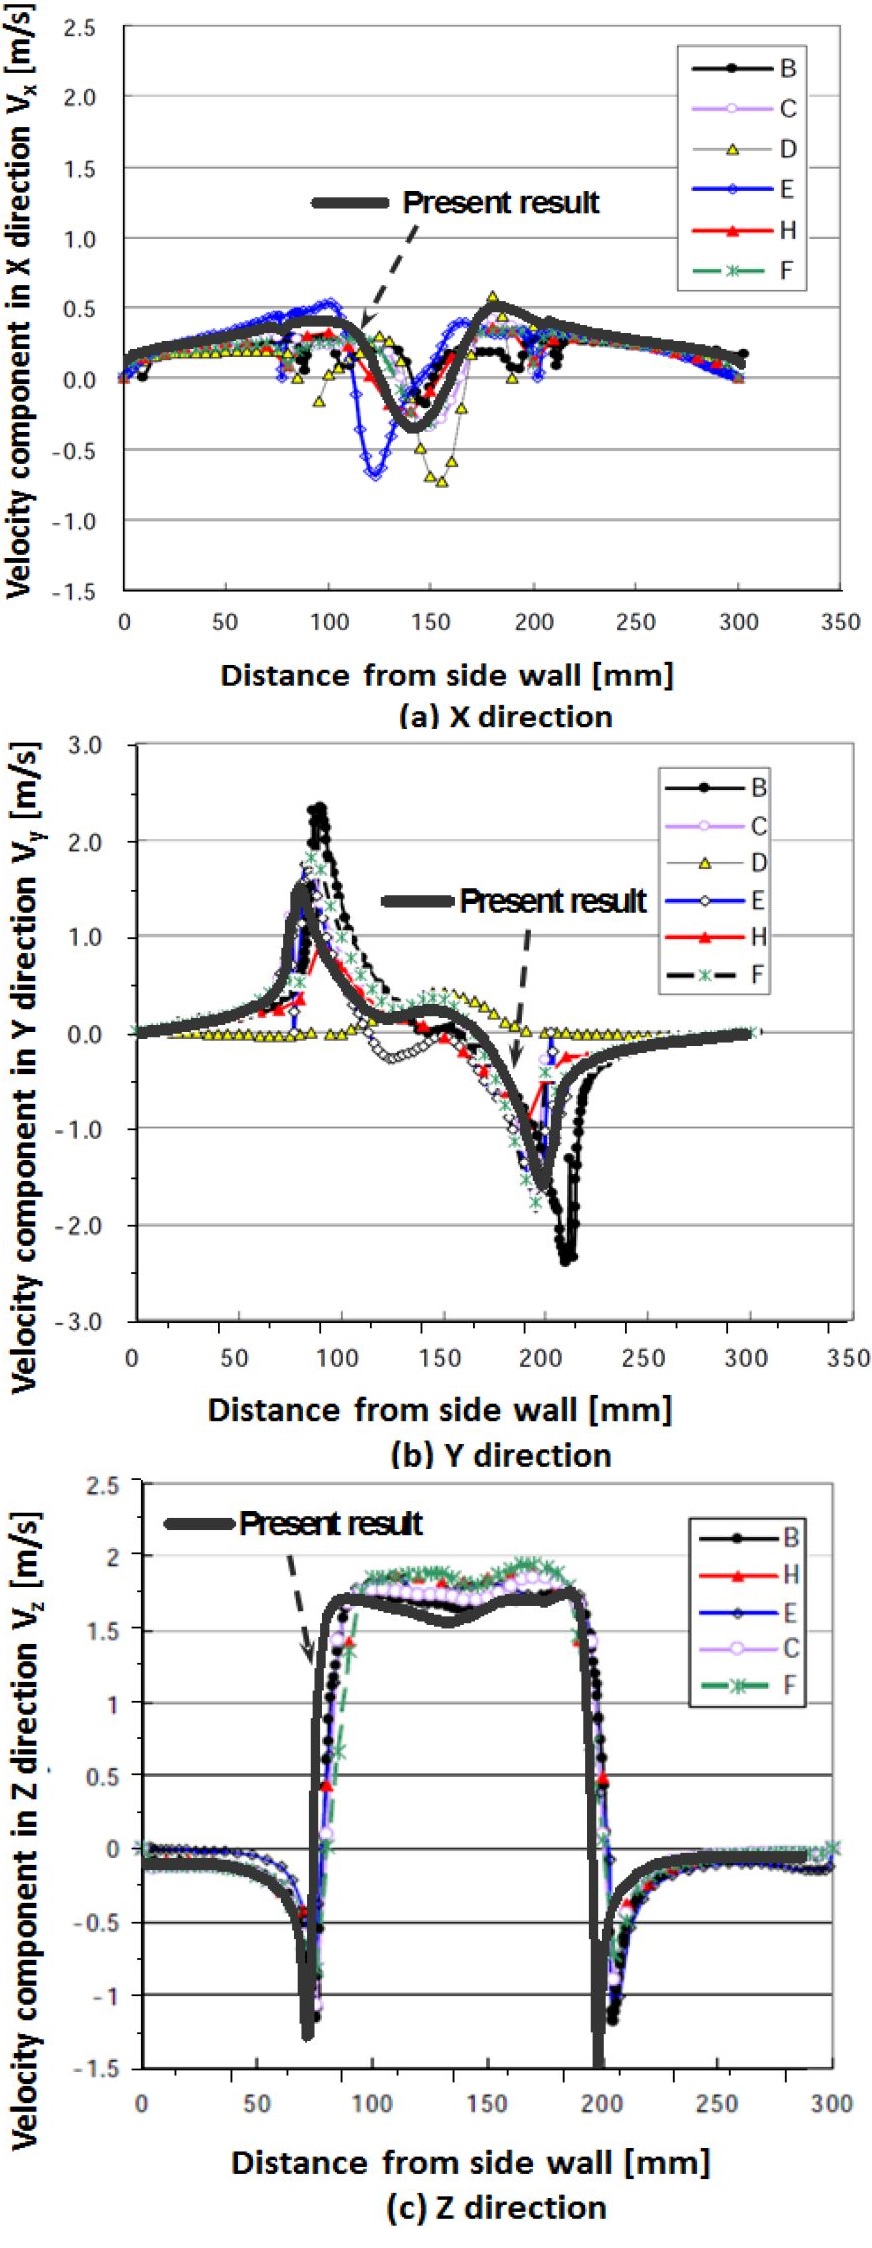
sult is shown in Figure 5. The comparison reveals that the velocity component distributions in X, Y and Z directions of the present result agree well with the CFD results based on other contributed CFD codes the CFD codes used in the literature. Reverse flow is observed in the center of the suction pipe. A negative value occurs in the velocity component in the X direction (Vx). The eccentric whirling flow (based on the eccentricity of the suction pipe location) is shown in Figure 5 (b).
3. Results and Discussion
3.1 Air-water interface with different cases
Visualization of the air-water interface is a very important tool when examining the free surface vortex. The elevation of the air-water interface is shown in Figures 6 to 9. The surface is visualized for a position whose water volume fraction is 0.7. As the water surface continues to move during the simulation, snapshots are taken at time steps that are typical for internal flow analysis.
There are two free surface vortices located at both sides of the suction pipe near the rear wall under the condition of a 1.31 water level ratio (Case A1). The length of the main free surface vortex reaches the suction pipe intake from the air-water interface. Moreover, the small free surface vortex is sufficiently well formed as to suck the air into the suction pipe. As the water level increases to H/D = 1.54 (Case A2), a surface dimple vortex remains. For a water level ratio of 1.85 (Case A3), the free surface vortex and the surface dimple vortex disappear.
There are two free surface vortices located at both sides of the suction pipe near the rear wall under the condition of a 1.31 water level ratio (Case B1). Moreover, the length of both free surface vortices reaches the suction pipe intake from the air-water interface. However, the free surface vortex disappears when the water level ratio is 1.54 (Case B1). In addition, there is no free surface vortex for a water level ratio of 1.85 (Case B3).
The suction pipe arrangement of Case C is horizontal. There is a large volume of air sucked into the suction pipe at the water level ratio of 1.31 (Case C1). Moreover, this large volume of air remains in the suction pipe and follows the water flow. When the water level ratio increases to 1.54 (Case C2), the free surface vortices become an intermittent vortex. Moreover, some air bubbles remain in the suction pipe. There is no free surface vortex under the condition of a water level ratio of 1.85 (Case C3).
The suction pipe arrangement in Case D is elbow type. After the inlet elbow section, the pipe is horizontally oriented. There are also two free surface vortices of different intensity, which are located at both sides of the suction pipe near the rear wall, under the condition of a 1.31 water level ratio (Case D1). Until the water level ratio increases to 1.54 (Case D2), the two free surface vortices are almost separating, which indicates an intermittent vortex. There is no free surface vortex when the water level ratio is 1.85 (Case D3).
3.2 Free surface vortex intake area distribution
To investigate the effect of the suction pipe leaning angle on the pump sump internal flow characteristics, the free surface vortex intake area (A) is examined.
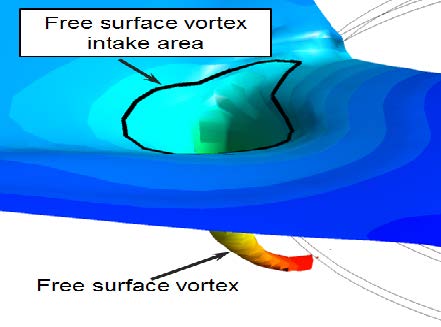
The structure of the free surface vortex intake area is shown in Figure 10. The amount of air sucked into the suction pipe is determined by the free surface vortex intake area; therefore, it is a very important factor to quantitatively evaluate the performance of the pump sump.
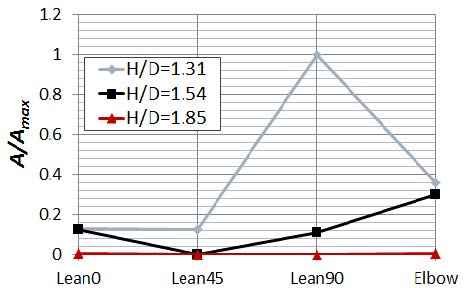
Figure 11 shows the free surface vortex intake area distributions of the different suction pipe types. The free surface vortex intake area is normalized using A/Amax, where the maximum area is Amax. The case with a leaning angle of 90˚ at a water level ratio of 1.31 has the maximum free surface vortex intake area. The free surface vortex intake area at a leaning angle of 0˚ or 45˚ is lower than that at a leaning angle of 90˚ or for the elbow type. No free surface vortex forms at the water level ratio of 1.85, regardless of suction pipe type. Moreover, the case with a leaning angle of 45˚ suppresses the free surface vortex at a water level ratio of 1.54.
3.3 Velocity component analysis
For the purpose of examining the effect of the suction pipe leaning angle on the pump sump internal flow characteristics in detail, quantitative values in the velocity component distributions at the suction pipe intake are investigated.
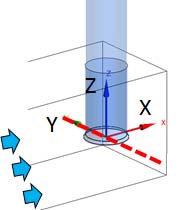
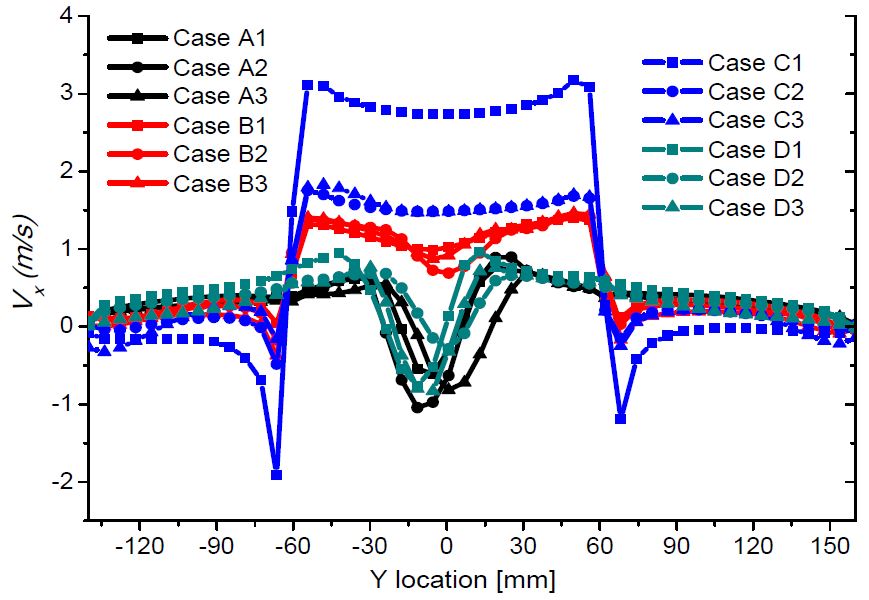
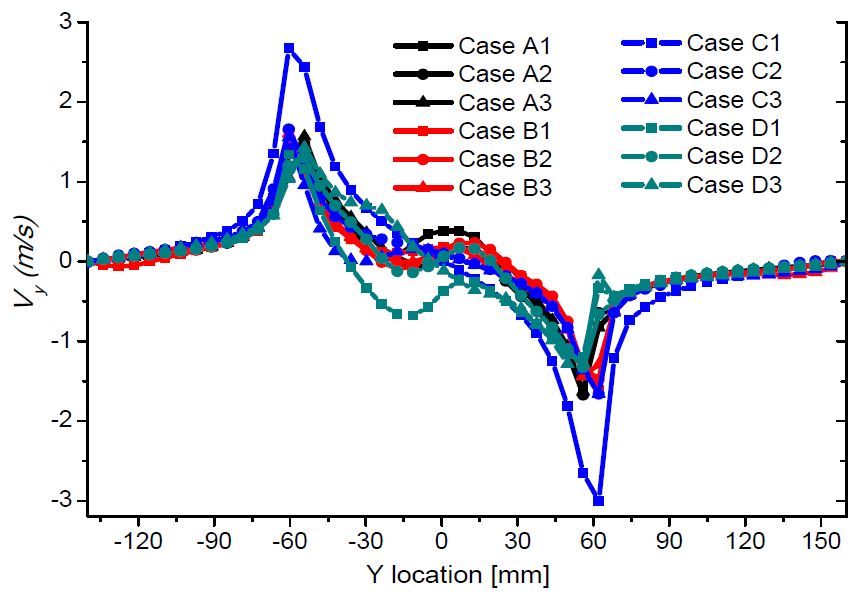
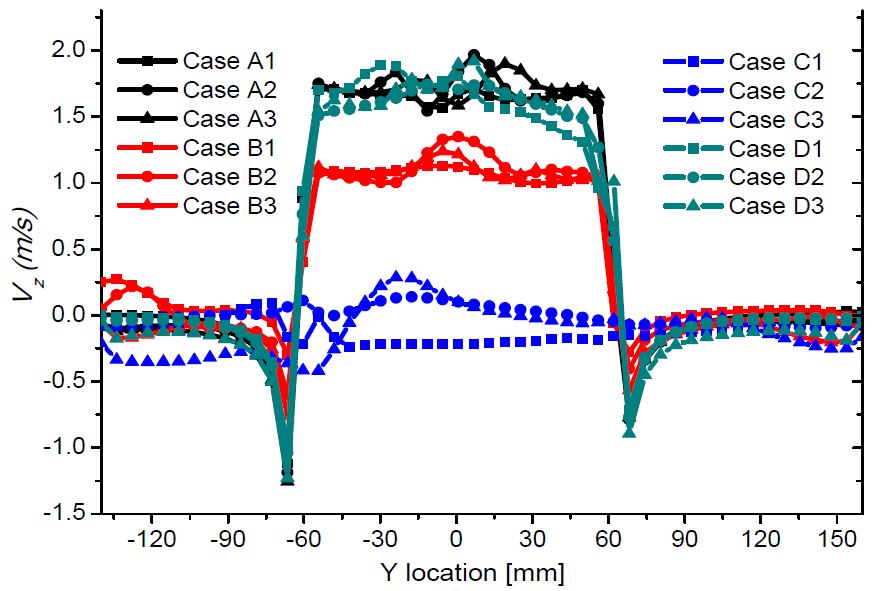
The velocity component measurement location is shown in Figure 12. The coordinate is located at the center of the suction pipe intake. The zero of the abscissa is the center of the suction pipe intake. The velocity components located on the Y axis are plotted in Figures 13 to 15.
Figure 13 shows the velocity component distribution in the X direction (Vx). As the bell mouth in Cases A and D is vertical, for these cases, Vx has a similar distribution at the suction pipe intake. When increasing the leaning angle of the suction pipe, the intensity of Vx increases, as shown in Cases B and C. Therefore, the velocity component distribution in the X direction is determined primarily by the placement of the bell mouth.
Figure 14 presents the velocity component distribution in the Y direction (Vy). The distributions of Vy are similar for all cases, except for Case C1. The highest Vy values are found for Case C1, which has the largest amount of air sucked into the suction pipe. In general, there is a slight effect of suction pipe angle on the velocity component distribution in the Y direction.
Figure 15 shows the velocity component distribution in the Z direction (Vz). The Vz distribution for Cases A and D is similar: the trend is same as the velocity component distribution in the X direction. However, a larger suction pipe leaning angle decreases Vz.
4. Conclusion
The free surface vortex in a model pump sump is simulated numerically using a CFD method. In general, the amount of air sucked into the suction pipe increases with increasing suction pipe leaning angle. For the horizontal suction pipe, the maximum amount of air is sucked into the suction pipe. However, there is a significant effect for an elbow type bell mouth installed in a horizontal suction pipe: it suppresses the amount of air sucked into the pipe. Additionally, the vertical suction pipe was effectively able to reduce the free surface vortex intake area.
References
- Japan Association of Agricultural Engineering Entreprise, Pumping Station Engineering Handbook, Japan, (1991).
-
S. K. Park, J. G. Yun, and H. C. Yang, “Experiment investigation of the development of a rotor type slurry pump”, Journal of the Korean Society of Marine Engineering, 39(4), p456-462, (2015).
[https://doi.org/10.5916/jkosme.2015.39.4.456]

-
K. S. Kim, K. H. Jung, H. Y. Kim, N. H. kim, and J. H. Cho, “Development of drainage pump for rescue sinking ship”, Journal of the Korean Society of Marine Engineering, 39(3), p248-254, (2015).
[https://doi.org/10.5916/jkosme.2015.39.3.248]

- S. Li, J. M. Silve, Y. Lai, L. J. Weber, and V. C. Patel, “Three-dimensional simulation of flows in practical water-pump intakes”, Journal of Hydroinformatics, 8(2), p111-124, (2006).
-
M. Ansar, and T. Nakato, “Experimental study of 3D pumpintake flows with and without cross flow”, Journal of Hydraulic Engineering, 127(10), p825-834, (2001).
[https://doi.org/10.1061/(ASCE)0733-9429(2001)127:10(825)]

- Turbomachinery Society of Japan, Standard Method for Model Testing the Performance of a Pump Sump, TSJ S002 (2005).
- ANSYS Inc, ANSYS CFX Documentation,ver. 13, http://www.ansys.com, Accessed November 10, 2013.
-
J. Matsui, Y. Sugino, and K. Kawakita, “Numerical Simulation on Flow in Pump Sump with Free Surface”, Proceeding of the 6th International Symposium on Fluid Machinery and Fluids Engineering, 2014.
[https://doi.org/10.1049/cp.2014.1249]

- F. R. Menter, M. Kuntz, and R. Langtry, “Ten years of industrial experience with the SST turbulence model”, Proceeding of the Fourth International Symposium on Turbulence, Heat and Mass Transfer, Begell House, Redding, CT, (2003).

