Synthesis of a new class of carbon nanomaterials by solution plasma processing for use as air cathodes in Li-Air batteries
Copyright ⓒ The Korean Society of Marine Engineering
This is an Open Access article distributed under the terms of the Creative Commons Attribution Non-Commercial License (http://creativecommons.org/licenses/by-nc/3.0), which permits unrestricted non-commercial use, distribution, and reproduction in any medium, provided the original work is properly cited.
Abstract
Li-air batteries have a promising future for because of their high energy density, which could theoretically be equal to that of gasoline. However, substantial Li–air cell performance limitations exist, which are related to the air cathode. The cell discharge products are deposited on the surfaces of the porous carbon materials in the air electrode, which blocks oxygen from diffusing to the reaction sites. Hence, the real capacity of a Li-air battery is determined by the carbon air electrode, especially by the pore volume available for the deposition of the discharged products. In this study, a simple and fast method is reported for the large-scale synthesis of carbon nanoballs (CNBs) consisting of a highly mesoporous structure for Li-air battery cathodes. The CNBs were synthesized by the solution plasma process from benzene solution, without the need for a graphite electrode for carbon growth. The CNBs so formed were then annealed to improve their electrical conductivity. Structural characterization revealed that the CNBs exhibited both an pore structure and high conductivity.
Keywords:
Carbon material, Li-air battery, Porous material, Solution plasma processing1. Introduction
Environmental considerations are back at the top of the shipping industry’s agenda, with the most recent amendments to the United Nations International Maritime Organization’s MARPOL regulations, which became effective in January of 2015. The new limits under MARPOL are expected to reduce greenhouse gas emissions from ships by 30% by 2030, a cut designed to curb the growth of the industry’s share of global emissions, which would otherwise rise to 18%. A very attractive option under these new regulations is to adopt a full or hybrid electric architecture for new ships, where advanced battery technologies offer interesting possibilities for the creation of highly efficient and cost-effective marine propulsion and auxiliary systems [1]. Of the battery technologies available, lithium-O2 (Li-O2) shows particular promise for demanding marine applications because, theoretically, the calculated energy density of Li-O2 is comparable with that of gasoline. Li-O2 can store 5-10 times more energy than current lithium-ion (Li-ion) batteries. In particular, among various types of Li-air batteries, non-aqueous systems have attracted the most attention for practical applications due to their remarkable energy density, safety, and rechargeability. However, these batteries’ actual discharge capacity often falls short of the estimated theoretical value. Since the discharge product, Li oxide, is not soluble in non-aqueous electrolytes, the precipitate blocks the pore entrance prior to filling the total pore volume in the air electrode. Therefore, the pore structure of the carbon electrode might govern the performance of the Li-O2 battery
Hence, a carbon material engineered to have a large pore diameter and large pore volume is needed for rapid oxygen diffusion and prevention of pore entrance blocking caused by deposition of the discharge products.
In recent years, a number of synthesis methods have been attempted to improve the pore framework: (a) chemical and physical activation, and a combination of the physical and chemical activation processes [2]; (b) catalytic activation using certain metals [3]; (c) carbonization of polymer blends and aerogels [4] or cryogels [5]; and (d) a template method [6]. However, methods (a), (b), and (c) result in significant micro porosity [7][8], while methods (c) and (d) involve multiple steps (c: preparation template composite, carbonization, removal of the inorganic template; d: gelation, curing, drying, carbonization). Method (d), in particular, requires time-consuming drying conditions such as supercritical drying, which also has safety issues.
In this article, a simple, fast, efficient, and economical method for the large-scale synthesis of carbon nanoballs (CNBs) is reported. CNBs were synthesized by solution plasma processing (SPP) from a toluene solution, without the need for using a graphite electrode. The material was annealed after SPP in order to improve its crystallinity. Structural characterizations revealed that the CNBs exhibited both an optimum pore structure and high conductivity.
2. Experimental Procedures
2.1 Preparation of carbon nano balls
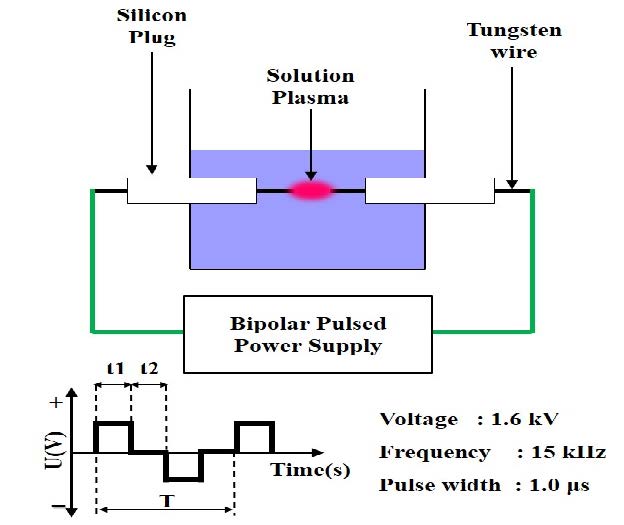
The solution plasma process (SPP) was used for the synthesis of CNBs tested in this study. During discharge, the SPP generated a variety of active species, and required only low thermal loading and low plasma temperature. The SPP is superior to conventional methods, owing to its ease of handling, lack of a need for elevated pressure and temperature, short consumption time, and applicability to a wide variety of chemicals. The glow-like discharge in benzene was produced by a bipolar-pulsed power supply containing a tungsten electrode. Processing time was 20 min. The voltage, pulse frequency, pulse width, and electrode distance were set to 1.6 kV, 15 kHz, 1.0 μs, and 0.3 mm, respectively. The schematic of the SPP is displayed in Figure 1.
Heat treatment of the synthesized CNBs was performed in a tube furnace with a 30 min dwell time under flowing Ar gas, with heat treatment temperatures (HTTs) ranging from 250 °C to 850 °C (heating rate: 25 °C min-1 and cooling rate: 7 °C min-1).
2.2. Characterization of CNBs
X-ray diffraction (XRD) patterns were recorded using an XRD Rigaku Smartlab with Cu Kα radiation (λ = 0.154 nm). Transmission electron microscopy (TEM) observations were performed on a JEM-2500SE at an acceleration voltage of 200 kV. Scanning electron microscopy (SEM) images were obtained on a JSM-6330F (JEOL) at an acceleration voltage of 5 kV. The BET surface area, total pore volume, and pore diameter of the CNBs were calculated from N2 adsorption–desorption isotherms by the Brunauer–Emmett Teller method (BET), using a Belsorp-mini II system. All the samples were degassed at 200 °C for 2 h prior to recording the isotherms.
3. Results and Discussion
Approximately 1000 mg of CNBs were generated from 100 ml of benzene with 30 min of SPP treatment. The morphology of the CNBs was observed using SEM, as shown in Figure 2. The SEM images show that the diameter of the CNBs ranged from 20 nm to 30 nm. The CNB spheres were found to have a chain-like morphology.
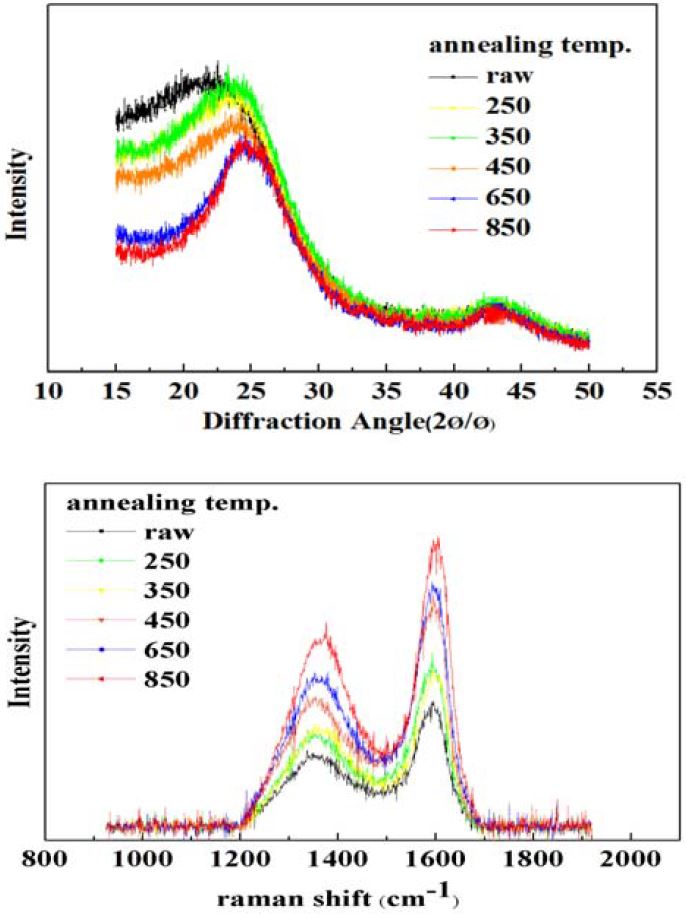
The structure of the CNBs annealed from 250 °C to 850 °C was characterized by TEM, XRD, and Raman spectroscopy. Figure 3 (b) shows the high-resolution TEM (HRTEM) micro-graph of annealed CNBs at 850 °C.
Figure 3 shows that raw CNBs are kinds of graphitizable carbon with turbostratic disorder. Below 1000 °C, the amorphous layers in the CNBs become long-range highly ordered multiple graphitic layers by the growth of aromatics. The XRD results also revealed the structural features of the annealed CNBs. The graphitization process includes the expansion of the graphite plane layer and the increasing number of graphite lamination layers. Therefore, with increasing annealing temperature, the c-axis correlation length (Lc), and the a-axis correlation length (La) increased. The figure also shows two peaks around 26.3° and 44.4° for 2θ, which correspond to <002> and <101> diffraction of graphite planes, respectively. These peaks and planes correspond to the image in Figure 2 (a). Lc and La for CNBs were calculated from the (002) peak using the Scherrer equation [9] shown in Equation (1).
The CNBs were also characterized by Raman spectroscopy. Figure. 3 (b) shows the Raman scattering spectrum of the annealed experimental CNBs in the frequency range between 1000 and 2000 cm-1. All of results show that two main Raman bands occurred at about 1355 and 1580 cm-1. The D-band in graphite involves scattering from a defect, which breaks the basic symmetry of the graphene sheet, it is observed in sp2 carbons containing porous, impurities or other symmetry-breaking defects. On the other hand, the second one (G-band) correspond to the graphitic layers that is related to the order of the graphitization of CNBs. Thus, the ratio between the D band and G band is a useful indicator of the graphitization of CNBs. The intensities of D and G peaks were calculated from their peak heights and hence their ratio (ID/IG) could be used to confirm the degree of graphitization. As observed in Table 2, the ID/IG ratio increased with increasing annealing temperature, accompanied by an increasing level of graphitization. This is due to its numerous graphite layers by graphitization of amorphous layer in CNBs, and its feature is almost identical with the relationship of single-wall carbon nanotubes (SWCNT), double-wall CNT (DWCNT), and multiwall CNT (MWCNT) [9].
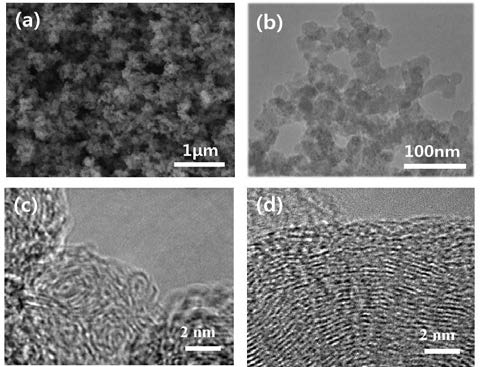
FESEM image of raw CNB (a), TEM image of raw CNB (b), HRTEM image annealed at 550 °C(c), and HRTEM image annealed at 850 °C (d)
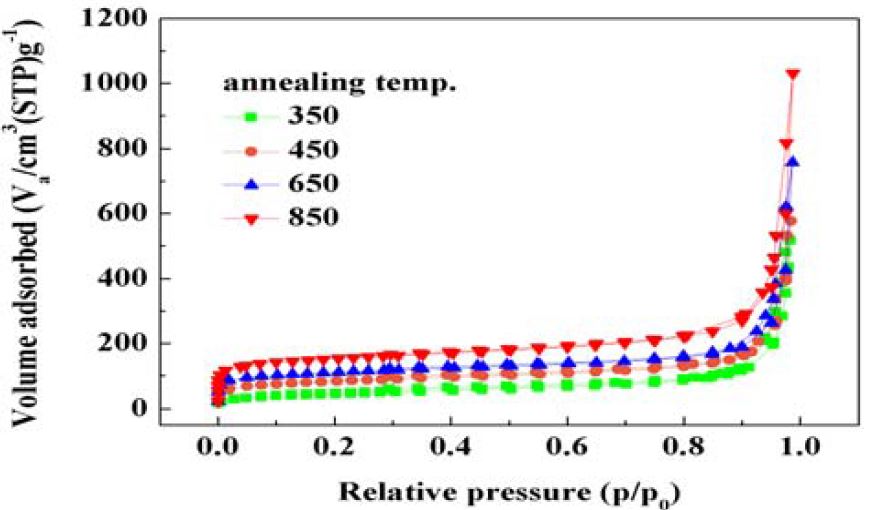
Figure 4 shows N2 adsorption-desorption isotherms of CNBs at different annealing temperatures. N2 adsorption-desorption isotherms exhibited sloping curves of the small hysteresis loop at higher relative pressure, typical to type IV isotherms. In Figure 4, the curve with small hysteresis at high relative pressure shows that the amount of N2 adsorption at capillary condensation range is very large. These features indicated that the CNBs had mesopores with very large pore volume to accommodate N2 molecular and cylindrical slit type pore structure characteristic [10][11]. In comparison, the N2 adsorption-desorption amount of CNBs considerably increased with the increasing annealing temperature, regardless of low or high
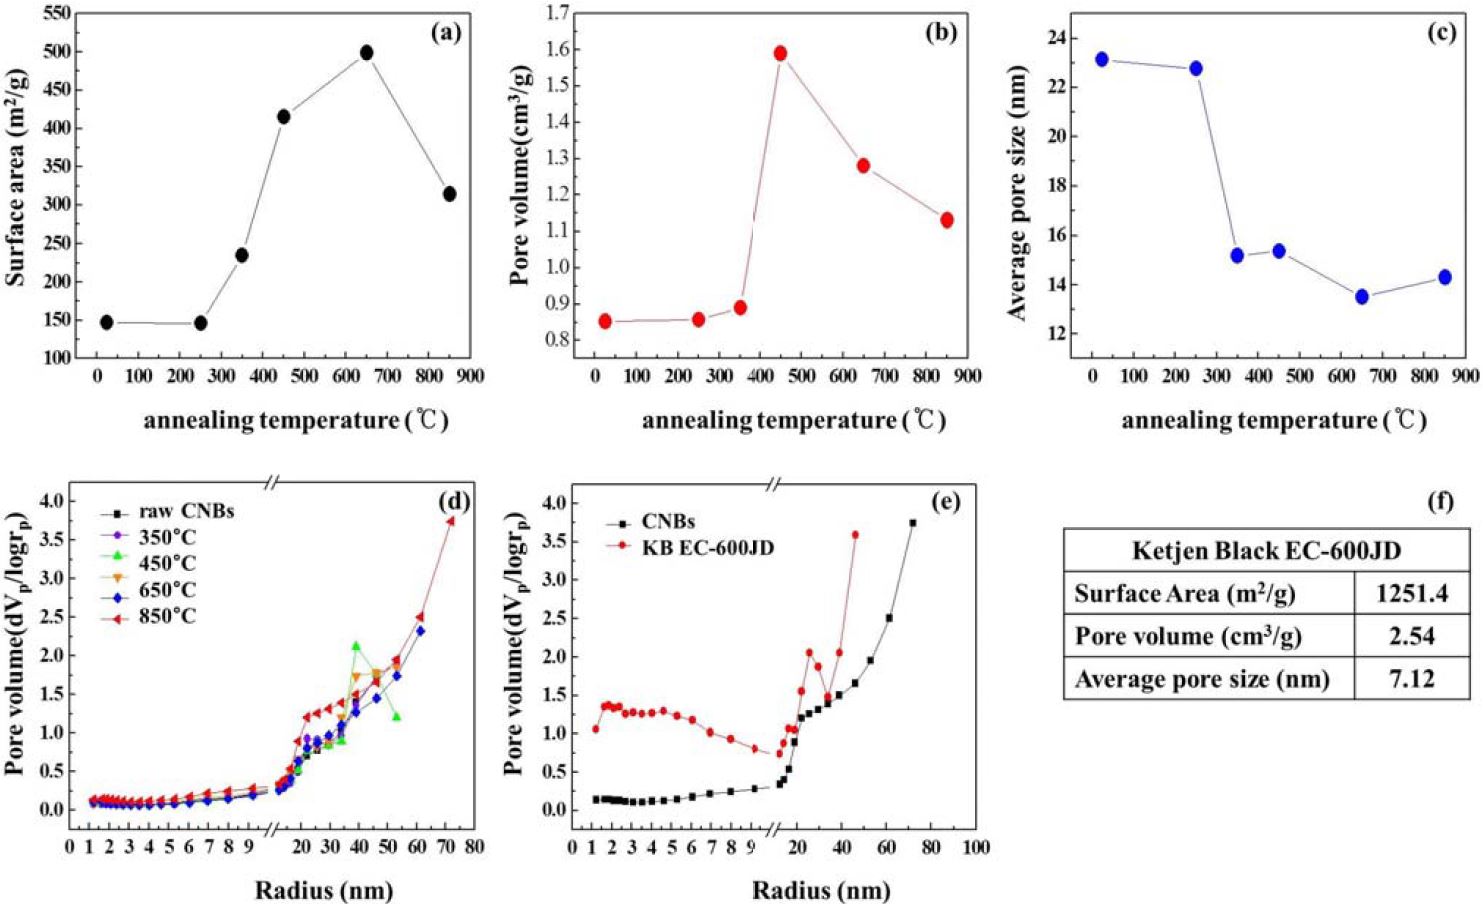
The structural parameters of CNBs including the BET surface area, total pore volume, and mean pore diameter calculated using N2 adsorption-desorption isotherms are plotted in Figure 4. The BET surface area and total pore volume of the CNBs before annealing were calculated to be 120 m2g-1 and 0.85 cm3g-1, respectively. After annealing at 200 °C to 450 °C, the BET surface area and total pore volume increased from 120 to 500 m2g-1, and 0.85 to 1.6 cm3g-1, respectively. The increments in the BET surface area and total pore volume were proportional to the annealing temperature up to 450 °C, which influenced the dehydrogenation of the CNBs. A decrease in BET surface area and pore diameter were observed at 650 °C to 850 °C. The values for these two properties might have decreased because the blind pores in the network structure were sealed and, hence, were not accessible by graphitization of the CNB network structure. However, the BET surface area, pore diameter, and pore volume were still significantly high.
The mesopore size distribution curves of the CNBs were calculated using the Barrett–Joyner–Halenda (BJH) method (desorption leg), which takes into account capillary condensation in the pores using the Kelvin equation, as shown in part (d) and (e) of Figure 5. The properties of Ketjen Black 600jd are shown in Figure 5 (f) for comparison, which is commonly used for the electrode material in current Li-air batteries. According to the pore size distribution curve, CNBs have a broad pore size distribution of more than 10 nm in diameter with a large mesopore volume. Ketjen black has a broad pore size distribution, but it is less than 10 nm in diameter, and contains a large quantity of micropores. These facts indicate that CNBs consist of a hierarchical mesopore structure. This hierarchical structure is expected to be useful for oxygen diffusion, and can accommodate Li oxide. These properties are expected because the existence of large textural mesopores more than 10 nm in diameter can facilitate the diffusion of Li and oxygen inside the pore channels to reach efficiently Li oxide accommodation sites. Mesopores less than 10 nm in diameter are easily clogged by Li oxide.
4. Conclusions
Large quantities of CNBs were synthesized by the SPP from benzene solution. This process is a simple, fast, efficient, and economical method for large-scale synthesis of carbon nanoball materials. The structural characteristics showed that the synthesized CNBs have an optimum meso-macro hierarchical pore structure, with an average pore diameter of more than 10 nm, and a total pore volume of more than 1.00 cm3 g-1. BET and BJH results showed that the synthesized CNBs have a potential to serve as anode materials for lithium-air batteries.
Acknowledgments
This study was supported by 2014 Korea Maritime & Ocean University research grant for new faculty.
References
-
J. H. Jang, J. S. Oh, "The study on a ship energy management system applied rechargeable battery", Journal of the Korean Society of Marine Engineering, 38(2), p202-207, (2014).
[https://doi.org/10.5916/jkosme.2014.38.2.202]

- R. C. Bansal, J. B. Donnet, and F. Stoeckli, Active Carbon, Marcel Dekker, New York, (1988).
-
H. Marsh, and B. Rand, “The process of activation of carbons by gasification with CO2-II. The role of catalytic impurities”, Carbon, 9, p63-72, (1971).
[https://doi.org/10.1016/0008-6223(71)90144-8]

-
R. W. Pekala, and J. Non-Cryst, “Aerogels derived from multifunctional organic monomers”, Solids, 145, p90-98, (1992).
[https://doi.org/10.1016/s0022-3093(05)80436-3]

-
H. Tamon, H. Ishizaka, T. Yamamoto, and T. Suzuki, “Influence of freeze-drying conditions on the mesoporosity of organic gels as carbon precursors”, Carbon, 38, p1099-1105, (2000).
[https://doi.org/10.1016/S0008-6223(99)00235-3]

-
J. H. Knox, B. Kaur, G. R. Millward, and J. Chromatogr, “Structure and performance of porous graphitic carbon in liquid chromatography”, Journal of Chromatography, 352, p3-25, (1986).
[https://doi.org/10.1016/S0021-9673(01)83368-9]

-
T. Kyotani, “Control of pore structure in carbon”, Carbon, 38(2), p269-286, (2000).
[https://doi.org/10.1016/S0008-6223(99)00142-6]

-
R. Ryoo, S. H. Joo, M. Kruk, M. Jaroniec, “Ordered mesoporous carbons”, ADVANCED MATERIALS, 13(9), p677-681, (2001).
[https://doi.org/10.1002/1521-4095(200105)13:9<677::AID-ADMA677>3.0.CO;2-C]

-
M. A. Short, P. L. Warlker Jr, “Measurement of interlayer spacings and crystal sizes in turbostratic carbons”, Carbon, 1(1), p3-9, (1963).
[https://doi.org/10.1016/0008-6223(63)90003-4]

- S. COSTA, E. BOROWIAK-PALEN, M. KRUSZYŃSKA, A. BACHMATIUK, R. J. KALEŃCZUK, “Characterization of carbon nanotubes by Raman spectroscopy”, Materials Science-Poland, 26(2), p433-441, (2008).
-
H. M. Kao, T. Y. Shen, J. D. Wu, and L. P. Lee, “Control of ordered structure and morphology of cubic mesoporous silica SBA-1 via direct synthesis of thiol-functionalization”, Microporous and Mesoporous Materials, 110(2-3), p461-471, (2008).
[https://doi.org/10.1016/j.micromeso.2007.06.035]

-
Y. Wang, S. Zhu, Y. Mai, Y. Zhou, X. Zhu, and D. Yan, “Control of pore size in mesoporous silica templated by a multiarm hyperbranched copolyether in water and cosolvent”, Microporous and Mesoporous Materials, 114(1-3), p222-228, (2008).
[https://doi.org/10.1016/j.micromeso.2008.01.006]


