Analysis of the experimental cooling performance of a high-power light-emitting diode package with a modified crevice-type vapor chamber heat pipe
Copyright ⓒ The Korean Society of Marine Engineering
This is an Open Access article distributed under the terms of the Creative Commons Attribution Non-Commercial License (http://creativecommons.org/licenses/by-nc/3.0), which permits unrestricted non-commercial use, distribution, and reproduction in any medium, provided the original work is properly cited.
Abstract
The experimental analysis of a crevice-type vapor chamber heat pipe (CVCHP) is investigated. The heat source of the CVCHP is a high-power light-emitting diode (LED). The CVCHP, which exhibits a bubble pumping effect, is used for heat dissipation in a high-heat-flux system. The working fluid is R-141b, and its charging ratio was set at 60 vol.% of the vapor chamber in a heat pipe. The total thermal conductivity of the falling-liquid-film-type model, which was a modified model, was 24% larger than that of the conventional model in the LED package. Flow visualization results indicated that bubbles grew larger as they combined. These combined bubbles pushed the working fluid to the top, partially wetting the heat-transfer area. The thermal resistance between the vapor chamber and tube in the modified design decreased by approximately 32%. The overall results demonstrated the better heat dissipation upon cooling of the high-power LED package.
Keywords:
Crevice-type vapor chamber heat pipe, LEDs, Heat dissipation1. Introduction
High-power light-emitting diodes (LEDs) are attracting attention as next-generation light sources because of their long lifespan, fast response speed, and low power consumption compared with similar-powered lighting systems [1]. LEDs convert only 15% of applied energy into light, and the remaining 85% energy is emitted as heat. This released heat degrades the performance of LEDs and their package, shortening their lifespan and causing LED performance failure. Therefore, the development of an appropriate cooling system for an LED package is critical issue. A heat pipe for heat dissipation control is used as the cooling method for high-power LED systems [2]. Many heat-dissipation studies have been conducted using heat pipes with simple structures, large heat transport capacities, and fast thermoresponses [3]. The conventional vapor chamber of heat pipes is mainly installed in the horizontal direction. Vertical installation is also applied for vehicle head-lights and searchlights. The cooling performance for a vehicle LED headlamp using a crevice-type vapor chamber heat pipe (CVCHP) was analyzed [4], and the LED chip temperature was maintained below 85°C for all the test conditions [5].
In the present study, an experimental analysis of the cooling performance in a high-power vehicle LED package was conducted. In a horizontal directional heat pipe of a headlamp LED panel, a prism can be used to obtain an appropriate directional light. However, a CVCHP with a falling-film-type geometry design in a vapor chamber was applied to the LED chips, which were mounted in a vertical direction. The stable thermal performance and thermal resistance network with this modified design were analyzed. In addition, visualization using a high-speed digital camera was used to determine the internal heat-transfer characteristics of the CVCHP.
2. Experimental equipment and procedure
2.1 Experimental setup
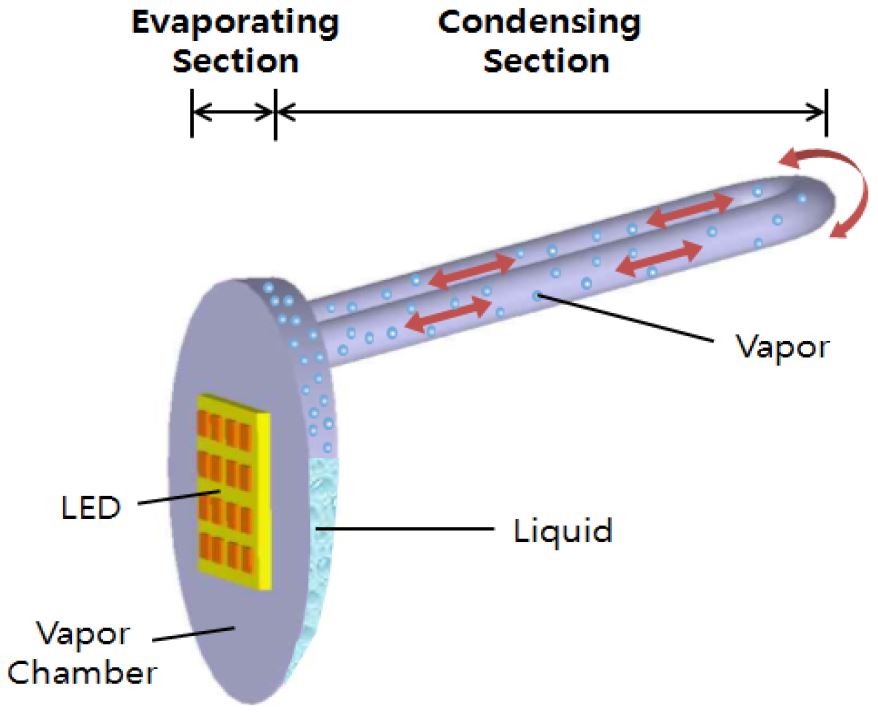
Figure 1 presents a schematic diagram of the CVCHP with an LED module. The LED case and printed circuit board (PCB) are positioned in a vertical direction. To remove heat generated by an LED system, the CVCHP was attached as illustrated in Figure 1. The cooling system consists of a vertical vapor chamber and a U-shaped tube, which functioned as an evaporator and condensing section of the heat pipe. The vapor chamber was designed with an inverted triangle shape to rapidly reach the heat-transfer area level. When the working fluid is vaporized, the volume of the working fluid will dramatically increase. This shape accounts for this expansion factor. The tube was manufactured in a U-shape to prevent flooding phenomena.
In addition, flat fins were attached to the tube to enlarge the heat-transfer area. LEDs were attached to the front of the vapor chamber as a vehicle headlamp application. The heat is emitted from the LEDs, which are attached to the vertical vapor chamber with the vaporized working fluid. After cooling and condensing through the tube, the vaporized working fluid returns to the chamber. The condensing section releases heat to the outside by repeating this process. The specifications of the heat pipe used in this experiment are listed in Table 1. R-141b was used as the working fluid to account for the operating temperature and pressure resistance of the vapor chamber. The optimal charging rate of the working fluid was determined by preceding research [6].
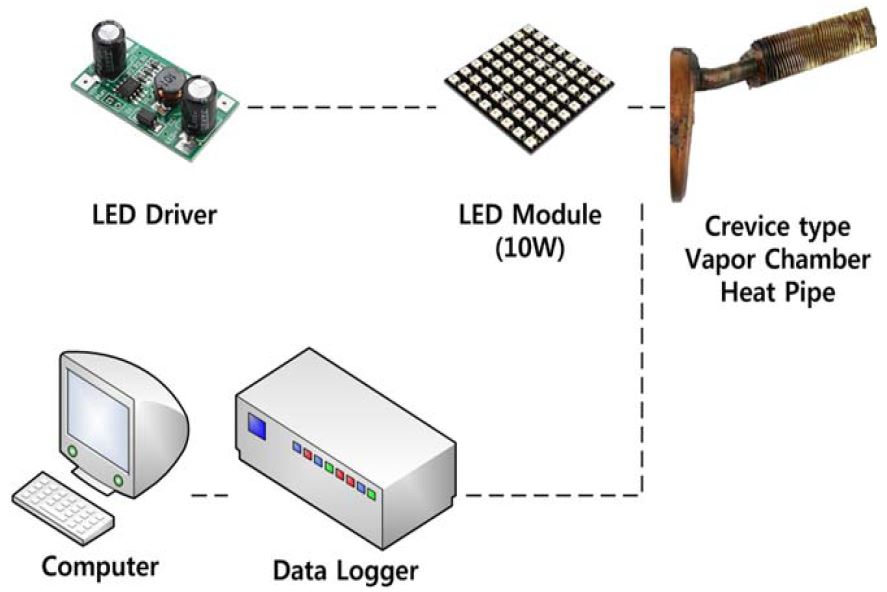
The experimental components were installed as shown in Figure 2. An LED module and LED driver were used as parts of a commercial LED bulb (LED bulb - 800lm, 6500K E26, Philips). The power of the LEDs was directly supplied to the vertical surface of a vapor chamber. A K-type thermocouple was used to measure the temperature at every component point, and temperature data were recorded at 1-sec intervals using a data logger (GL800, Graptec).
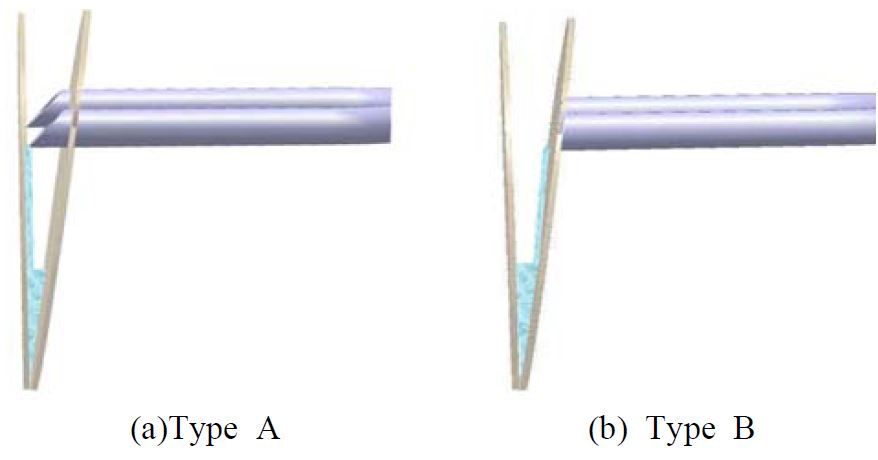
Figure 3 shows the internal structure of the CVCHP. Type A is the falling-liquid-film formation model that induces the formation of a falling liquid film via insertion of a tube into the heat-transfer area, and Type B is a conventional model. The modified design Type A is suggested to achieve better cooling performance for a CVCHP. The LED chip, PCB, vapor chamber, top and bottom of the tube, fin, and outdoor air temperatures were measured [7].
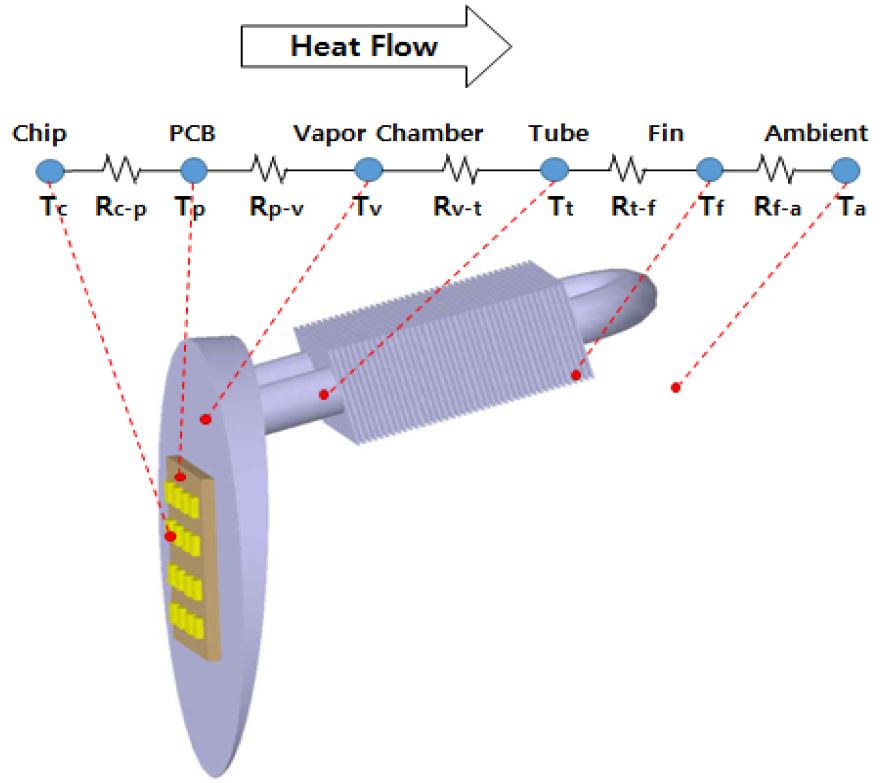
Figure 4 shows the positions of the thermocouples for the LED chips, PCB, vapor chamber, tube, fins, and ambient section of the condensing section. These locations were selected to determine the heat flow characteristics at each point. In the upper section of Figure 4, the thermal resistance network is shown to help illustrate the heat flow patterns.
2.2 Visualization setup
The specifications of the CVCHP for visualization are listed in Table 2. To observe the internal flow patterns of the vapor chamber, quartz glass was used for the outside surface plate, which was manufactured using the specifications listed in Table 2.
To observe the internal flow patterns upon changing the heat flux, a plate-shaped electric heater was attached to the front of the vapor chamber, and the input power was varied from 5 to 15 W using a voltage regulator and power meter.
The backside images of the vapor chamber were taken in 3 sec at 400 fps using a high-speed digital camera to help visualize the internal flow patterns.
3. Results and discussion
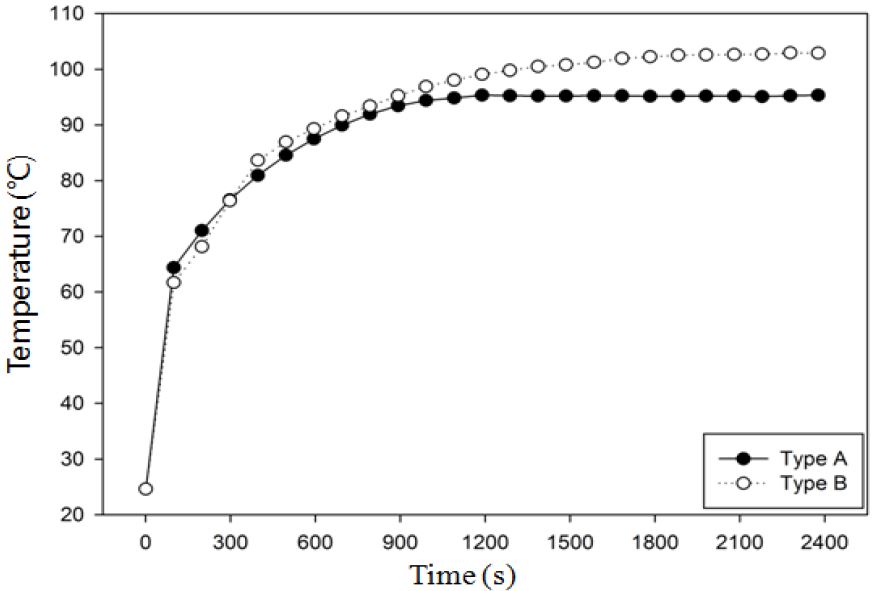
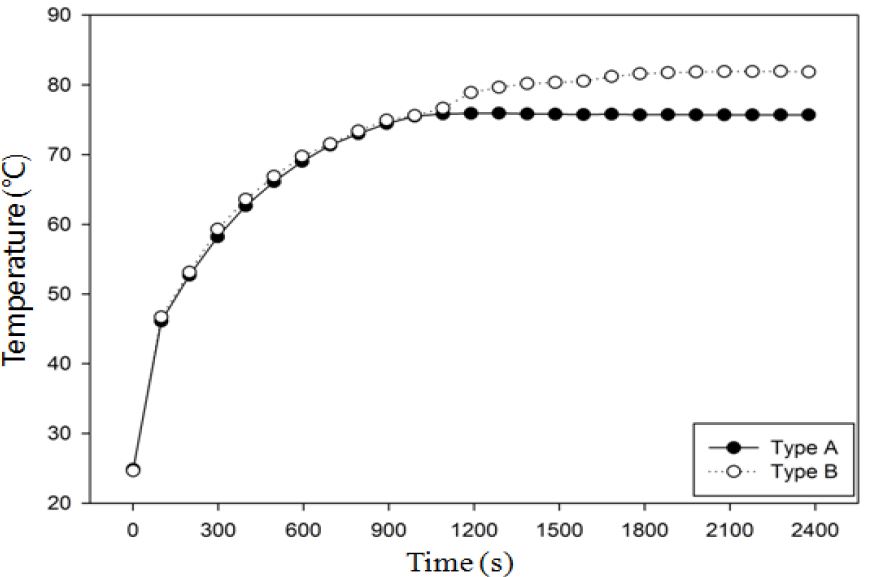
Figure 5 shows the temperature variation of the LED chips of the falling-liquid-film formation model (Type A), which is a modified model, and the conventional model (Type B). For both cases, the temperatures remain constant after 1100 sec. However, the temperature for the conventional case slowly increases more even though Type A maintains a constant-temperature profile. Figure 6 presents the temperature profiles of the PCB. The temperature profiles exhibit patterns similar to those in Figure 5.
The LED chip and PCB temperatures of the falling-liquid-film formation models are approximately 7.4°C and 6.1°C lower than those of the conventional model, respectively. These results indicate that the modified model results in better heat transfer performance than the conventional model. In addition, the model shows consistent performance after 1100 sec.
Table 3 lists the maximum temperatures of the system components from the LED chips to the ambient area of the condensing section. The modified type A shows lower temperatures than the conventional type B at the same locations.
Table 4 lists the effective thermal conductivities. The governing equation of the effective thermal conductivity is [8]
| (1) |
where Q is the heat input, and Leff is the effective length, Atube is the area of the tube section, and Tchamber and Ttube are the temperatures at corresponding locationsof the chamber and tube, respectively.
The effective thermal conductivity by based on the mean temperature difference between the tube and the chamber is was calculated by using equation (1).
The effective thermal conductivities of each type were 4175.15 W/mK and 3359.68 W/mK, respectively. The effective thermal conductivity of the modified type was approximately 24% better than that of the conventional type.
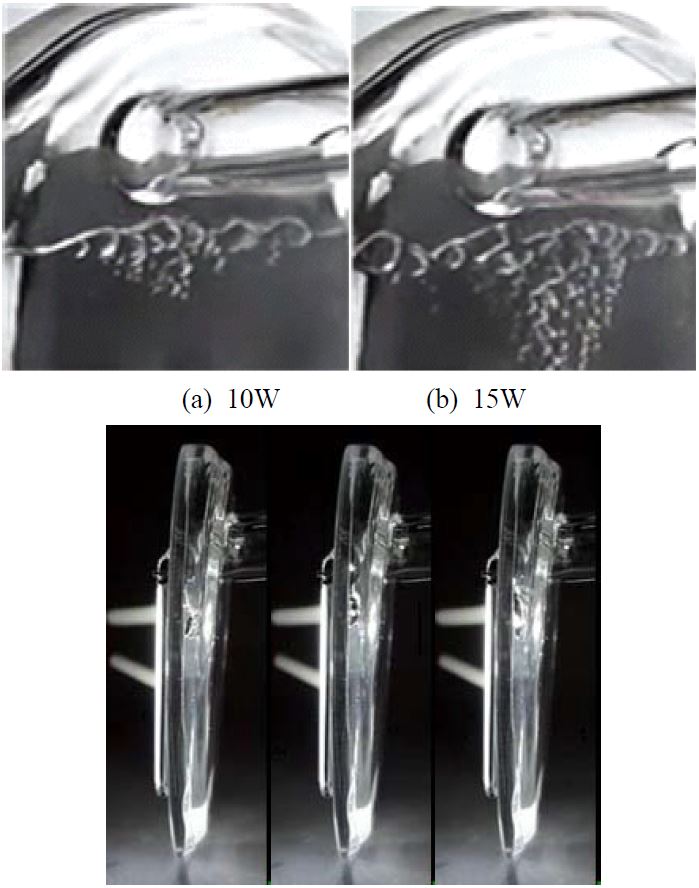
To ensure the enhanced performance of the total system, a visualization experiment was performed. Figure 6 shows the internal flow patterns at the backside of the vapor chamber for two different LED power inputs. The working fluid was used to fill 70 vol% of the vapor chamber because at 70% charging volume of the vapor chamber, the inside flow patterns are clearly show the internal vapor–liquid two-phase flow.
In the vapor chamber section, bubbles caused by a nucleate boiling in the heat-transfer area grew larger as they combined. Furthermore, at the top of the vapor chamber section, relatively large air bubbles were observed. The combined bubbles pushed the working fluid to the top, which caused the heat-transfer area to become partially wet. In the tube section, the condensed working fluid was observed to actively return into the vapor chamber. Examination of the internal flow patterns revealed that the heat flux bubbles were frequently pushing the working fluid to the top section, which indicates that the increased wetted area of heat transfer resulted in a larger heat flux.
Next, the thermal resistance network was analyzed to obtain a better understanding of the system. A detailed network description is provided at the top of Figure 4. Thermal resistance is defined as the ratio of the temperature difference to the power dissipation and the total thermal resistance, which is the sum of the individual thermal resistances. The total thermal resistance can be written as [9]
| (2) |
Table 5 lists the thermal resistance of each type. The total thermal resistance of the falling-liquid-film type A model was 7.08°C/W, which is 0.73°C/W smaller than the total thermal resistance of the standard model. Decreased heat resistance in Rp-v and Rv-t accounted for 92% of the total decreased heat resistance. Rv-t, which was directly affected by the falling liq-uid film, decreased 32% more than the thermal resistance of the standard model.
Next, a time constant representing the time required for the thermistor to respond to a change in the ambient temperature was measured. The thermal time constant was calculated using equation (3)[10].
| (3) |
Table 6 lists the thermal time constants of both types. For the LED chips, the thermal time constant of type A was 603 sec, which was a 37% faster response than that of type B. For the PCB, Type A exhibited an approximately 16% better response time than with Type B.
4. Conclusions
To analyze the cooling effects in a modified CVCHP, thermal analysis of the heat-transfer enhancement was conducted, and the following results were obtained:
(1) The LED and PCB temperatures of the modified liquid film formation (Type A) model were 7.4°C and 6.1°C lower than those of the conventional Type B model, respectively.
(2) The total thermal resistance of the modified Type A model was 0.73℃/W less than that of the standard model (Type B) The thermal resistance between the vapor chamber and tube that was directly affected by the falling liquid film decreased 32% more for the Type A model than for the standard model.
(3) Internal flow visualization results revealed that bubbles caused by a nucleate boiling in the heat-transfer area grew larger as they combined. These combined bubbles pushed the working fluid to the top, and the heat-transfer area became partially wet.
(4) The effective thermal conductivity of the Type A falling liquid film was 24% larger than that of the Type B model. For the LED chips and PCB, the thermal time constants were 603 and 276 sec, which were 37% and 20% faster for Type A than those for Type B, respectively.
The overall results demonstrated the better heat dissipation of the high-power LED package upon cooling.
Nomenclature
| Rc-p : | Thermal resistance between LED chips and PCB (℃/W) |
| Rp-v : | Thermal resistance between PCB and Vapor chamber (℃/W) |
| Rv-t : | Thermal resistance between Vapor chamber and tube(℃/W) |
| Rt-f : | Thermal resistance between tube and fin (℃/W) |
| Rf-a : | Thermal resistance between fin and outside air (℃/W) |
| Rtotal : | The sum of the individual thermal resistances(℃/W) |
| △Ttotal : | The sum of the individual temperature differences (℃) |
| Pd : | Individual power dissipation (W) |
| keff : | Effective thermal conductivity (W/mk) |
| Leff : | Effective length (m) |
| : | Thermal constant time(s) |
Acknowledgments
“This work was supported by a Research Grant of Pukyong National University (2014 year)”
References
- J. Hu, L. Yang, and M. Shing, “Thermal and mechanical analysis of high-power LEDs with ceramic packages”, IEEE Transactions, p297-303, (2008), (in Korean).
-
I. Kim, J. H. Choi, and S. H. Jang, “Thermal analyssis of LED array system with heat pipe”, Thermochim, Acta, 455(1-2), p21-25, (2007), (in Korean).
[https://doi.org/10.1016/j.tca.2006.11.031]

-
Y. Tang, X. Ding, B. Yu, Z. Li, and B. Liu, “A high power LED divice with chips directly mounted on heat pipes”, Applied Thermal Engineering, 66(1-2), (2014).
[https://doi.org/10.1016/j.applthermaleng.2014.02.067]

- J. W. Yeo, Development of Cooling System for Automobile LED Headlamp using Heat Pipe with Crevice Type Vapor Chamber, M.S Thesis, Department of Refrigeration and Air-Conditioning Engineering, Pukyong National University, Busan, (2012), (in Korean).
- J. W. Yeo, S. J. Ha, and J. S. Kim, “LED headlamp cooling performance using crevice type vapor chamber”, Proceedings of SAREK, p343-346, (2011), (in Korean).
- J. Heo, S. J. Ha, and J. S. Kim, “Study on the development of high-efficiency heat dissipation device using vapor chamber type heat pipe for ships and offshore plants”, Proceedings of the Korean Society of Mechanical Engineers, p231-235, (2013), (in Korean).
- B. D. Kang, K. S. Park, B. J. Young, and H. G. Kim, “Evaluation of fule consumption between LED headlamp and halogen headlamp”, KSAE 2009 Annual Conference, p1709-1714, (2009), (in Korean).
-
M. S. Ko, J. H. Lee, S. J. Oh, H. S. Cho, and T. B. Seo, “Cooling performance of LED head lamp with heat sink and cooling fan”, Transactions of the Korean Society of Mechanical Engineers B, 33(12), p947-951, (2009), (in Korean).
[https://doi.org/10.3795/KSME-B.2009.33.12.947]

- D. A. Ready, P. A. Kew, Heat pipes, Butterworth Heinemann, 5th ed, (2015).
- K. S. Gam, “Characteristics variation of thermal time constant of thermocouples by the structure changes”, Journal of the Korean Sensors Society, 18(2), p103-109, (2009), (in Korean).

