Measurement of local wind and solar radiation for a hybrid power generation system design, Busan, Korea
As a first step to develop the hybrid power generation system, on this study, the time-variable resources of wind and solar radiation of Yeongdo, Busan, Korea had been measured during June and July 2013. And the quantity of generated wind power and solar photovoltaic had also been measured during the same period. It is found out that the wind mainly flew from southwest at the average speed of 2 m/s during 2 months. And it is clear that, because of the low wind velocity, the wind quality to generate the power seems not enough at this area. Meanwhile solar radiation was measured every daytime (6:00~19:00) and the peak solar radiation occurred around 12:00~14:00. And it is clear that the time-based variations of quantity of generated power were proportional to the variations of these resources, respectively. As a proposal, these 2 natural energies can be combined as resources of a hybrid system, because these 2 patterns are not overlapped so much on time base.
Keywords:
Renewable energy, Wind, Solar radiation, Energy resource, Hybrid power generation1. Introduction
Korean government made “Act on the Promotion of the Development, Use and Diffusion of New and Renewable energy” and enforce to new and renovation buildings of governments and those subsidiary agencies as a duty from 2004 [1], because Korea has imported more than 97% of fossil energies from overseas for decades. As the result of this act, many facilities which utilize the various renewable energies have been installed and are successfully in operation. The 3 top renewable resources to have been used are solar heat, solar photovoltaic and wind [2]. It is reported that solar heating system is normally installed in individual buildings, especially residential buildings, and the solar photovoltaic and wind power generation systems are normally being operated based on commercial profits with huge power generation capabilities per site.
But even though Korea is surrounded by ocean and there are over 3,100 islands in Korea, the voices from islands’ and coastal areas’ habitants are out of concerns for this business, because the electric loads are too small comparing to urban. And also the energy supply networks from the mainland to the islands are very simple and unique. Therefore, to make the energy supply network multiple and improve the habitants’ living conditions, it can be an option to design and install any kinds of renewable energy facilities on these areas. Because the islands and coastal areas are fully exposed to nature, the conditions of wind and solar are evaluated as better qualities than elsewhere and very good to introduce the facilities.
On the other hand, the time-based variations of wind and solar radiation cannot be predicted and the patterns of 2 resources are quite different [3], so the hybrid power generation system will be a good proposal.
The purpose of this case study is to build up a set of database of wind and solar radiation, which will be used for hybrid power generation system design. To build up a set of the database and estimate the effectiveness, not only the wind and solar radiation resources but also the power generation quantities are measured, respectively.
2. Measurement methodology
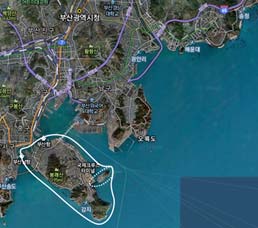
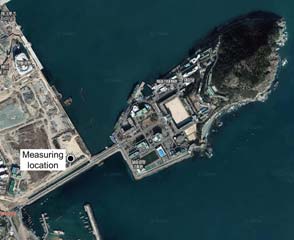
Although Yeongdo is a district of Busan metropolitan, Korea, she is an island connected with mainland with only 3 bridges as shown in Figure 1. Figure 2 shows the location where the measurement equipment is located, where is 2nd campus of Korea Maritime and Ocean University (hereafter, abbreviated as KMOU). This place is selected because there are no obstacles like buildings or artificial structures around the equipment, as partially shown in Figure 4.
From June to July of 2013, the measurement was conducted. The following items were measured by 1 minute intervals.
- Outdoor weather conditions: dry temperature, relative humidity, rainfall etc.
- Renewable energy resources: wind, solar radiation
- Generated power: wind power, solar photovoltaic
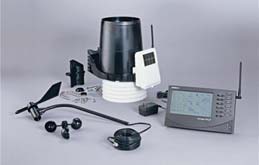
As the wind and solar radiation is seriously and mutually affected by the outdoor weather conditions, the outdoor weather conditions were also measured on real time base. To monitor and get the outdoor weather conditions, wind and solar radiation, Vantage pro2 Weather Stations [5] was used.
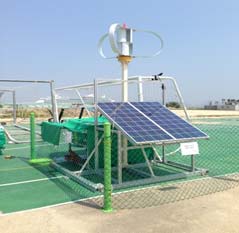
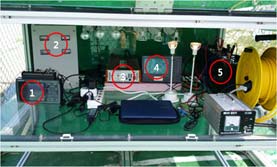
The hybrid power generation system for experiment is installed the above mentioned place as shown in Figure 4 and Figure 5. The circled numbers in Figure 5 represents ①Data Acquisition (Graphtec GL820), ②Control panel, ③Inverter, ④Weather monitor, ⑤Storage battery.
The hybrid power generation system has totally 660W capacity, which consists of 2 units of 130W solar photovoltaic and 300W wind turbine. The single unit of solar photovoltaic weights 12.3kg and 1,500mm×680mm×38mm size, and it has 36 cells in 49 matrix connected in series. The rated voltage of the wind turbine is 12/24volts (selectable option). The wind turbine has 3 blades of which the rotating diameter is 1,200mm and starts up from 1.5 m/s at least.
The generated power, voltage and current of wind power and solar photovoltaic are monitored by data acquisition system after transformed by the inverter, respectively.
3. Measurement results and analysis
3.1 Outdoor conditions
During the 2 months, June and July 2011, the outdoor weather conditions can be summarized like Table 1. Even though it was summer, because there were always winds from the ocean, the average temperature was low. And because the measuring place is located approximately only 30m away from the ocean, the average relative humidity was so high. Table 1 also shows that there were totally 209mm rainfalls during 20 days through the 2 months.
3.2 Wind and solar radiation
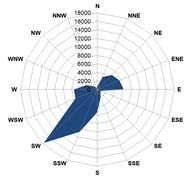
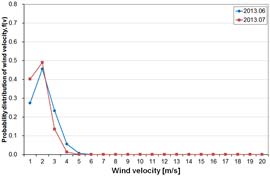
Figure 6 is the wind rose during the June and July 2013, and Figure 7 is the curve of Weibull probability distribution of wind velocity. From Figure 6 it is clear that the wind flew mainly from southwest and Figure 7 explains that the major wind velocity was 2m/s.
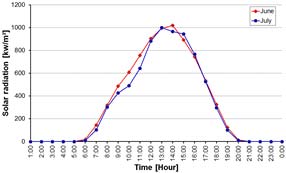
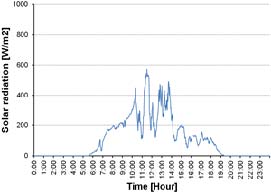
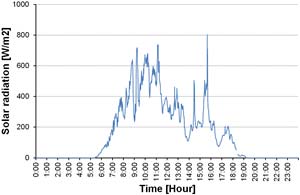
The solar radiation varied on time base as shown in Figure 8. The value of y axis of Figure 8 is integrated solar radiation at the same time through the 2 months. The maximum solar radiation appeared around 12:00~14:00 o’clock.
3.3 Wind power and solar photovoltaic
Normally, the power of wind turbine can be calculated by Equation (1), which comes from the turbine affected by dynamic coefficient [6]. This equation means the capacity of wind power is proportional to the cube of wind velocity.
Where Cp is ratio of dynamic coefficient, p is density of air, u0 is wind velocity of upper section of turbine and AT is cross sectional area of rotating turbine.
Hourly Pwind(t) can be expressed as function of u0 which varies on every moments, because Cp, p, AT are constant. So Equation (1) can be changed like Equation (2).
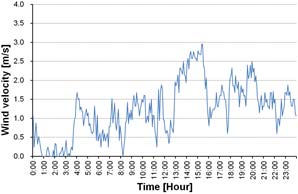
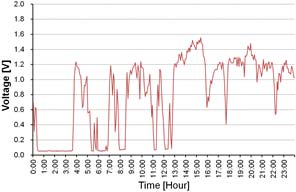
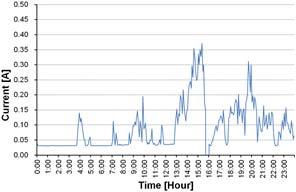
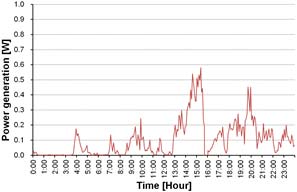
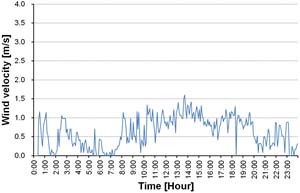
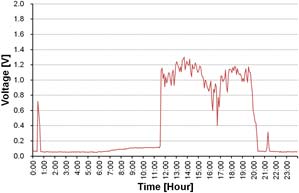
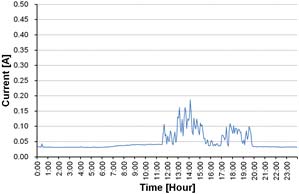
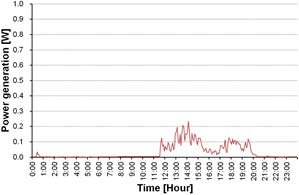
The characteristics of wind power generation were measured simultaneously with variables of wind velocity, current, voltage. The quantity of wind power generation is calculated from these variables. Figure 9 ~ Figure 16 are some results of wind power generation on 23rd and 27th June. Figure 9 and Figure 11, Figure 13 and Figure 16 show respectively that the patterns of time-related variations of wind velocity and power generation are very similar, but that a minimum wind velocity is required. The currents and voltages are varied as shown on Figure 10 and Figure 11, Figure 14 and Figure 15 The average voltage is evaluated as 1.2V and the maximum current is 0.35A, when the turbine is on operation.
On the other hand, the output of solar photovoltaic can be calculated by Equation (3), which explains the power output is proportional to solar radiation [6].
Where ∈ is efficiency of energy transformation, A is a unit area of solar cell, and Gon is normal direction incidence solar radiation.
As hourly solar photovoltaic, Psalar(t) is proportional to hourly solar radiation, Gon(t), Equation (3) can be expressed like Equation (4).
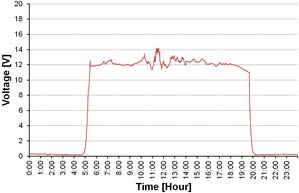
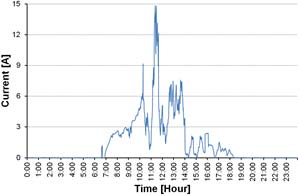
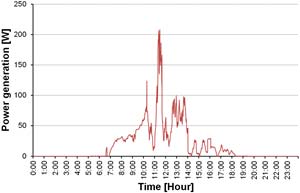
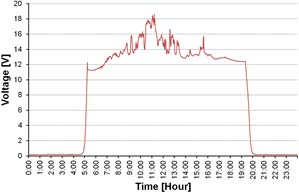
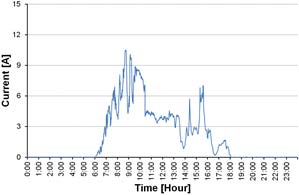
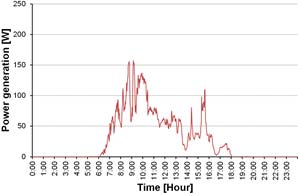
The characteristics of solar photovoltaic were measured simultaneously with variables of solar radiation, current, voltage, for the purpose of the calculation of the quantity of solar photovoltaic. Figure 17 ~ Figure 24 are some results of solar photovoltaic on 23rd and 27th June. Figure 17 and Figure 20, Figure 21 and Figure 24 show respectively that the patterns of time-related variations of solar radiation and power generation are very similar. The currents and voltages are varied as shown on Figure 18 and Figure 19, Figure 22 and Figure 23. The minimum voltage is 12V and the current varies up to 18.5A during the turbine is on operation.
4. Conclusions
The purpose of this case study is to build up a set of database of energy resources, especially focused on the wind and the solar radiation, for the first step to be used as a hybrid power generation system design. Some results from this study can be summarized as followings.
1) The wind mainly flows from southwest and at the average speed of 2 m/s during June and July 2013. Because the wind velocity was low, the wind quality to generate the power seems not so good at this island.
2) Solar radiation was measured every day time (6:00~19:00) and the peak solar radiation occurred around 12:00~14:00.
3) It is clear that the quantity of wind power generation vs. wind velocity, the quantity of solar photovoltaic vs. solar radiation were proportional each other, respectively.
4) The patterns of each power generation are very different. This means that these 2 natural energies can be combined as sources of a hybrid system, because these 2 patterns are not overlapped so much on time base.
Acknowledgments
This work was supported by the National Research Foundation of Korea(NRF) grant funded by the Korean Government(MSIP)(2010-0025312). And also this work is the outcome of Manpower Development Program for Marine Energy by the Ministry of Oceans and Fisheries
Notes
References
- Ministry of Government Legislation, Act on the promotion of the development, use and diffusion of new and renewable energy, Republic of Korea, Amended by Act No. 10253, April, 12), (2010.
- Korea Energy Management Corporation, New & Renewable Energy Statistics 2011 (2012 Edition), (2012), (in Korean).
-
K. I. Hwang, “Measurement of wind and solar radiation for energy resources survey on islands around Namhae-Tongyoung, Korea”, Journal of Korean Navigation and Port Research, 37(1), p79-84, (2013), (in Korean).
[https://doi.org/10.5394/KINPR.2013.37.1.79]

- Daum, http://map.daum.net, Accessed September 23, (2013).
- Davis Instrument(2010), Integrated sensor suite installation manual for Vantage Pro2 and Vantage Pro2 Plus Weather Station, Nov), (2009.
- J. H. Jang, Renewable Energy Engineering, GS Intervision, (2010), (in Korean).
-
K. B. Han, and H. W. Lee, “The research of the hybrid power generation using ocean wave”, Journal of the Korean Society of Marine Engineering, 35(6), p861-866, (2011), (in Korean).
[https://doi.org/10.5916/jkosme.2011.35.6.861]

