A study on measurement of particulate matter, nitrogen oxide and carbon oxide from main engine in training ship
In this study, we have carried out measurement for exhaust emissions such as particulate matter (PM), nitrogen oxide and carbon oxide from main engines installed on the training ships, HANBADA and HANNARA, of Korea Maritime University. In particular, we considered the two conditions; at arrivals/departures and at constant speed of about 160 rpm. The result showed that the concentration of PM at the ship arrival was 2.41mg/ m3. On the other hand, when the ship is on the navigation condition, the concentration of PM was 1.34 mg/m3. The concentrations of nitrogen oxide and carbon oxide were measured in the range of 1,120∼1,600 ppm and 320∼1,450 ppm at the arrival and departure at the port. Under constant speed condition, the concentrations of nitrogen oxide and carbon oxide were 913∼1,470 ppm and 73∼460 ppm, respectively. Generally, the concentrations of exhaust emissions under the arrivals and departures were higher than that of constant speed condition. These results imply that the ship operation skill to prevent a sudden load change of main engine is needed during the arrival or departure. In addition, it means that the difference of exhaust emissions according to navigation conditions has to be considered when the reduction technologies of air pollutants from ships are developed.
Keywords:
Air Pollutants, Particulate Matter, Carbon Dioxide, Nitrogen Oxide, Reduction Technology1. Introduction
Based on Kyoto Protocol, air pollutants emission from marine machinery is discussed on MEPC (Marine Environment Protection Committee) of IMO (International Maritime Organization) [1]. The details for air pollutant emission regulations were mentioned on the UNCLOS (United Nations Convention on the Law of the Sea) for the first time and were organized by the enactment of MARPOL Annex Ⅵ on IMO, and finally air pollutant emissions were designated regulation substances by the Montreal Protocol [2][3].
Black carbon (BC) in a kind of PM (Particulate matters), as a powerful argument material of Global warming and climate change, was considered important matters and technology research about BC impact were issued [4]. Based on the results of these studies, many researchers identified harmful emissions from PM and BC discharged by operating ship and the discussions for emission regulations were accelerated by MEOC of IMO as the center [5]-[8]. Thus, emission regulations of air pollutions and PM or BC discharged by operating ship are expected to be enhanced, and countermeasures are urgently needed.
But, the studies, such as identifications for creation process of PM/BC and generation technologies for reduction process, are insufficiency. And the researches of the measurement and analysis for air pollutantsand PM emissions are extremely limited [9][10]. Therefore, respond to the emissions regulations for air pollutants and PM/BC discharged by operating ship should be needed, and devices developments of reduction process and certifications are important.
In this study, we measured and analyzed the air pollutants, such as NOx and CO in case that the load change is large during the arrival/departure and constant speed of ship maintains at normal sailing using HANBADA and NANARA, the Korea Maritime University training ship. In addition, emission measurement of PM was investigated according to operating conditions of the training ship and ratio of fuel oil.
2. Measurement Methods
2.1. Measurement summary
NOx and CO concentration, pollutants contained in the exhaust gas generated from the main engines of HANBADA training ship, were measured and analyzed at the arrival and departure and at constant speed. Also, PM emission made by main engine of HANBADA training ship was investigated according to operating condition and fuel types.
The general particulars for the training ship of HANBADA and HANNARA are presented in Table 1.
And, in Table 2, we organized some information, such as actual flight schedule to obtain NOx and CO data, sampling position of main engine for exhaust gas, fuel type used main engine, and bunker specification.
We perform these measurements in good weather condition for HANBADA training ship but in poor condition for HANNARA training ship. The PM emission of HANBADA was measured on BUSAN KMU port with the purpose of ULSAN voyage in November 6, 2012, and sampling position of main engine for exhaust gas is economizer top hole.
2.2 Measurement condition
In order to measure the concentration of NOx and CO emission generated from main engines in real time, PG-250A(HORIBA Corp., Japan) was used [11][12]. The measuring time is 1,800s at entry into port/departure, and 120 minutes at normal sailing progress.
PM emission was measured using DSP-507M Iso-kinetic Sampling System(DOOIL Corp., Korea) [13]. We collected the samples during 900s at different experimental conditions and calculated the emissions amount based on professional organization certificate.
3. Results and discussions
3.1. Emission of Air pollutants
We installed the probe to turbine outlet side of main engine turbo charger and presented NOx/CO concentration with different PRM of main engine.
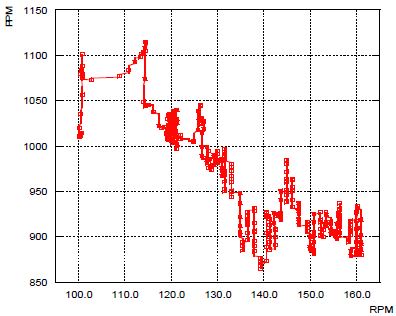
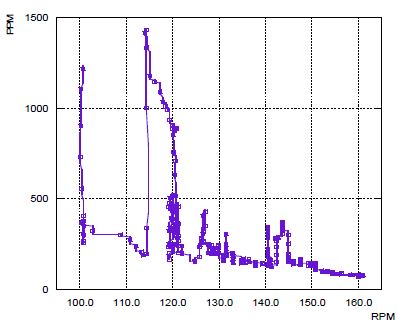
As shown in Figure 1 and Figure 2, NOx/ CO concentration were presented with different RPM of main engine at the port of entry or departure. The concentration changes of NOx are appeared at the range 100~120 RPM due to frequent main engine start/ stop motions and the maximum concentration is 1,450 ppm. Here, the different of NOx/CO concentration are observed at same RPM because change of RPM is recorded in real time but concentration is recorded after analysis.
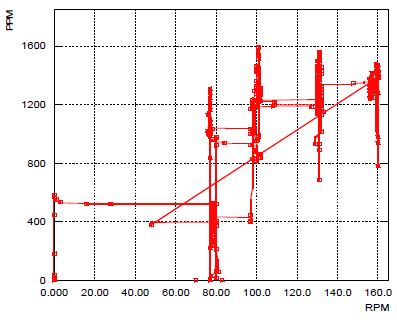
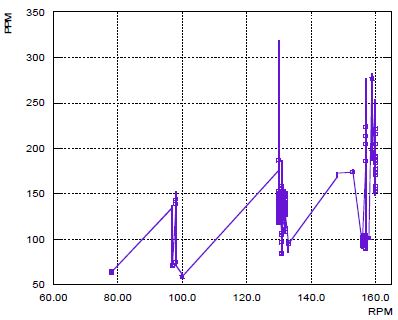
As presented in Figure 3 and Figure 4, NOx/CO concentrations are presented with different RPM of main engine at port entry or departure of HANNARA training ship. In Figure 3, the distributions of NOx concentration are variously appeared near the 80,100,130 RPM and the maximum concentration is 1,600 ppm. Also, the concentration ranges of CO are various near 120 ~140 RPM and the maximum concentration is 320 ppm.
The concentration distributions of NOx/CO are larger than HANBADA case and the width of changes is varieties according to RPM. These results attribute to some reasons, such as poor weather condition during measuring time, and rubber to escape harbour limit/ main engine condition.
In other words, the output is hard to remain according to the RPM of main engine and its values changes depending on load change in spite of same RPM. And, to follow instruction output, the fuel and air largely changes and it affects the combustion condition. Therefore, the concentration distribution of NOx/CO is expected to appear in various ways.
In actual measuring results, the concentration distributions of NOx/CO are continuous with frequencies to do/stop for main engine motions at the port of entry or departure, and the rates of load changes of main engine.
To control and reduce the concentration of NOx/CO emission, we identify that sophisticated main engine operating skills are required and abstinence of sudden load changes for main engine is essential. In addition, to response to the enhanced air pollutants regulations, it is important that amount of exhaust gas reduces at entry or departure. The most appropriate technology equipment should be applied based on actual emission characteristics identified through this study.
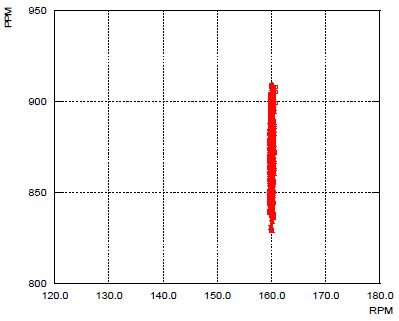
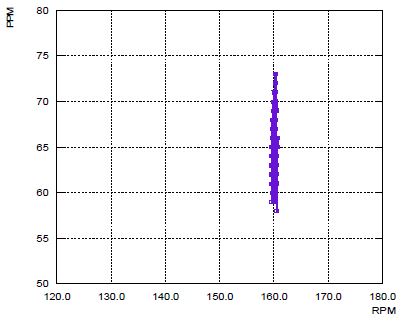
In Figure 5 and Figure 6, the concentrations of NOx/CO are presented at the normal sailing after getting out of Harbour limit and maintaining 160 RPM for HANBADA training ship. The concentration range of NOx is from 830 ppm to 913 ppm and CO is from 58 ppm to 73 ppm. This is very low level compared to concentration at the input/departure.
The load change of main engine is scarcely observed due to good weather conditions and combustion of fuel oil is shown favorable because ship’s speed and main engine output maintain high state. The good combustion of fuel oil helps that the exhaust gases on the high temperature increase efficiency of turbo charger and good scavenging. Eventually good combustion state is expected by all of these.
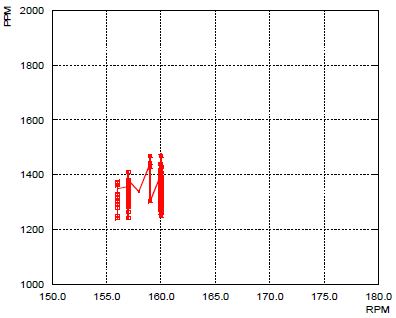
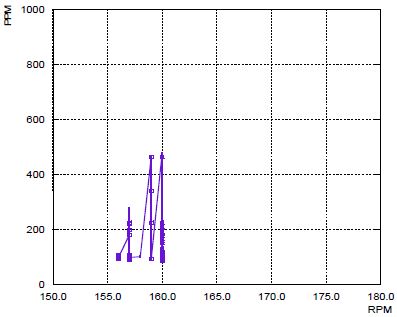
We presented the distribution of NOx/ CO concentration in Figure 7 and Figure 8. The distribution of NOx is from 1,230 ppm to 1,470 ppm and the range of CO distribution is 90 ppm ~ 460 ppm. It is interested that the highest concentration of CO is approximately 44% higher than concentration at entry/departure case. The poor weather in the sea continues during experiment and output of main engine significantly changed because of strong winds and high waves although the setting value is 157 RPM.
For this reason, CO concentration which is released from the incomplete combustion in low power at entry/ departure is lower than CO concentration which is emitted in high power at normal sailing condition. And, in Figure 7 and Figure 8, distribution of NOx concentration is observed more 10% and different of CO concentration is observed more than twice. The largely output changes exert a bad effect to fuel consumption, scavenging and combustion condition. It is caused by incomplete combustion then NOx/CO concentrations rapidly increase.
Actual results, when the ship operates at normal sailing, a significant change of pollutant emission (NOx, CO) concentrations was not observed. But, the degree of output changes for main engine due to weather conditions at sea affects that the emission of NOx and CO concentration are expected to be vari -ous ways. Therefore, though at normal sailing condition, we have to response assertive to output change of main engine affected weather condition and apply reduction technology for pollutant emission.
3.2 PM emission on HABADA training ship
The PM emission contained exhaust gas was measured using sampling equipment installed in the economizer top hole (DSP-507M, Isokinetic Sampling System) while the HANBADA training ship is operated from KMU port, BUSAN to Ulsan port, November 6, 2012.
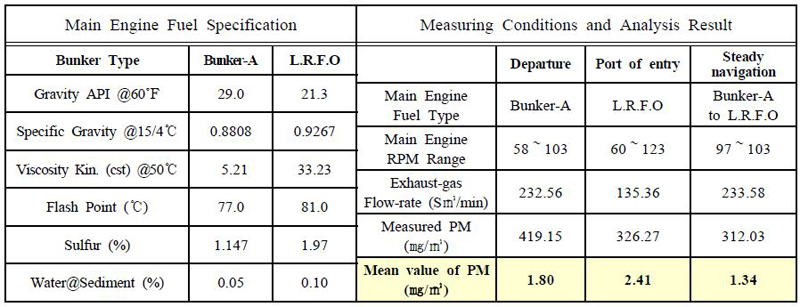
In Table 3, at the measured condition, the PM emission concentration taken main engine during sailing is shown. The fuel oil was used as Bunker-A at the departure. The oil type was changed to L.R.F.O(3%) at the normal sailing and it was used until the arrival to Ulsan port.
At the departure from KMU dock, the RPM of main engine was changed irregularly in the 58-103 range because of port circumstances. Also, in the event of arrival Ulsan port, the RPM moved from 60 to 123 due to some surrounding situations such as steering, speed, acceleration. In comparison with main engine output which changes frequently at departure condition, the PM emissions were 1.80 ㎎/㎥ and 2.41 ㎎/㎥ for departure and entry port, and it is 30% more than emission at entry port case.
Although main engine changes were similar between departure and entry port, PM emission was different each other. So, we identified that sulfur content and other impurities in L.R.F.O(3%) were more than the Bunker-A oil.
When we changed fuel oil from Bunker-A to L.R.F.O(3%) at steady navigation and fixed 100 RPM, PM emission was 1.34 ㎎/㎥.
4. Conclusion
We measure the NOx, CO, and PM emission concentration discharged from main engine using HANNARA, HANBADA training ship. Results are summarized as follows:
1) At ship arrivals and departures, the maximum concentration of NOx and CO in HNABADA training ship were 1,120 ppm and 1,450 ppm, and concentration in HANNARA training ship were 1,600ppm and 320ppm respectively. The NOx and CO concentration is various aspects even same RPM, it is affected the frequent main engine start/stop and a sudden changes of output. To reduce the pollutants such as NOx and CO, we have to reduce unnecessary output changes for the main engine, use the good quality fuel oil, and apply the reduction technology to ship.
2) As the normal sailing, the maximum concentration of NOx and CO at HANBADA whose engine output changes was small 913 ppm and 73 ppm. On the other hand, at the poor weather condition at sea, the maximum concentration of NOx and CO was 1,470 ppm and 460 ppm, respectively. In particular, the CO concentration is about 44% higher than for arrival/departure and we identified CO concentration was changed depending on degree of output change for main engine and time regardless the output level. Therefore, in normal sailing as well as entry /departure, it needs that changes of the main engine output is observed closely and make the appropriate reduction device.
3) The PM emission was measured using HANBADA training ship. In actual results, PM emission concentration was 1.80 ㎎/㎥ and 2.41 ㎎/㎥ for the arrival/departure at the port, and it is 1.34 ㎎/㎥ while the fuel oil was changed from Bunker-A to L.R.F.O(3%), respectively. The PM emission is affected by fuel oil in case that frequent output change of main engine is generated at the arrival and departures.
Notes
References
- IMO, Prevention Air Pollution From Ships, Marine Environment Rotection Committee, 45th Session, Agenda Item 8, p7-22, (2000).
- IMO, Implications of the United Nations Convention on the Law of the Sea for the International Maritime Organization, p49-65, (2012).
- United Nations Environment Programme, The Montreal Protocol on Substances that Deplete the Ozone Layer as Either Adjusted and/or Amended in London 1990 Copenhagen 1992 Vienna 1995 Montreal 1997 Beijing 1999, UNEP ozone secretaria”t, p1-3, (2000).
-
V. Ramanathan, and G. Carmichael, Global and Regional Climate Changes due to Black Carbon, Nature Geoscience 1, p221-227, (2008).
[https://doi.org/10.1038/ngeo156]

- IMO, Marine Environment Protection Committee, 53rd Session, Agenda Item 24, p28-36, (2005).
- IMO, Marine Environment Protection Committee, 54th Session, Agenda Item 21, p28-36, (2006).
- IMO, Marine Environment Protection Committee, 55th Session, Agenda Item 23, p28-37, (2006).
- IMO, Marine Environment Protection Committee, 65th Session, Agenda Item 22, p21-44, (2013).
- Jung-Sik Choi, Sang-Deuk Lee, Sung-Yun Kim, Kyoung-Woo Lee, Kang-Woo Chun, Youn-Woo Nam, and Jae-Hyuk Choi, “Basic study on PM/BC reduction technology and PM measurement from the training ship of Korea Maritime University”, Proceedings of the Korean Society of Marine Environment & Safety 2013 Spring Conference, p343-345, (2013).
- Kang-Woo Chun, Youn-Woo Nam, and Gun Feel Moon, “IMO regulation action of PM/BC reduction technologies”, Proceedings of the Korean Society of Marine Engineering 2012 Second Conference”, p58-62, (2012).
- Battelle Memorial Institute, Environmental Technology Verification Report, Horiba PG-250 Portable Emission Analyzer, (1999).
- DSP-507M Product Manual, http://www.dooill.co.kr/product08.asp, Accessed October 1, (2013).

