Development of 3D Terrain Visualization for Navigation Simulation using a Unity 3D Development Tool
Copyright © The Korean Society of Marine Engineering
This is an Open Access article distributed under the terms of the Creative Commons Attribution Non-Commercial License (http://creativecommons.org/licenses/by-nc/3.0), which permits unrestricted non-commercial use, distribution, and reproduction in any medium, provided the original work is properly cited.
Abstract
3D visualization of navigation simulation is to visualize the environment conditions (e.g. nearby ships, dynamic characteristics, environment, terrain, etc) for any users on ships at sea. Realistic 3D visualization enables the users to be immersed to it and guarantees the reliability of the simulation. In particular, terrain visualization contains many virtual objects, so it is time and cost-intensive for object modelling. This paper proposes a 3D terrain visualization method that can be realized in a short time and with low cost by using the Unity 3D development tool. The 3D terrain visualization system requires bathymetric and elevation terrains, and Aids to Navigations (AtoNs) to be realized. It also needs to include 3D visualization objects including bridges, buildings and port facilities for more accurate simulation. Bathymetric and AtoN elements are acquired from ENC, and the elevation element is acquired from SRTM v4.1 digital elevation chart database developed by NASA. Then, the bathymetric and elevation terrains are generated, and the satellite images are superposed by using this terrain information. The longitudinal and latitudinal information of the AtoNs are converted to the 3-axis information to position the AtoN locations. The 3D objects such as bridges, buildings and port facilities are generated and the terrain visualization is completed. The proposed method realizes more realistic 3D terrain visualization of Busan Port.
Keywords:
Navigation simulation, 3D visualization, Terrain visualization, Virtual object, Aids to navigation1. Introduction
Simulation is performed through dynamic or stationary objects according to the application purposes. First, a proper definition on the virtual object for the application purpose is required. The virtual object should be based on reality to enhance the effect of the simulation result. That is, visualization information is a simulation-user interface, makes the user to be immersed in the simulation enhancing the reliability of the simulation results [1]. In particular, a high-reality visualization technique is very important in development of navigation simulation method to develop and evaluate ship-ship or ship-shore maritime service portfolio (MSP), wherein the naval accidents induced by human errors are minimized. The main reason is that the visualization technique makes the services and effects of MSP to intuitively be accepted to the users, and helps them to develop IT services for navigation safety [2][3]. For the end users, the simulation tool needs to represent real environmental conditions such as nearby ship information, dynamics, environment, and terrains, wherein the ship navigates worldwide. The simulation program also considers navigation tools such as radar, ECDIS and AIS, and essential visualization elements that the mates needs for the navigation. These elements can be divided into weather, ocean, ships and terrains [4]. In particular, terrain visualization contains many objects including the port and narrow channel terrains, bathymetry, AtoNs and port facilities, so it is time and cost-intensive in object modeling, and induces deterioration of the simulation performance. Therefore, this study analyzes an open source development tool that can be used for navigation simulation, and proposes a navigation simulation terrain visualization system to be realized in a short time with low cost by using a Unity 3D tool [2]. By using the Unity 3D engine for the 3D visualization system, a navigation simulation is possible in the 3D environment without any limitations in cost, time and space. It also enables us to generate and edit more accurate 3D virtual objects such as the port and narrow channel terrains, bathymetry and AtoNs, and provides us with additional objects including the bridges, buildings, trees and port facilities for realization and representation of the terrains [4]. Several considerations are required for the 3D terrain visualization system of navigation simulation as follows:
- ① It enables us to easily edit the terrains for connection with various simulation systems.
- ② It reflects the accurate bathymetry to terrain visualization so that we can perform simulation for dangerous regions such as rocks and shallow waters.
- ③ It locates the AtoNs such as seaway, direction, and safe water zones on the exact location for navigation safety.
- ④ It guarantees the users’ perspectives by visualizing the 3D objects such as buildings, vehicles, cranes and containers, to enhance users’ recognition and immersion.
- ⑤ It prevent any malfunction and deterioration related to the movement of the object so that it can be used for normal PCs.
This research suggests a 3D terrain visualization system of navigation simulation using an open source tool, Unity 3D. The proposed system is connected to conventional navigation simulation based on Unity 3D, and experimentally verified.
2. Related Research Work
2.1 Analysis on the Development Tools for 3D Visualization
The development tool needs to be used for the purposes of navigation simulation, applied for system extension and even for other systems, and accessible to any users for easy editing and supplementary tasks. This study analyzes several visualization development tools such as Ship Simulator, Unity 3D, which are based on Lumion 3D, UC Win/Road or Google Earth, so that we can effectively design the visualization objects of navigation simulation [5].
Lumion 3D is a 3D modeling and rendering tool developed by Netherlands-based Act-3D. It easily create environment and locate models to move freely. It also provides us with strong visual effects, enables easy setting of the effects, and helps us make movies. However, 3D rendering is performed manually, and connot be connected to the simulation results. That is, Lumion 3D is used for manual visualization with many models without any connections with the simulation results. That means it cannot be used for navigation simulation since we are not able to change any environmental elements and simulation characteristics.
UC Win/Road is a urban environment simulation tool developed by Japan-based FORUM 8. This tool is developed for simulation of overland urban environment and transportation flow. Therefore, it can easily place environment and models, change the characteristics, and perform simulation according to scripts. However, the main function is to simulate the overland environment and transportation flow, it has many limitations in the simulation of ocean environment and modeling. For example, it cannot set anything related to tide and wind, which are important factors in navigation, neither the ship models. Even though it can be used for visualize a script, wherein the simulation results are constructed, it has many limitations in navigation simulation which is completely different from the overland environment.
Google Earth is Google’s satellite mapping service, and can be used to develop various applications using Google Earth API. By connecting through the web browser and installing Google Earth plug-in, simulation and visualization are possible in PC and mobile environment. It is based on the satellite mapping service, any additional processing is not required for terrains. Therefore, navigation simulation is possible by using Google Earth. However, Google Earth requires the user computers to be based on the web server an connected through the internet. It also uses the satellite maps already taken on the occasion of photograph, so it can induces confusion in visualization.
Unity 3D is a game-based development tool developed by US-based Unity Technology. The main function is to develop 3D games, but its powerful and various functions can be used for other purposes. It’s rendering, lighting, terrain, and special effects are so powerful that we can create high-quality 3D graphic images, and enable us to easily revise every works. That is, it can control the 3D objects and terrains, visualize any desired results, and support modeling and simulation.
2.2 Visualization System of the Navigation Simulation
As shown in Table 1, the navigation simulation can be divided into two categories on the perspectives of the end uses: stationary and moving objects. The static object refers to the object that is not changed with time, but the dynamic object that changes with time, in simulation visualization [6].
The dynamic object consists of an environmental visualization system that can control the navigational environmental objects such as tidal intensity and direction; and express the night and daytime according to the visualization and time setting related to navigation. This process is for the ship object to navigate along the scheduled course. Visualization of the static object refers to the required objects to set the initial environmental conditions including the port facilities, seawalls, bridges and AtoNs. These objects utilize the bathymetric and elevation data, and locate and represent the terrains and AtoNs including the courses in the specific region, direction, and safe water zone. They also include objects such as buildings, vehicles, port cranes and containers for realistic 3D visualization.
3. Realization and Verification of 3D Terrain Visualization
3.1 Development Tool for 3D Terrain Visualization Modules
The visualization objects of terrains should be desinged to be used in Unity 3D. By using Unity 3D Asset Store, we can save the time and efforts in the development process. The development of the 3D terrain visualization system requires various tools and Unity Asset items. The followings are detailed explanations for the development tools [7].
- - Global Mapper: This is Geographic Information System (GIS) software that processes vector, raster and elevation data and provides general editing functions like viewer, conversion, edit and output.
- - Terraland Downloader Asset: Elevation map database can be directly downloaded from the NASA server onto Unity 3D, and terrain is generated using elevation data. Also, it overlaps satellite image on the terrain according to the geographical coordinates.
- - Terraland Terrain Asset: Terrain can be saved as RAW file. RAW file is an image format that includes elevation map information.
- - Terraland Earth Asset: This tool refers to geographical co ordinates of terrain or satellite image to turn spherical surface of earth into a plane.
- - TerraCity Asset: A complex city can be generated in Unity 3D to have various editing permissions and man agement functions.
- - TerraBuoy Manage Asset: This tool is used to place the buoy objects into their real positions in the 3D scene. It changes geographical coordination into tri-axial coordination.
- - TerraTrees Asset: This tool generates trees and plants on Unity 3D and positions them on appropriate position on the terrain.
- - Google Sketchup Pro: As a 3D modeling development tool used in diverse areas including object design, civil en gineering, mechanical engineering and video games, this program designs and exports 3D objects like cranes, bridges and buildings.
- - Photoshop: This tool is used to edit resolution of elevation map and bathymetric data and to modify RAW files.
3.2 Design of the 3D Terrain Visualization Module Structure
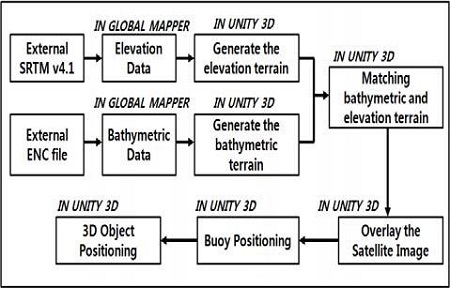
Several important things in 3D terrain visualization are elevation data), bathymetric data, and AtoN data. The elevation data is acquired from STRM v4.1 digital elevation database of NASA. The bathymetric and AtoN data are acquired from the electronic navigation chart(ENC). Then, the bathymetric and elevation terrains are generated and merged to superpose the satellite images. The AtoNs are positioned in the 3D terrain by converting the acquired longitudinal and latitudinal information into the 3-axis information. Several objects including the buildings, bridges, port facilities (e.g. cranes and containers), vehicles and trees were added as well. Figure 1 shows the overall flow chart of the entire system to realize the 3D terrain visualization system. The terrain examples in this paper is the case of Busan Port. The proposed method herein can be applied to accurate 3D visualization for any location worldwide.
3.3 Generation of Bathymetric terrain
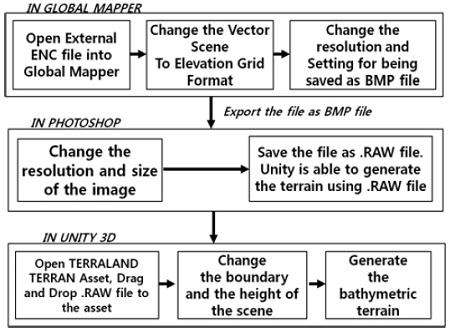
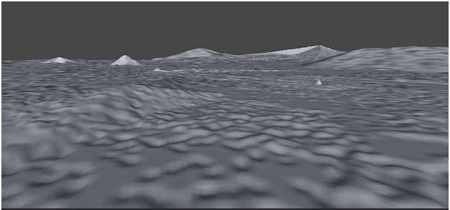
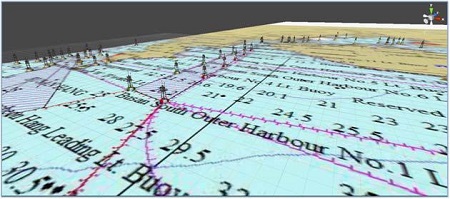
The bathymetric information can be acquired from the ENC file by using Global Mapper. The ENC is vector-based electronic map generally used in electronic chart display and information system for safer navigation. The acquired bathmetric information is converted to the RAW file to be used in Unity 3D, and make a visualization part. Figure 2 shows the procedure to generate bathymetric terrain, and Figure 3 shows the generated bathymetric terrain of Busan Port.
3.4 Generation of Elevation Terrain
Elevation refers to the mean sea level. The elevation information was acquired from NASA’s digital elevation map database of SRTM v4.1 by using Unity 3D Terraland Downloader Asset. The accuracy of the elevation in this database is ±90m. This system assigned 19.384km2 in Busan Port as the target area for 3D terrain visualization. In this system, the area of 19,384cm2 was assigned to realize a more accurate and low-memory visualization system. 1 cm in this system means 1 m in the real world. Figure 4 shows the block diagram for elevation information acquisition and terrain generation. Figure 5 shows the created elevation terrain of Busan Port.
3.5 Combination of Bathymetric Terrain and Elevation Terrain
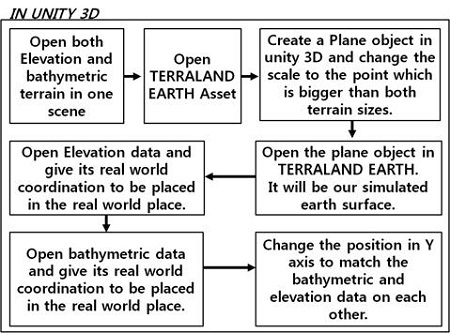
Terrains generated using bathymetric and elevation data need to be matched, and this is done using terrain editing tool on Unity 3D. Figure 6 shows the method to match bathymetric and elevation data.
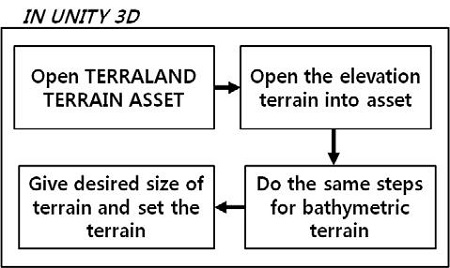
When bathymetric terrain and elevation terrain are matched in this step, size of the resulting terrain is automatically compressed and reduced. Accordingly, size of the terrain must be changed. The corresponding procedure is as Figure 7.
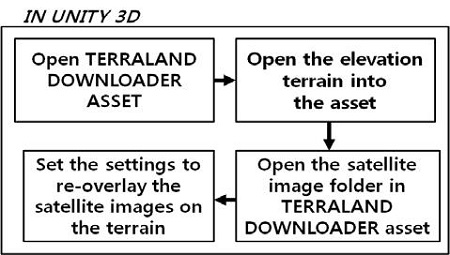
Since satellite image becomes blurred after adjustment of size, satellite image must be re-overlaid onto the terrain. The procedure is as shown in Figure 8.
3.6 Generating AtoN Facilities
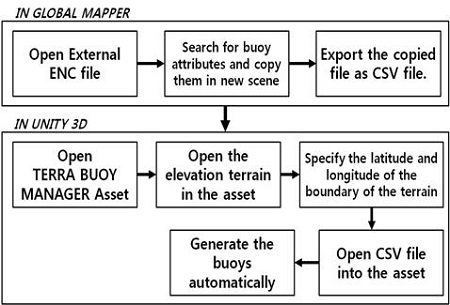
AtoN facilities are one of important elements to be considered in simulation due to their importance in ship navigation. Among AtoN facilities, buoys are in diverse lights. Buoys that must be embodied on the 3D terrain of Busan Port include red, green and yellow buoys. TerraBuoy Manager Asset was used. This Asset can identify characteristics of buoys such as color, height and position, and it automatically assigns buoys on actual latitude and longitude on the 3D terrain using accurate color and size. First, position and characteristics of buoys are extracted from ENC file using Global Mapper and then obtained information are loaded into the asset. The block diagram of the process is shown in Figure 9. Figure 10 shows the generated AtoNs, which are located on the exact positions provided by ENC.
3.7 Generating 3D Objects
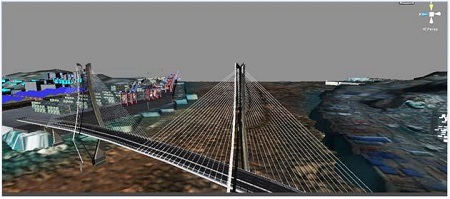
In order to make the simulated environment more realistic, it is necessary to design and assign some 3D objects such as buildings, cars, port cranes and containers on the 3D terrain. The necessary 3D objects can be downloaded for free on Sketchup Warehouse web site that has a database of 3D objects. Sketchup Pro tool was used to convert 3D objects into files that can be loaded on Unity 3D. Figure 11 shows the bridge among the generated 3D objects.
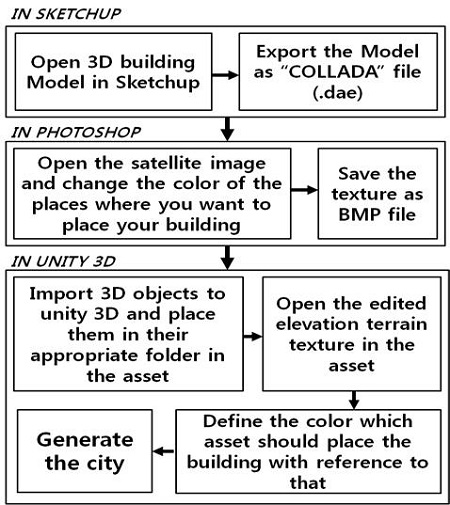
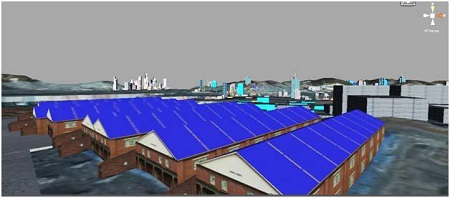
To generate a city, the building objects are placed by using TerraCity Asset development tool. This Asset cannot place the building with respect to the exact latitudinal and longitudinal locations, but it can edit the textures by using Photoshop. For example, we can place a building on arbitrary location, if we put a red dot in the texture and define that the red dot is a building. That is, TerraCity Asset can recognize and identify the various colors of the texture, and place the building in an intelligent way by referencing the textures. It can also place the files, wherein the various types of buildings are stored in the folder, and thereby place the building, house and apartments in an arbitrary manner. Figure 12 shows the block diagram, and Figure 13 shows the visualization of the generated city.
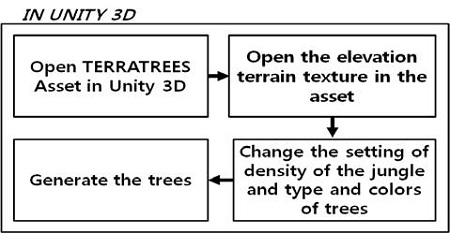
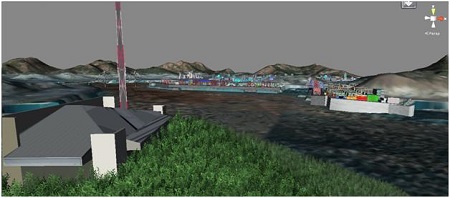
The final step in 3D terrain visualization is to generate trees. TerraTrees Asset development tool was used for this purpose. The main function of this Asset is similar to TerraCity Asset, so it can automatically place the trees on the exact location of green color in the satellite image. The block diagram of the process is as Figure 14. Figure 15 shows the generated trees from the visualization system.
3.8 Realized system
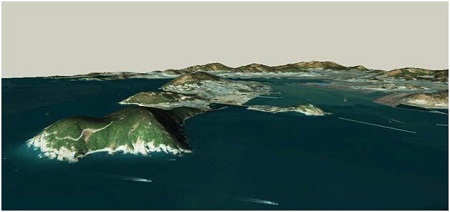
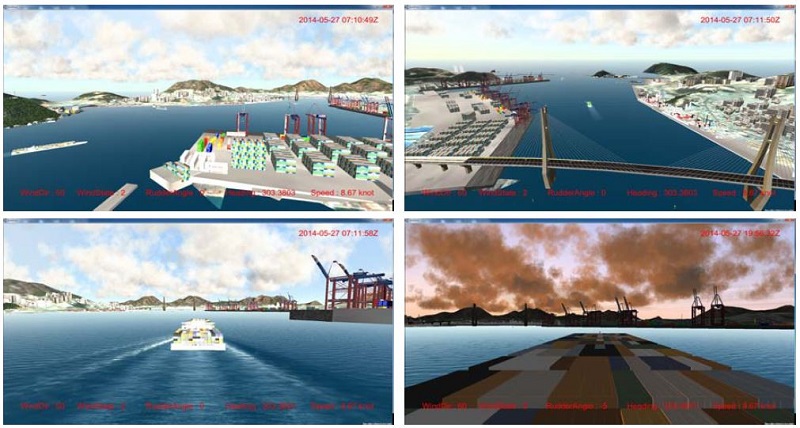
Figure 16 shows the realized system for 3D topology visualization of Busan Port using the Unity 3D development tool. After selecting the 19.384km2 area of the port topology, 64 satellite images with 2048-pixel resolution were superposed. Then, Busan Port was realized by locating the 3D objects including bridges, buildings and port facilities. It also shows the view of Busan Port on the perspectives of the ship, by simulating the port entry of a container ship, using the previously developed navigation simulation tool. The experiments shows that the performance of the moving object is not deteriorated, even though the virtual space contains various types of objects.
4. Results and Further Studies
This paper discussed the 3D topology visualization system for development of the navigation simulation system. For this purpose, the authors generated and merged the elevation and bathymetric terrains, superposed the satellite images, located the 3D objects, and thereby realized a realistic terrain visualization system. The developed is a visualization system based on Unity 3D, and can be used for PC environment. and other simulators. The main target for the terrain visualization in this research is Busan Port. The suggested method enables easy way of terrain visualization in development of various types of simulators using Unity 3D.
The further study is required to apply the realized terrain visualization system to the navigation system that can be used to evaluate and verify the some of 16 MSPs items suggested by International Maritime Organization. This further research is to develop the effective MSP IT systems and services intuitively for mariner by using this system and to evaluate the usability of the services based on IMO guidelines on Human Centred Design(HCD) for e-navigation systems.
Acknowledgments
This research was supported by a part of IT Element Technology Standard Development Project of e-Navigation Port.
References
-
T. H. Fang, J. Y. Oh, H. J. Hwang, B. C. Kim, and D. W. Mun, “Development of a 3D real-time visualization system for ship handling simulators using an open source 3D graphics engine”, Journal of Navigation and Port Research, 35(3), p187-195, (2011), (in Korean).
[https://doi.org/10.5394/KINPR.2011.35.3.187]

-
Y. S. Park, J. S. Kim, C. S. Kim, J. J. Yong, H. K. Lee, and E. S. Jeong, “A study on the marine traffic risk assessment by using ship handling simulator”, Journal of the Korean Society of Marine Environment & Safety, 19(2), p138-144, (2013), (in Korean).
[https://doi.org/10.7837/kosomes.2013.19.2.138]

- H. G. Hwang, J. S. Lee, I. S. Shin, and Y. H. Yu, “A modeling and simulation approach method for effectiveness evaluation of MSP (Maritime Service Portfolio)s”, International Symposium on Marine Engineering & Technology, (2013).
- H. S. Kang, I. S. Shin, and Y. H. Yu, “The design of 3D visualization system of ship navigation using unity 3D”, Proceedings of the 38th KOSME Spring Conference, 22, (2014), (in Korean).
- S. S. Kim, User-interface development research using Unity 3D in practice, M.S. Thesis, Department of Game Engineering, Pai Chai University, Korea, (2014), (in Korean).
-
H. J. Hwang, and D. H. Mun, “A study on improving graphic rendering engine for visualization of ship handling simulation”, Journal of Navigation and Port Research, 34(3), p153-160, (2010), (in Korean).
[https://doi.org/10.5394/KINPR.2010.34.3.153]

- M. Beirami, I. S. Shin, and Y. H. Yu, “A method for 3D simulation of elevation, bathymetric, AtoN Data for Maritime simulator”, Proceedings of the 38th KOSME Spring Conference, p219, (2014).


