Proposal and Analysis of Hydrogen Mitigation System Guiding Hydrogen in Containment Building
Copyright © The Korean Society of Marine Engineering
This is an Open Access article distributed under the terms of the Creative Commons Attribution Non-Commercial License (http://creativecommons.org/licenses/by-nc/3.0), which permits unrestricted non-commercial use, distribution, and reproduction in any medium, provided the original work is properly cited.
Abstract
This study is about a hydrogen mitigation system in a containment building like an offshore or a nuclear plant. A hydrogen explosion is possibly happened after condensation of steam if hydrogen releases with steam in a containment buildings. Passive autocatalytic recombiner is the one of the measures, but the performance of this equipment is not sure because the distribution of hydrogen is very irregular and is not predicted correctly. This study proposes a new approach for improving the hydrogen removing performance with hydrogen-guiding property. The steam is simulated and analysed. The results show that the shallow air containment reduced over 55% of the released hydrogen and the deep air containment type reduces over 80% of released hydrogen.
Keywords:
Hydrogen mitigation, Severe accident, Passive auto-catalytic recombiner1. Introduction
Many studies have been carried out to reduce the hydrogen risk in a containment building, such as pre-inerting, post-accident inerting, post-accident dilution, passive auto-catalytic recombiner (PAR), igniter, catalytic recombiner and igniter (dual concept), post-accident dilution (PAD) and catalytic recombination, containment atmosphere dilution by inert gas injection and catalytic recombination, and engineered mixing and deliberate ignition [1].
The method for measuring hydrogen mitigation is highly plant specific. Certain containment designs preclude the implementation of other measures [2]. Furthermore, each of the various measures available has its strengths and weaknesses [3]. There is no single strategy or technique that is universally appropriate for all designs and accident scenarios [4], even for all phases of an accident in a particular design [5].
PARs are equipped widely in many containments of European light water reactors (LWR) [6]. PAR is so-called because it requires no external power input to function. They are self-starting and self-feeding [7]. Platinum or palladium are the materials most commonly used in PAR as a catalyst owing to their ability to absorb hydrogen and oxygen [8]. These materials have proven ability to reduce the deflagration or detonation risk [9].
Hydrogen is a flammable gas, which means that is reacts chemically with oxygen to form steam: 2H2 + O2 → 2H2O.
This chemical reaction releases energy in the form of heat. The heat of combustion is 120kJ per gram of hydrogen. In an accident situation in a nuclear power plant, combustion will normally occur in a premixed “cloud”, consisting of hydrogen, air, normally steam, and even other gases [10]. Although hydrogen is a flammable gas, it will not always burn immediately when mixed with oxygen. For combustion to take place, it has to be triggered by some initiating events: ignition and favorable conditions. The physical conditions that define these conditions is a gas cloud to sustain hydrogen combustion and the composition [11]. The range of species concentrations within which the cloud is burnable are called the “flammability limits”, which can be defined as “lower flammability (necessary minimum concentration of burnable gas) and "higher flammability limits” (maximum concentration of burnable gas, as the mixture should also contain a sufficient amount of oxidant).
The potential risk can be reduced based on the “lower flammability limits” theory. Therefore, the PAR was designed to convert the hydrogen gas in the containments to keep the hydrogen concentration under the “lower flammability limits” [12]. The PAR works spontaneously as soon as the hydrogen concentration begins to increase in the atmosphere [13]. The recombination reaction occurs spontaneously at the surfaces, and the water vapor, as a product of the reaction through the recombiner as natural convective flow currents, promote the mixing of combustible gases in the containment [14].
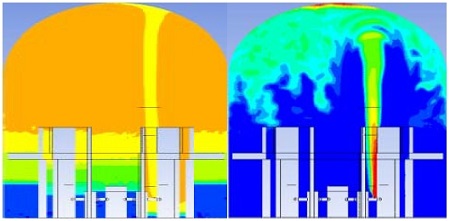
On the other hand, the PAR must be placed on existing hydrogen and reaction air. If not, the PAR is not working. Previous work submitted in the Journal of Nuclear Engineering and Design showed that hydrogen distribution is irregular and dependent on the failure locations, and air is not sufficient for the recombination process, as shown in Figure 1[15].
This study proposes a new system design to remove hydrogen effectively, and analyses of its performance.
2. Proposal of a mitigation system
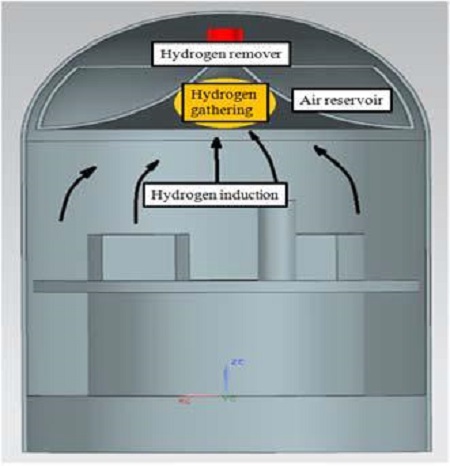
Figure 2 shows a new concept design of a hydrogen mitigation system actively controlling the hydrogen distribution. Hydrogen induction can occur at any place where accidents happen. The hydrogen needs to collect at a place, and react with the surrounding air in an air reservoir to produce steam. Therefore, the hydrogen can be removed more effectively.
3. Simulation conditions
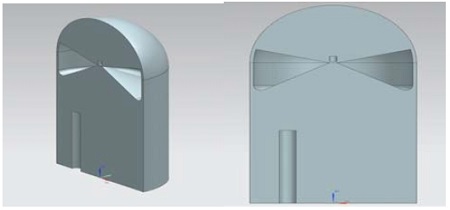
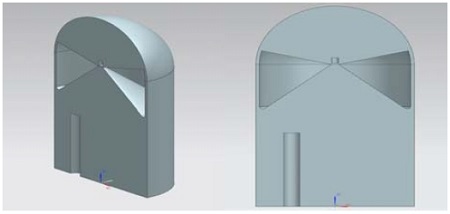
Figures 3 and 4 show the inner shapes of the containment building. The containment building is a cylindrical shape with a dome top, and the structure in the lower part of the building is removed. An air reservoir and hydrogen is then removed. An air reservoir and hydrogen remover are added to the containment. The air reservoirs are given as two different types of shallow air in a reservoir (Type I) and the deep air reservoir (Type II) with depths of 12m and 18m, respectively. The diameter and the height of the building are 22m and 80m, respectively. The total number of grids is 2,700,000 and the grids are generated using NX7.5 and ICEM-CFD codes. The grids are generated densely near the removal area to reduce the error from a high velocity and high pressure gradient.
Table 1 lists the calculation conditions. The amount of hydrogen released is divided into four different situations, 120kg, 200kg, 300kg and 440kg, to compare the performance of the new concept design hydrogen mitigation system.
4. Results and discussion
4.1 Gases behaviours in the shallow containment (Type I)
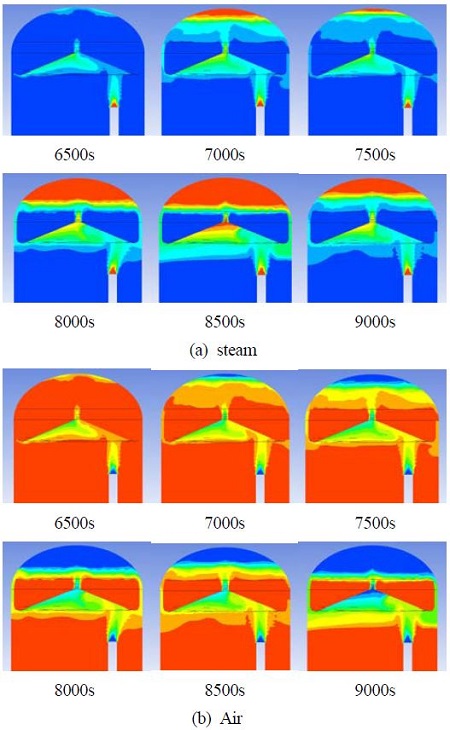
Figure 5 shows the steam and air behaviors during the release of steam from steam release beginning (0s) until hydrogen release begins (6000s). Leakage failure is assumed to occur at the lower area of the containment. Most of the hot steam released from the leakage opening is gathered by the guidance wall and passes through the center hole and the steam accumulates from the top of the containment building. Steam begins to accumulate at the top of the containment building from 2000s, which is shown as a red color in the figure. Until 6000s, the steam accumulates from the hydrogen removal part, and also accumulates under the guidance wall, while air remains from the air reservoir.
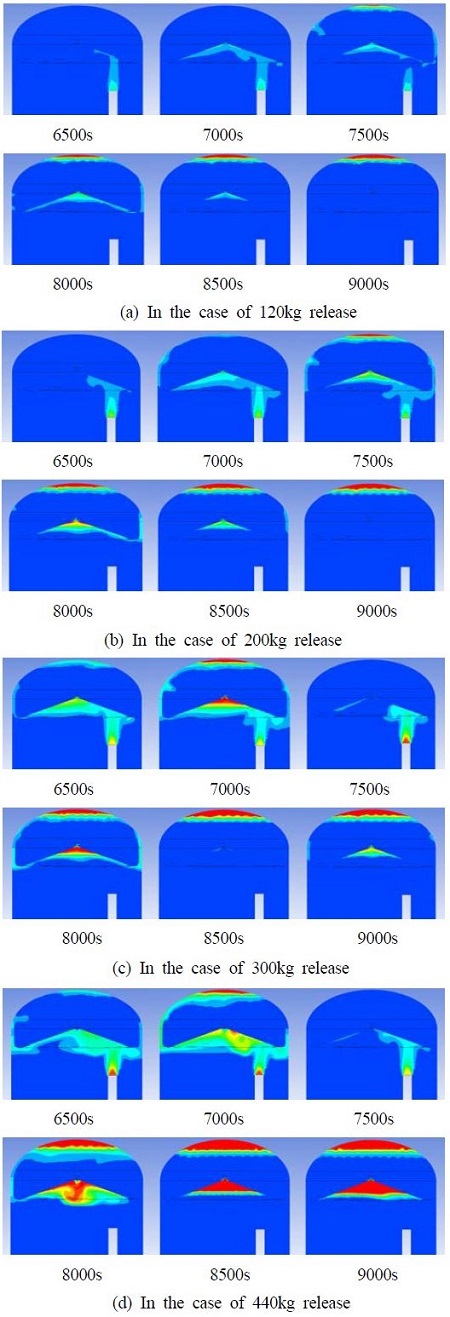
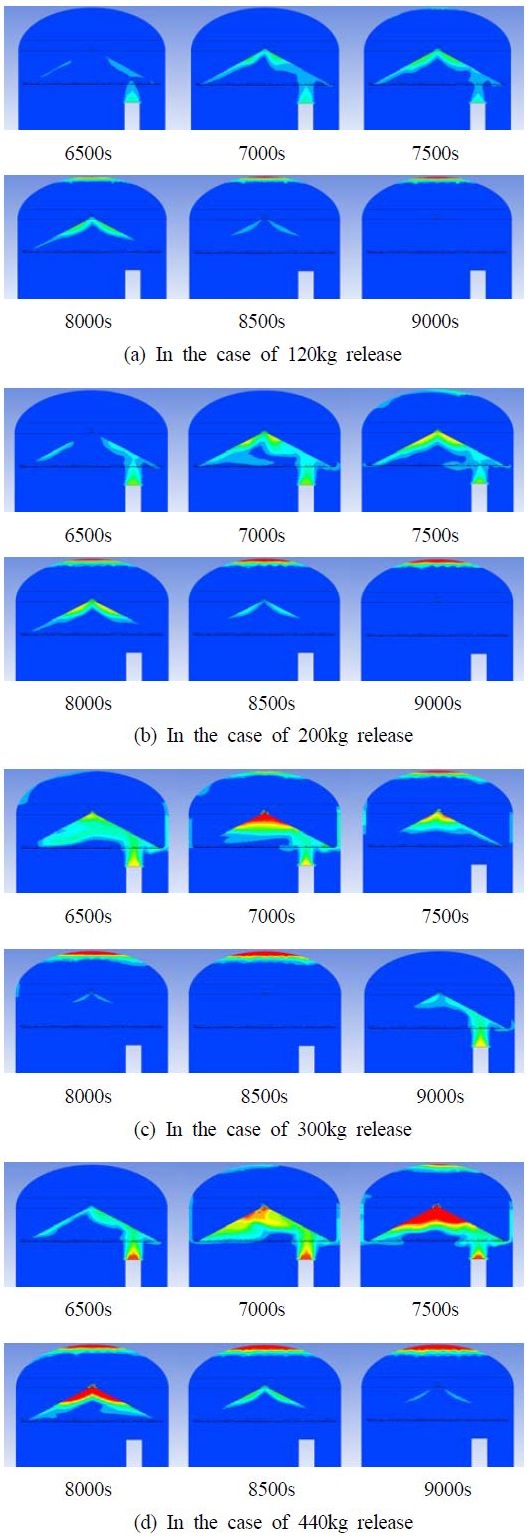
Figure 6 shows the hydrogen behaviors during hydrogen release in the case of the total released mass of 120 - 440kg. Hydrogen begins to release at 6000s and its volume fraction increases gradually. Some of the hydrogen passes up to the hydrogen gathering area through the guilding wall and then to the hydrogen removal part, in which hydrogen has been removed. The other part of hydrogen goes directly up to the top of containment through the gap by the building wall, in which the hydrogen remains at the top after hydrogen release. The amount of hydrogen remaining increases with increasing hydrogen release.
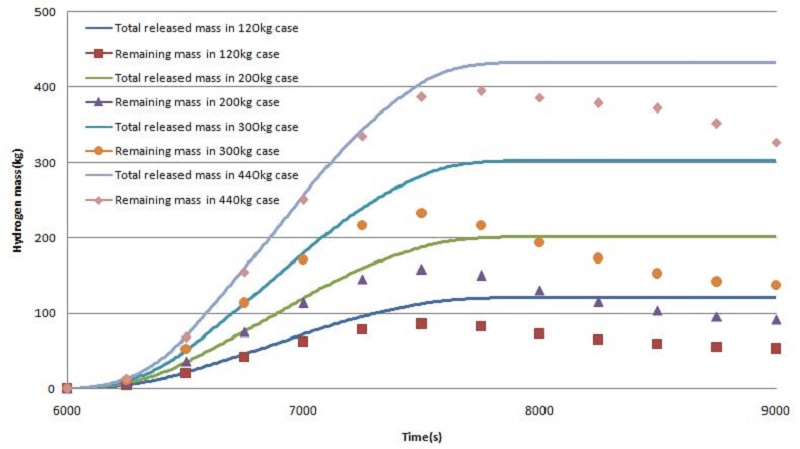
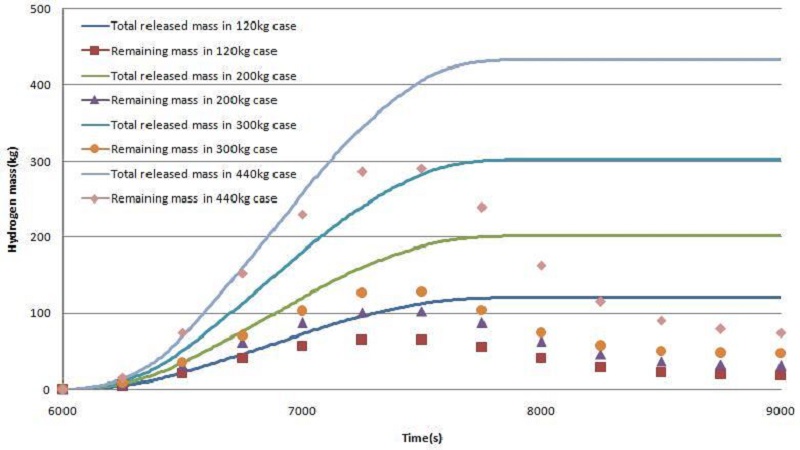
Figure 7 shows the curves of the released hydrogen mass and remaining hydrogen mass in the cases of 120 - 440kg release. Hydrogen release starts at 6000s, and hydrogen decreases from approximately 700s when the hydrogen reaches the remover, and the hydrogen concentration then decreases with time. 55-56% of the hydrogen released has been removed in the case of 120 - 300kg hydrogen release, but the reduction rate has been reduced rapidly to 25% in the case of 440kg hydrogen release.
4.2 Gases behaviours in the deep containment (Type II)
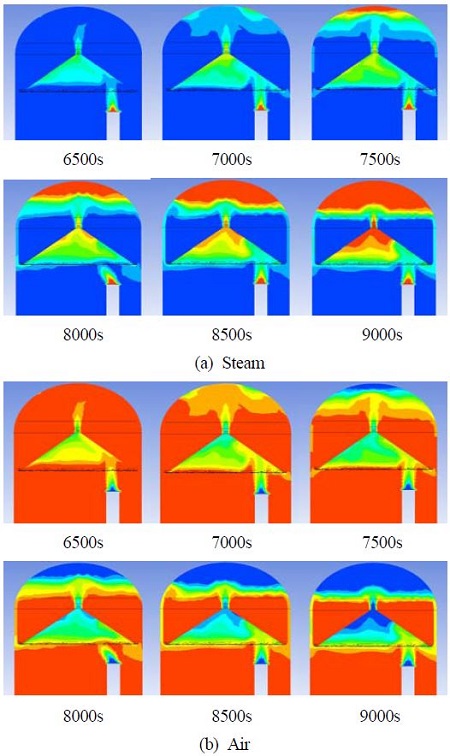
Figure 8 shows the steam, and air behaviors during steam release from the steam release beginning (0s) until hydrogen release begins (6000s) in the deep hydrogen guiding type (Type II). The steam release condition from the inlet is the same as that in the case of the shallow guiding type (Type I). With the steam behaviors of Type I, most of the hot steam gathers by the guidance wall and passes through the center hole and steam accumulates from the top of the containment building, and air remains in the air reservoir.
Figure 9 shows hydrogen behavior during hydrogen release in the case of the total released mass of 120 - 440kg. Compared to Type I, more hydrogen passes up to the hydrogen gathering wall and the hydrogen is then removed by the hydrogen remover. The other part of hydrogen that passes directly up to the top of the containment through the gap between air reservoir and building wall is also reduced rapidly.
Figure 10 shows the curves of released hydrogen mass and remaining hydrogen mass in the case of 120 - 440kg release. The remaining hydrogen curves are reduced with time, which is similar to Type I, but the reduction rate is much lower than those in Type I.
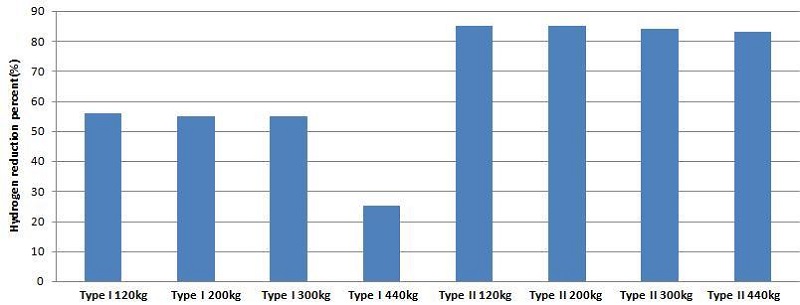
Figure 11 shows the final percentage hydrogen reductions in two cases of Type I and II under various conditions of hydrogen release. In the case of Type I having shallow guidance, approximately 55% of the total released hydrogen has been reduced under the conditions of 120kg to 300kg release, but only 25% has been reduced under the condition of 440kg release because a large amount of hydrogen has passed through the gap between the guidance, resulting in a lower recombination rate. In the case of Type II having deep guidance, more than 80% of total hydrogen released was reduced under all conditions of 120kg to 440kg release, which means that deep guidance is a more favorable condition for the hydrogen recombination process.
5. Conclusions
This study proposed a new concept design of a hydrogen mitigation system and analyzed the steam, air and hydrogen behavior during accidents, which is summarized as follows.
-During steam release:
The steam will be gathered at the top of the containment building and push the air downward, which occupies the entire containment over the failure before hydrogen leakage occurs. The air pushes down from the upper part of containment, but the air remains in the air reservoir until hydrogen reaches the hydrogen remover, which actually provides a favorable condition for hydrogen recombination. This overcomes the problem of an unsatisfactory recombination process due to the insufficient oxygen fraction.
-During hydrogen release:
Some part of hydrogen moves to the hydrogen gathering through the guiding wall and then to the hydrogen removal part. The other part of hydrogen passes directly up to the top of the containment through the gap by the building wall, in which hydrogen remains at the top after hydrogen release. The amount of hydrogen remaining increases with increasing hydrogen release. The final percentage reduction of hydrogen is 55% in Type I and 83% in Type II.
Acknowledgments
This study was supported financially by the Korean Ministry of Science, ICT and Future Planning under the Nuclear R&D Program.
References
- S. B. Kim, D. H. Kim, and Y. M. Song, Development of Evaluation Technology for Hydrogen Combustion in containment and Accident Management Code for CANDU, Report KAERI-RR-3148-2009, Korea Atomic Energy Research Institute, Republic of Korea, (2011).
- I. K. Park, J. H. Moon, and G. C. Park, “The probablistic analysis on the containment failure by hydrogen burning at severe accident in nuclear power plants”, Journal of the Korean Nuclear Society, 26(3), p411-419, (1994).
- International Atomic Energy Agency (IAEA), Mitigation of hydrogen hazards in water cooled power reactors, Report IAEA-TECDOC-1196, Vienna International Centre, Austria, (2001).
-
E. Ba. Rhellerie, F. Arnouldm, M. Auglaire, B. de Boeck, OE. Bachellerie, F. Arnould, M. Auglaire, B. de Boeck, O. Braillard, B. Eckardt, F. Ferroni, and R. Moffett, “Generic approach for designing and implementing a passive autocatalytic recombiner PAR-system in nuclear power plant containments”, Journal of Nuclear Engineering and Design, 221(1-3), p151-165, (2003).
[https://doi.org/10.1016/S0029-5493(02)00330-8]

-
Y. Ju, and T. Niioka, “Reduced kinetic mechanism of ignition of non premixed hydrogen/air in a supersonic mixing layer”, Journal of Combustion and Flame, 99(2), p240-246, (1994).
[https://doi.org/10.1016/0010-2180(94)90127-9]

-
D. G. Vlachos, L. D. Schmidt, and R. Aris, “Ignition and extinction of flames near surfaces: Combustion of H2 in air”, Journal of Combustion and Flame, 95(3), p313-335, (1993).
[https://doi.org/10.1016/0010-2180(93)90135-P]

-
R. He. k, G. Kelber, K. Schmidt, and H. J. Zimmer, “Hydrogen reduction using the dual recombiner–igniter concept”, Nuclear Engineering and Design, 157(3), p311-319, (1995).
[https://doi.org/10.1016/0029-5493(95)01009-7]

-
D. G. Vlachos, “Reduction of detailed kinetic mechanism for ignition and extinction of premixed hydrogen/ air flames”, Chemical Engineering Science, 51(16), p3379-3993, (1996).
[https://doi.org/10.1016/0009-2509(96)00239-4]

-
J. F. Griffiths, J. A. Barnard, Flame and Combustion, Blackie Academic & Professionals, (1995).
[https://doi.org/10.1007/978-94-011-0619-1]

- K. R. Kim, S. W. Paek, H. J. Choi, and H. S. Chung, “Catalytic recombination of hydrogen and oxygen in air stream”, Journal of Industry and Engineering Chemistry, 7(2), p116-120, (2001).
- E. A. Reinecke, J. Boehm, P. Drinovac, and S. Struth, “Modelling of catalytic recombiners : Comparison of REKO-DIREKT calculations with REKO-3 experiments”, Proceedings of Nuclear Energy for New Europe 2005 International Conference, Slovenia.
- T. Fu. ii, K. Fujimoto, S. Yamanari, and Y. Yoshinari, A Thermal-Hydraulic Analysis Model for Catalytic Hydrogen Recombiners in the Containment Vessel of a BWR, 7th International Conference on Nuclear Engineering (ICONE-7), Tokyo, Japan, (1999).
-
T. K. Blanchat, and A. Malliakos, “Analysis of hydrogen depletion using a scaled passive autocatalytic recombiner”, Journal of Nuclear Engineering and Design, 187, p229-239, (1999).
[https://doi.org/10.1016/S0029-5493(98)00283-0]

-
B. Gera, P. K. Sharma, R. K. Singh, and K. K. Vaze, “CFD analysis of passive autocatalytic recombiner”, Science and Technology of Nuclear Installations, 2011, Article ID 862812, (2011).
[https://doi.org/10.1155/2011/862812]

-
K. H. Park, and K. H. Bae, “Hydrogen concentration variation and examination of PAR installation in reactor containment building during hydrogen release from different failure places”, Journal of Nuclear Engineering and Design, 278, p229-238, (2014).
[https://doi.org/10.1016/j.nucengdes.2014.07.021]


