Study on effect of buoyancy modules on power connection cable for 15-MW based floating green-hydrogen production system
Copyright © The Korean Society of Marine Engineering
This is an Open Access article distributed under the terms of the Creative Commons Attribution Non-Commercial License (http://creativecommons.org/licenses/by-nc/3.0), which permits unrestricted non-commercial use, distribution, and reproduction in any medium, provided the original work is properly cited.
Abstract
The dead weight of a power connection cable of a floating green-hydrogen production platform has a significant impact on the cable life. Increasing the floatability of this cable by attaching buoyancy modules to reduce its dead weight can improve its structural integrity. In this study, the effect of attaching buoyancy modules to the power connection cable of a floating green-hydrogen production platform was investigated. To this end, a coupled dynamic analysis was performed using the commercial software OrcaFlex. The production platform comprised a 15-MW floating offshore wind turbine (FOWT) and a floating production storage and offloading (FPSO) unit, connected by a power connection cable; buoyancy modules were attached to this connection cable. The environmental conditions were assumed to be the operating conditions, under which electricity was produced by the wind turbines. First, a static analysis was conducted, which confirmed that when the buoyancy module was attached, the effective tension of the connection cable decreased throughout the line. Next, a dynamic analysis to investigate the dynamic behavior of the effective tension and bending moment of the connection cable was also conducted. When a buoyancy module was attached to the connection cable, the effective tension was observed to decrease.
Keywords:
Floating green-hydrogen production platform, Floating offshore wind turbine, Buoyancy module, Power cable, Coupled dynamic analysis, OrcaFlex1. Introduction
Among humanity's steps toward carbon neutrality, hydrogen has been evaluated as an attractive energy source. Consequently, green-hydrogen production has emerged as an essential step towards creating a cleaner earth. In this context, floating green-hydrogen production platforms at sea are an attractive solution because they solve the territorial problems of production platforms. To produce such green hydrogen, renewable energy must be harnessed.
Several methods are available for producing renewable energy from oceans. Wave energy converters (WECs) are a means of producing renewable energy, and many studies have been conducted on this topic [1][2]. However, WECs cannot produce sufficient power to drive a floating production storage and offloading (FPSO) unit.
On the other hand, floating offshore wind turbines (FOWTs) are a viable renewable energy source that can meet the aforementioned needs, and many studies have already been conducted on floating wind power generation [3]-[7]. Several studies have been conducted on floating green-hydrogen systems using wind power generators. Lee et al. [8] conducted research on multi-objective optimization in the conceptual design stage of liquid-hydrogen FPSO units. Kim et al. [9] studied the riser configuration of a 15-MW FOWT, integrated with a green-hydrogen facility. Castillo et al. [10] proposed a novel platform, combining a hydrogen production facility with UMaine’s FOWT for offshore hydrogen production. Kim et al. [11] proposed a new production facility connecting a hydrogen-production FPSO with an FOWT, powering the FPSO with connection cables. The floating green-hydrogen production platform, which consists of an FPSO, producing hydrogen, and an FOWT, generating power for the FPSO, with a connection cable, can have a high effective tension in the long connection cable due to the self-weight (dead weight) of the cable. This can have a detrimental effect on the structural integrity of the cable. Attaching a buoyancy module can be one way to reduce this dead weight. Buoyancy modules are primarily used to create lazy wave shapes in umbilical cables or risers by utilizing their buoyancy. Significant amount of research has been reported on lazy-wave umbilical cables or risers [12]-[14].
However, little research has been conducted on floating green-hydrogen production platforms, and even less research has been conducted on platforms with connection cables attached to buoyancy modules. To fill this gap, this study investigated the dynamic behavior of a floating green-hydrogen production system with and without buoyancy modules attached to the power cable connecting the FPSO and FOWT.
A numerical simulation was performed to evaluate this dynamic behavior, OrcaFlex software was used to this end. Additionally, the dynamic behavior of the floating green-hydrogen platform was described under an operating condition, whereby power was produced from the FOWT.
2. System Design and Environmental Conditions
2.1 System Design
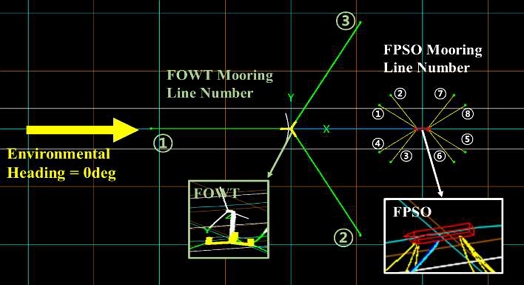
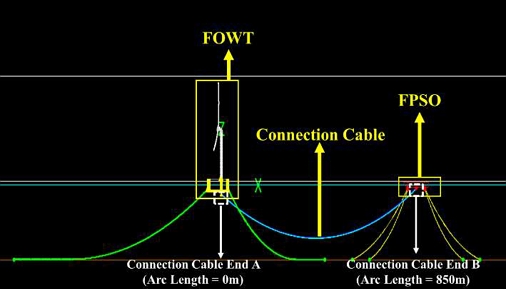
Figure 1 and Figure 2 show the top and side views of the floating green-hydrogen platform. The UMaine's FOWT was used with an IEC 15-MW reference provided by Orcina, as an example; for the FPSO, a 103-m long default vessel provided by OrcaFlex was used. Detailed properties of the configuration are given in references [15][16]. As shown in Figure 1, the power-producing FOWT was moored using a three-point mooring method, whereas the hydrogen-producing FPSO was moored using an eight-point mooring method. The FOWT’s mooring line used R4-grade studless chain with a bar diameter of 0.22 m, while the FPSO used oil rig quality (ORQ)-grade studless chain with a bar diameter of 0.18 m. Detailed properties of the mooring lines are listed in Table 1. Figure 2 also shows a connection cable between the FOWT and FPSO that transmits electricity. The connection cable was a power cable with an outer diameter of 0.17 m, and its detailed properties are listed in Table 2.
The mooring lines for the FOWT and FPSO were 830 and 340 m long, respectively. Additionally, as shown in Figure 2, the total length of the power connection cable was 850 m. Two cases were considered in this study. In the first case, buoyancy modules were attached to the connection cable, while in the second case, they were not attached. In the former, the buoyancy modules were attached to connection cable at intervals of 25 m throughout its length. Therefore, the total length of the connection cable, with the buoyancy modules attached was 850 m. Detailed properties of the buoyancy module are listed in Table 4. Finally, Table 5 lists the natural frequencies of the system, calculated through modal analysis.
2.2 Environmental Conditions
This study was conducted assuming normal operating conditions, under which power is produced by the FOWT. The water depth was set to 200 m, and environmental conditions, such as waves, wind, and currents, were considered.
Irregular waves were generated using the JONSWAP spectrum [17]. Additionally, the IEC Kaimal spectrum was used to consider turbulent wind speeds [18]. At this time, Turbsim v2.0, an open-source program, provided free of charge by National Renewable Energy Laboratory (NREL) in USA, was used to generate turbulent wind speeds; the generated turbulent wind speed model was loaded into OrcaFlex and numerical simulation was performed [18]. Finally, the sea-level speed of the current was set to 1.0 m/s, and the current profile was calculated using the 1/7 power law. Detailed properties of the environmental conditions are listed in Table 6 [11].
3. Results and Discussion
3.1 Static Analysis Results
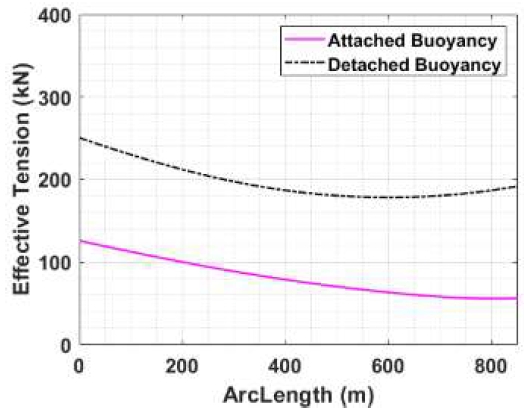
First, the effective tension in the connection cable was checked under static conditions to determine whether the buoyancy module reduced the self-weight of the cables. Figure 3 shows the effective tension applied to the connection cable in the static analysis as a function of the arc length. As shown in Figure 3, when the buoyancy module was attached, the tension was reduced by approximately 100 kN across the entire line. This shows that attaching buoyancy modules to the connection cable can effectively reduce the self-weight of the cable. Additionally, the effective tensions at ends A and B of the connection cable were different because of the difference in the measurement locations with respect to the vertical axis.
3.2 Dynamic Analysis Results
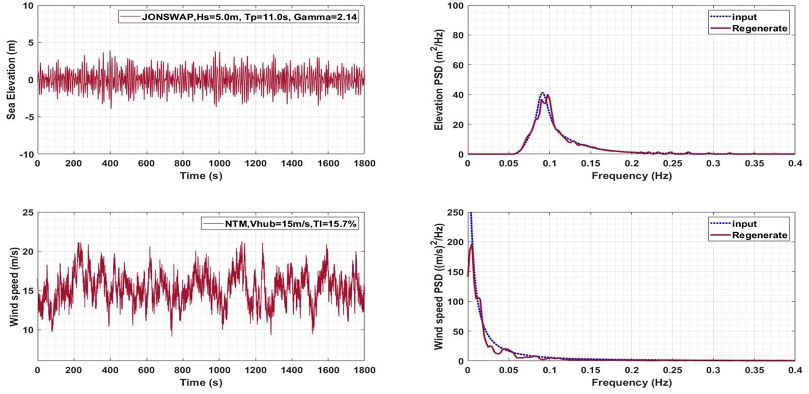
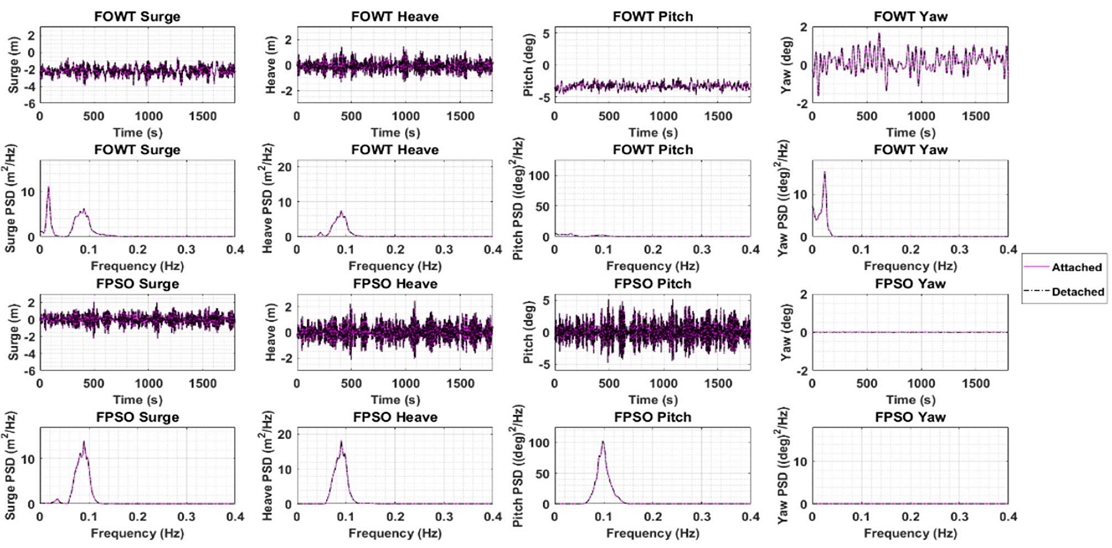
Next, a dynamic analysis was conducted to confirm the differences between the two aforementioned cases. The dynamic analysis time was set to 1800 s, with a ramp time of 250 s to gradually increase the wave height before 1800 s. Figure 4 shows the wave elevation and wind speed time series, and the spectra calculated from the simulation. The regenerated values obtained using the fast Fourier transform of the time series from the spectra were confirmed to be similar to the spectral input values. This means that all the design external forces were reflected, thus proving that the analysis time was reliable. Figure 5 shows the dynamic motion graph of the floater. In this study, only a 0° environmental heading was considered. In this case, the motion of the floater was dominated by surge, heave, and pitch. In the case of the FOWT, the yaw motion is also important for power generation; therefore, only the surge, heave, pitch, and yaw motions were considered in this study.
Figure 5 shows that almost no difference existed in the dynamic response of the floater irrespective of whether the buoyancy module was attached to the connection cable or not.
Moreover. Figure 5 shows that, in the surge power spectral density graph, in the case of FOWT, the surge direction natural frequency and wave peak at approximately 0.02 and 0.09 Hz, respectively had dominant influence. In contrast, in the case of FPSO, wave loads distributed at approximately 0.09 Hz dominated the FPSO surge motion. In the case of heave motion, it could be confirmed through the spectra that the wave had a major influence on both the FOWT and FPSO. As regards the pitch response, it was confirmed that the power spectral density of the FPSO was much higher than that of the FOWT, indicating that the pitch response of the FPSO was larger. This was also confirmed from a time series graph. Finally, in the case of yaw, the yaw response was more noticeable in the FOWT than in the FPSO. Additionally, a peak was observed at approximately 0.03 Hz in the yaw spectra of the FOWT. In this study, system control of the FOWT was achieved through a reference open-source controller (ROSCO)-based controller developed by the NREL [19][20]. This controller controlled the rotor speed via a PI controller based on the blade pitch angle above the rated wind speed, and the natural frequency of the pole of the pitch controller corresponding to the rated load condition was designed to be 0.03 Hz [21]. Therefore, the controller operation caused a peak in the yaw at approximately 0.03 Hz.
Subsequently, the effective tension and bending moment of the connection cable were checked to determine the dynamic changes in the connection cable depending on whether the buoyancy module was attached.
Figure 6 shows the dependence of the effective tension and bending moment of the connection cable as a function of the arc length. The maximum and average values of the effective tension decreased noticeably across the entire line when the buoyancy module was attached. The minimum value also suggested that negative tension might have been applied across the entire line when the buoyancy module was attached.
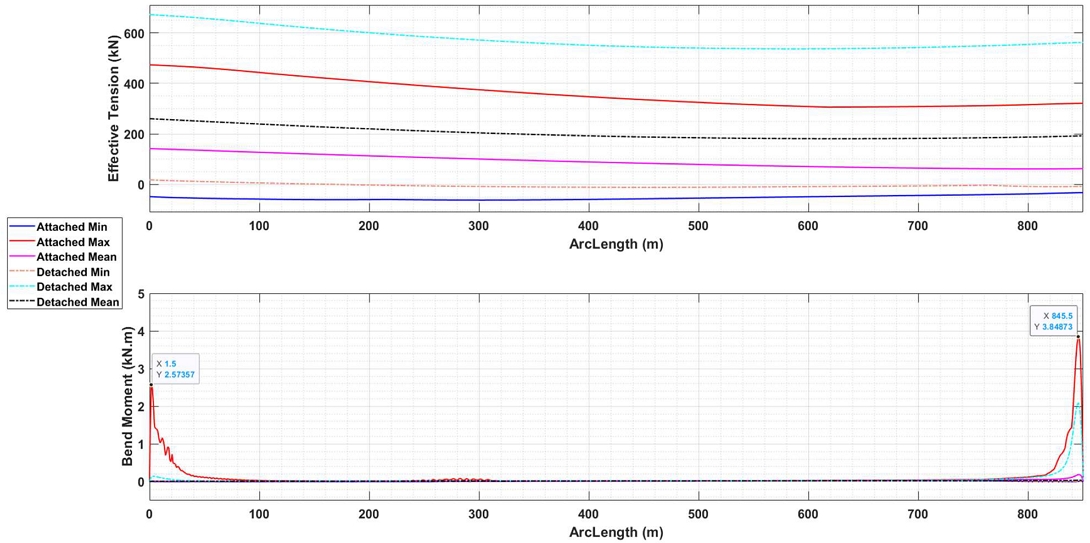
Maximum, minimum and average values of the effective tension and bending moment of the connecting cable depending on the arc length
Figure 6 suggests that attaching a buoyancy module might result in larger bending moments. It could be seen that a large bending moment was applied at 1.5 m close to the FOWT and 845.5 m close to the FPSO, based on the arc length. Furthermore, when the buoyancy module was not attached, in the vicinity of 1.5 m, the maximum value of the bending moment appeared to be almost nonexistent; however, when the buoyancy module was attached, the maximum value of the bending moment increased significantly. However, unlike around 1.5 m, the maximum bending moment around 845.5 m was observed to be greater than that around 1.5 m, even when the buoyancy module was not attached. Finally, the middle part of the cable was noticed to generate almost no bending moment compared with that at the ends.
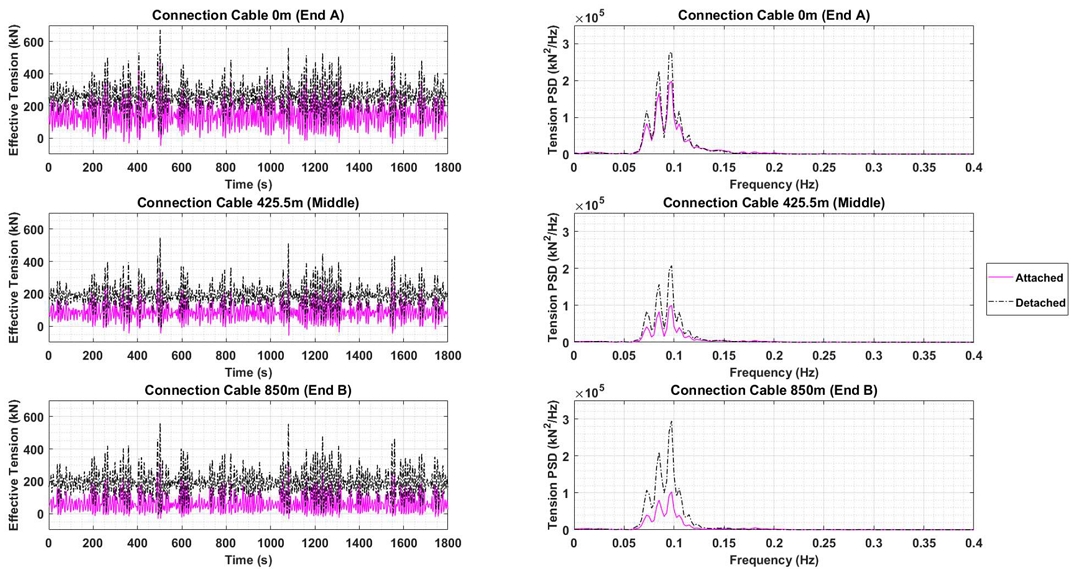
Figure 7 shows the time series and spectra of effective tension at ends A and B, and middle of the connection cable. From the time-series graph, the effective tension appears to decrease when buoyancy module was attached to ends A, and B, and the middle. Additionally, from the spectra, the power spectral density was found to be larger when the buoyancy module was not attached. This again shows that attaching a buoyancy module to the connection cable would be effective in reducing the tension. Looking at the power spectral density graph in the frequency domain, it appears that the wave load around 0.09 Hz had a dominant influence on the effective tension of the connection cable.
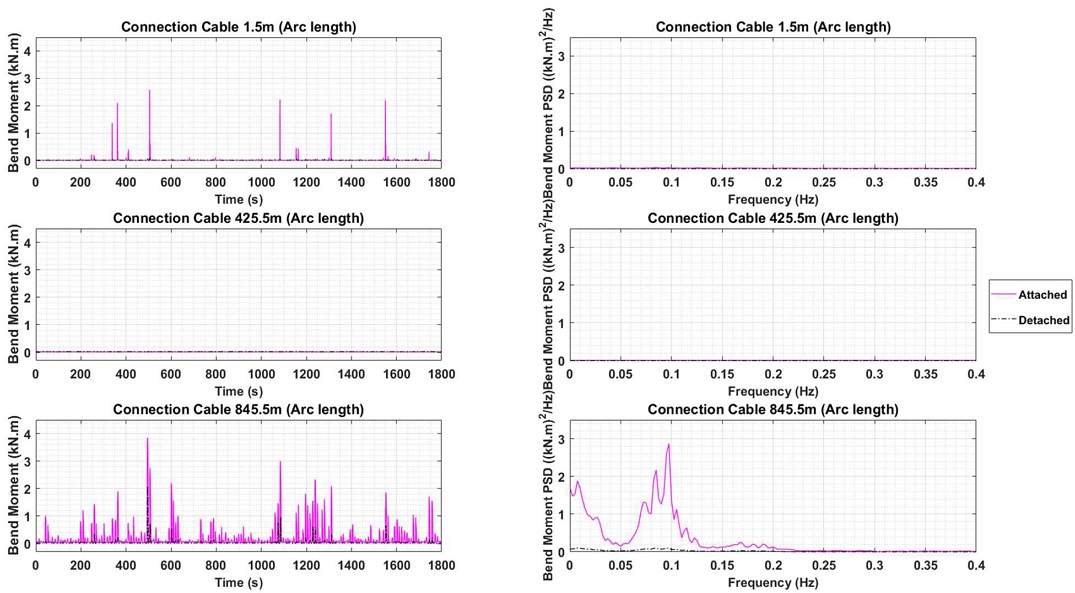
Figure 8 shows the time series and spectra of the bending moments at the beginning, middle, and end of the connection cable. In this case, because the boundary conditions at both ends of the connection cable were set to “hinged” rather than “fixed”, the values at 1.5 and 845.5 m were analyzed instead of at 0 and 850 m, respectively. Moreover, as can be seen in Figure 6, 1.5 and 845.5 m were the locations, where the maximum bending moment was reached at both ends, when the buoyancy module was attached. From the time-series graph in Figure 8, the change in the bending moment was found to be greater when the buoyancy module was attached than when it was not. Additionally, almost no change was observed in the bending moment at the middle part of the cable compared with that at both ends; the bending moment around 845.5 m of the connection cable showed a larger change in bending moment than around 1.5 m. Additionally, in the spectrum around 845.5 m, in addition to the wave peak around 0.09 Hz, a low-frequency peak around 0.01–0.02 Hz occurred, which was believed to be a peak due to the natural frequency of the surge direction of the FOWT. This sudden change in the bending moment could have a significant negative impact on the fatigue damage of the cable. This suggests that further research is required on the fatigue damage caused by a change in the bending moment owing to the attachment of buoyancy modules.
In conclusion, in the dynamic analysis, attaching the buoyancy module to the connection cable did not significantly affect the floater motion. However, the effective tension of the connection cable was confirmed to be reduced when the buoyancy module was attached. This suggests that when designing a connection cable attaching a buoyancy module can be one way to reduce the effective tension in the cable without affecting the floater. However, the large change in the bending moment of the connection cable with the buoyancy module attached may precipitate cable fatigue damage; therefore, further research is needed on this issue.
4. Conclusion
This paper describes changes in a floating green-hydrogen production system, when a buoyancy module is attached to its power connection cable. This was performed assuming that the operating conditions were such that power was produced by the floating offshore wind turbine, and the results were as follows:
- 1. The static analysis confirmed that when the buoyancy module was attached, the effective tension of the connection cable decreased throughout the line.
- 2. The dynamic analysis revealed that the buoyancy module attached to the connection cable had no significant effect on the motion of the floater.
- 3. In the dynamic analysis, the time-series graph confirmed that the effective tension of the connection cable decreased significantly when the buoyancy module was attached.
- 4. Furthermore, in the time-series graph, around 845.5 m the bending moment changed to a greater degree when the buoyancy module was attached.
Future research plans include investigating the dynamic behavior of a floating green-hydrogen system in extreme conditions, such as mooring line breakage. Additionally, follow-up studies on fatigue damage caused by changes in the bending moments will be conducted.
Acknowledgments
This work was supported by the Korea Institute of Energy Technology Evaluation and Planning (KETEP) grant funded by the Korea government (MOTIE) (20213000000020, Development of core equipment and evaluation technology for construction of subsea power grid for offshore wind farm).
Author Contributions
Conceptualization, S. M. Kim and W.C. Chung; Methodology, S. M. Kim and W.C. Chung; Software, S. M. Kim and W.C. Chung; Formal Analysis, S. M. Kim; Investigation, S. M. Kim and W.C. Chung; Resources, S. K. Lim and W.C. Chung; Data Curation S. M. Kim and W.C. Chung; Writing-Original Draft Preparation, S. M. Kim; Writing-Review & Editing, S. K. Lim and W.C. Chung; Visualization, S. M. Kim; Supervision, S. K. Lim and W.C. Chung; Project Administration, S. K. Lim and W.C. Chung; Funding Acquisition, S. K. Lim and W.C. Chung.
References
-
C. -K. Jin, H. -Y. Kang, M. -H. Kim, and I. -H. Cho, “Performance estimation of resonance-enhanced dual-buoy wave energy converter using coupled time-domain simulation,” Renewable Energy, vol. 160, pp. 1445-1457, 2020.
[https://doi.org/10.1016/j.renene.2020.07.075]

-
C. -K. Jin, H. -Y. Kang, M. -H. Kim, and F. P. Bakti, “Performance evaluation of surface riding wave energy converter with linear electric generator,” Ocean Engineering, vol. 218, 108141, 2020.
[https://doi.org/10.1016/j.oceaneng.2020.108141]

-
I. -J. Lee, M. -H. Kim, and C. -K. Jin, “Impact of hull flexibility on the global performance of a 15 MW concrete-spar floating offshore wind turbine,” Marine Structures, vol. 100, 103724, 2025.
[https://doi.org/10.1016/j.marstruc.2024.103724]

-
Y. -H. Bae and M. -H. Kim, “Coupled dynamic analysis of multiple wind turbines on a large single floater,” Ocean Engineering, vol. 92, pp. 175-187, 2014.
[https://doi.org/10.1016/j.oceaneng.2014.10.001]

-
Y. -H. Bae and M. -H. Kim, “Rotor-floater-tether coupled dynamics including second-order sum–frequency wave loads for a mono-column-TLP-type FOWT (floating offshore wind turbine),” Ocean Engineering, vol. 61, pp. 109-122, 2013.
[https://doi.org/10.1016/j.oceaneng.2013.01.010]

-
Y. -H. Bae, M. -H. Kim, and H. -C. Kim, “Performance changes of a floating offshore wind turbine with broken mooring line,” Renewable Energy, vol. 101, pp. 364-375, 2017.
[https://doi.org/10.1016/j.renene.2016.08.044]

-
D. Kim, Y. -H. Bae, and S. -M. Park, “Design strategy for resonance avoidance to improve the performance of tension leg platform-type floating offshore wind turbines,” Ocean Engineering, vol. 306, 118080, 2024.
[https://doi.org/10.1016/j.oceaneng.2024.118080]

-
J. -H. Lee, B. -W. Park, K. -H. Kim, and W. -S. Ruy, “Multi-objective optimization of liquid hydrogen FPSO at the conceptual design stage,” International Journal of Naval Architecture and Ocean Engineering, vol. 15, 100511, 2023.
[https://doi.org/10.1016/j.ijnaoe.2022.100511]

-
S. -J. Kim and S. -J. Park, “Riser configuration design for a 15-MW floating offshore wind turbine integrated with a green hydrogen facility”, Journal of Ocean Engineering and Technology, vol. 38, pp. 137-147, 2024.
[https://doi.org/10.26748/KSOE.2024.048]

-
C. -A. R. Castillo, M. Collu, and F. Brennan, “Design considerations and preliminary hydrodynamic analysis of an offshore decentralised floating wind-hydrogen system,” International Journal of Hydrogen Energy, vol. 89, pp. 496-506, 2024.
[https://doi.org/10.1016/j.ijhydene.2024.09.340]

- S. -M. Kim and W. -C. Chung, “Dynamic response of floating green hydrogen production system with various connection power cable outer diameters under operating conditions,” Journal of Wind Energy, vol. 15, pp. 62-71, 2024 (in Korean).
-
S. -J. Kim and M. -H. Kim, “Dynamic behaviors of conventional SCR and lazy-wave SCR for FPSOs in deepwater,” Ocean Engineering, vol. 106, pp. 396-414, 2015.
[https://doi.org/10.1016/j.oceaneng.2015.06.039]

-
W. -C. Chung, M. -H. Kim, and C. -K. Jin, “Real-time trace of riser profile and stress with numerical inclinometers,” Ocean Engineering, vol. 234, 109292, 2021.
[https://doi.org/10.1016/j.oceaneng.2021.109292]

-
W. -C. Chung, C. -K. Jin, and M. -H. Kim, “Dual-algorithm hybrid method for riser structural health monitoring using the fewest sensors,” Journal of Marine Science and Engineering, vol. 10, 1994, 2022.
[https://doi.org/10.3390/jmse10121994]

-
C. Allen, A. Viselli, H. Dagher, A. Goupee, E. Gaertner, N. Abbas, M. Hall, and G. Barter, Definition of the UMaine VolturnUS-S Reference Platform Developed for the IEA Wind 15-Megawatt Offshore Reference Wind Turbine, Number of Technical Report, National Renewable Energy Laboratory, U. S., 2020, Available: https://www.nrel.gov/docs/fy20osti/76773.pdf, .
[https://doi.org/10.2172/1660012]

- Orcina Ltd, Orcaflex User Manual, U.K., 2024.
- N. D. P. Barltrop, A. J. Adams, Dynamics of Fixed Marine Structure, Butterworth Heineman, 2013.
- B. J. Jonkman, TurbSim User’s Guide v2.00.00, Number of Technical Report, National Renewable Energy Laboratory, U.S., 2014.
-
N. J. Abbas, D. S. Zalkind, L. Pao, and A. Wright, “A reference open-source controller for fixed and floating offshore wind turbines,” Wind Energy Science, vol. 7, pp. 53-73, 2022.
[https://doi.org/10.5194/wes-7-53-2022]

- ROSCO toolbox. https://github.com/NREL/ROSCO_toolbox, .
-
E. Gaertner, J. Rinker, L. Sethuraman, F. Zahle, B. Anderson, G. Barter, N. Abbas, F. Meng, P. Bortolotti, W. Skrzypinski, G. Scott, R. Feil, H. Bredmose, K. Dykes, M. Shields, C. Allen, and A. Viselli, IEA Wind TCP Task 37: Definition of the IEA 15-Megawatt Offshore Reference Wind Turbine., 2020, Available:
[https://doi.org/10.2172/1603478]


