DeRiskbeta: Comparative Quantitative Risk Assessment (QRA) of fuel oil, LNG, methanol, and ammonia on a 15,000 TEU containership
Copyright © The Korean Society of Marine Engineering
This is an Open Access article distributed under the terms of the Creative Commons Attribution Non-Commercial License (http://creativecommons.org/licenses/by-nc/3.0), which permits unrestricted non-commercial use, distribution, and reproduction in any medium, provided the original work is properly cited.
Abstract
To reduce carbon emissions, the maritime industry is transitioning to alternative low- or zero-carbon fuels, but this shift also introduces significant design, economic, and safety challenges. This paper focuses on safety, particularly the need to demonstrate equivalence to conventional fuels. A comparative Quantitative Risk Assessment (QRA) of a 15,000 TEU containership using fuel oil, LNG, methanol, and ammonia was conducted with the DeRiskbeta tool. The QRA evaluates both fuel-specific and overall risks, assessing key fuel-related hazards (fires, explosions, and toxic exposures) and other non-fuel-related hazards (collisions, contacts, groundings, and foundering). The results indicate that LNG increases fuel-specific risk fivefold due to explosion and jet fire hazards, though overall risk remains marginally higher. Methanol exhibits a risk level similar to fuel oil. Ammonia presents the highest risk, with a 22-fold increase in fuel-specific risk and a 23% rise in overall societal risk due to its toxicity. These findings highlight the need for additional risk mitigation for ammonia to achieve equivalent safety. The study provides valuable insights to support decision-making in safe ship design and fuel selection.
Keywords:
DeRiskbeta, Quantitative Risk Assessment (QRA), Alternative fuel, LNG, Methanol, Ammonia, Individual risk, Societal risk, Potential Loss of Life (PLL)1. Introduction
1.1 Background
To reduce carbon emissions, the maritime industry is exploring the transition to alternative fuels, such as Liquefied Natural Gas (LNG), methanol, and ammonia. This transition, however, introduces significant uncertainties related to alternative fuel availability, technology readiness, costs, regulatory compliance, and safety. Safety is a critical concern as these fuels introduce unique hazards and varying safety risks compared to conventional fuel.
To better understand the safety risks associated with different alternative fuels, a Quantitative Risk Assessment (QRA) using the tool DeRiskbeta was undertaken for containerships with similar configuration but operating on different alternative fuels: LNG, methanol, and ammonia.
Several studies have examined QRA for ships using alternative fuels. Davies (Lloyd’s Register) [1] proposed a QRA model for an LNG-fuelled ship, suggesting that the model can be used to identify potential safeguards and to better understand the safety risks to crews onboard. Jeong [2] conducted a QRA on high-pressure fuel gas supply system for an LNG-fuelled ship, highlighting a high explosion risk in the fuel preparation room. Franks (Lloyd’s Register) [3] performed a QRA on a feeder container and an MR tanker using ammonia as fuel to calculate the individual risk to crew and investigated various risk reduction measures to reduce the risk to a tolerable level. However, these studies did not provide the overall risk level of alternative fuelled ships, nor did they compare safety risks across different fuels.
This comparative QRA calculated both the overall and fuel-specific risks associated with conventional fuel oil, LNG, methanol, and ammonia. This approach not only facilitates a comparison of safety risk levels and their primary risk contributors but also provides an opportunity to assess whether each alternative fuel can achieve an equivalent level of safety to conventional fuel. Such insights are valuable in helping decision-making in safe ship design and fuel selection.
1.2 Additional Hazards presented by Alternative Fuels
The principal hazard associated with conventional fuels, such as fuel oil, marine diesel oil, and related distillates, is fire, primarily pool fire and accompanying smoke. In contrast, alternative fuels, which are either gaseous or low flashpoint fuels, present a multitude of hazards, and these can result in consequences that are significantly different from those of traditional fuels. Table 1 summarises the hazards and potential consequences associated with conventional fuel oil, LNG, methanol, and ammonia [4].
1.3 Equivalent Level of Safety
Ships employing alternative fuels, other than those covered under the International Code for the Construction and Equipment of Ships Carrying Liquefied Gases in Bulk (IGC Code), must demonstrate that their designs meet the safety goals and functional requirements within the IMO's International Code of Safety for Ships using Gases or other Low-flashpoint Fuels (IGF Code). The IGF code stipulates that the safety, reliability, and dependability of the systems shall be equivalent to that achieved with new and comparable conventional oil-fuelled main and auxiliary machinery [5][6]. Therefore, to help demonstrate compliance with the IGF code, it is useful to identify both the overall and fuel safety risk levels of conventional oil-fuelled ships and alternative-fuelled ships.
It is important to note that ‘equivalent’ does not necessarily mean ‘equal’. ‘Equal’ suggests an identical level of risk, whereas ‘equivalent’ implies a comparable level of risk that is considered tolerable or acceptable. For designs using alternative fuels, it is a reasonable requirement that the safety risk is equivalent to fuel oil, but not necessarily equal.
2. Safety Risk of Conventional Containerships
2.1 Generic Vessel Design
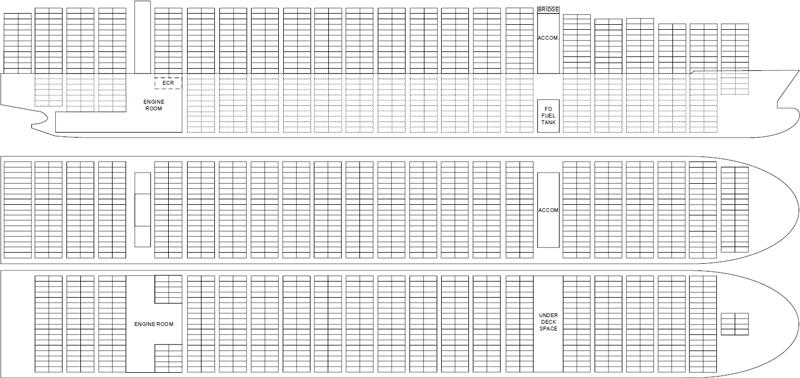
To compare the risks of ships using conventional fuel oil with those using alternative fuels, a specific vessel design was defined. Accordingly, a 15,000 TEU containership was selected as a basis for the comparison. The general arrangement of the vessel and main particulars are presented in Figure 1 and Table 2, respectively.
2.2 Overall Safety Risk of Conventional Containerships
As part of an EU-funded research project titled SAFEDOR (Design, Operation, and Regulation for Safety), high-level Formal Safety Assessment (FSA) studies were conducted on various ship types, including containerships, in accordance with the FSA guideline [7]. The FSA is a structured and systematic methodology aimed at enhancing maritime safety through the assistance of risk assessment. It assists in evaluating new regulations or comparing existing and proposed regulations, providing a basis for the IMO’s decision-making.
The FSA on containerships was undertaken and submitted by Denmark as MSC 83/21/2 and MSC 83/INF.8 [8][9]. The study developed a generic risk model to provide an overview of the risk and calculated that the risk can be considered to be within the As Low As Reasonably Practicable (ALARP) region. However, the casualty statistics and accident frequencies used are outdated (1993-2004) so it may not represent the safety risk of the vessels currently operating at sea. To update the IMO FSA risk model, the recent casualty data and ship data for containerships were analysed using Sea-Web [10], resulting in revised incident frequencies for the major accident categories.
Table 3 summarises these updated incident frequencies for the period 2014-2023. The original event trees in the risk model and their branch probabilities were retained but, the model now reflects recent data. The number of crew was also adjusted to 23 to align with the vessels studied.
The updated FSA risk values are shown in Table 4, estimating the Potential Loss of Life (PLL) of a containership at 4.69E-03 fatalities per year per ship (i.e. per ship-year).
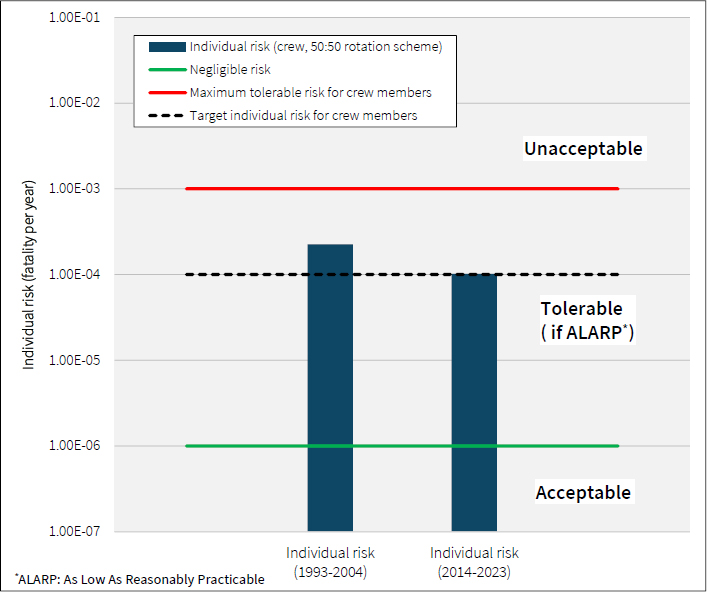
Individual risk (IR) represents the annual likelihood of fatality for a specified individual. Based on the updated FSA risk model, the average individual risk for containership crew is approximately 1.02E-04 fatality per year, assuming uniform exposure to the incidents in Table 4, and a crew of 23 working on 50:50 rotation scheme (i.e. 4.69E-03/23*0.5). This figure is broadly comparable with those reported by EMSA for all ship types, which have varied between 4.5E-05 fatality per year and 9.7E-05 fatality per year over the period 2018-2022, with a five year average of 7.58E-05 [11].
Figure 2 presents the individual risks for containership crew along with the individual risk criteria proposed in MSC 72/16 [12]. These criteria are consistent with those published by the UK Health & Safety Executive (HSE) [13] which are widely adopted by governments and other industries:
- • Maximum tolerable IR for crew member: 1E-03 per year
- • Negligible IR for crew member: 1E-06 per year
- • Target IR for crew member (new ships): 1E-04 per year
Figure 2 shows that the individual risk for containership crew is within the ‘Tolerable (if ALARP)’ region and aligns well with the target individual risk for new ships.
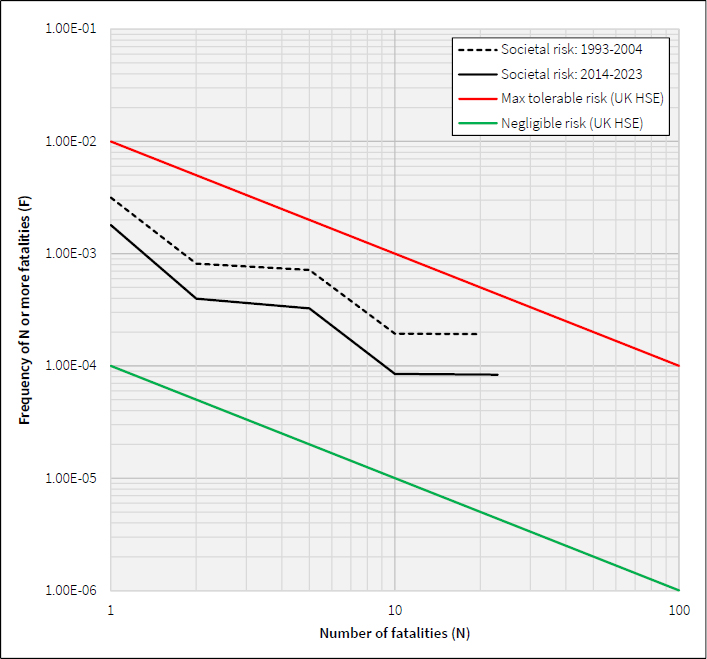
Societal risk, also known as group risk, is the average risk experienced by a group of people exposed to accidents. It accounts for the number of people at risk and the potential for multiple fatalities from hazardous events. The societal risk is typically depicted using a Frequency-Number (FN) curve.
The societal risk to the containership crew is presented in Figure 3 alongside the societal risk acceptance criteria proposed by the UK HSE. The UK HSE suggested that the risk of an accident causing 50 or more fatalities in a single event should be regarded as intolerable if it occurs more than once every 5,000 years [13]. Additionally, a risk of two orders of magnitude below the intolerable region is considered broadly acceptable [14][15]. These criteria provide a useful reference for illustrating societal risk.
IMO MSC 72/16 [12] also proposed societal risk acceptance criteria, however, the criteria incorporated (unlike most criteria) the financial value of activities. This study chose not to adopt IMO MSC 72/16, as these criteria are not widely adopted by industry and regulators.
2.3 Risk of Conventional Fuel Oil
The primary risks associated with conventional fuels stem from fire and explosion incidents. The recent accident records (2014-2023), summarised in Table 5 [10], indicate 5 fatal incidents in engine rooms out of 150 fire and explosion incidents. Additionally, studies on engine room fires [16][17] suggest that approximately 60% of engine fires and explosions are related to fuel oil systems. Assuming this percentage, the fuel-specific risk (PLL) is estimated to be approximately 5.13E-05 fatalities per ship-year. This figure represents only about 1.1% of the total risk of 4.69E-03 fatalities per ship-year.
3. Quantitative Risk Assessment (QRA)
3.1 QRA Methodology
QRA uses expert judgement to select a representative set of events, numerical models to estimate potential consequences, operational and empirical data to estimate likelihood, and numerical models to calculate and aggregate the risk, providing measures that can be compared against established criteria [18][19][20]. This approach enables the systematic estimation of risks associated with alternative fuels by evaluating the likelihood and consequences of critical hazardous events. These events include jet fires, pool fires, flash fires, vapour cloud explosions and toxic gas releases.
The main steps in the QRA and subsequent risk evaluation and decision making, are as follows:
- • Hazard identification - identifies potential hazards and selects hazardous events for analysis;
- • Likelihood analysis - estimates the likelihood of hazardous events;
- • Consequence analysis - determines the potential outcomes resulting from the hazardous events;
- • Risk determination - combines the likelihood and consequences of the hazardous events to provide numerical risk values. All the calculated risks are summed to determine both individual and societal risks;
- • Risk evaluation - compares the overall risk against acceptance criteria. The risk can be acceptable, tolerable if reduced to As Low as Reasonably Practicable (ALARP), or unacceptable; and
- • Decision making - considers potential risk control options and makes decisions based on the risk evaluation results.
3.2 Scope of QRA
This QRA focuses on the safety risks associated with alternative fuels during seagoing operations and excludes bunkering operations. Bunkering operations are excluded because they involve additional considerations beyond the scope of this study, such as risks to third party personnel, including bunker operators, shoreside workers, crew on nearby vessels, and local residents. Additionally, this study assumes that traditional fuel or shore power is used for power generation while the vessel is berthed in port.
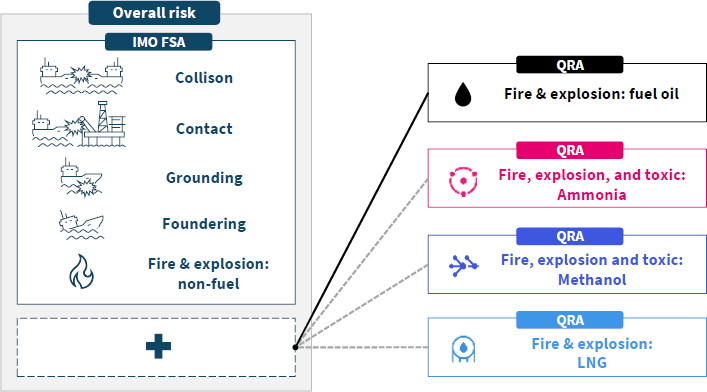
To estimate the overall risk of the vessel, the QRA results are combined with the updated IMO FSA risk model, as illustrated in Figure 4.
To support the QRA, the tool DeRiskbeta was developed and used to support likelihood analysis, consequence analysis, and risk calculation and evaluation for both fuel-specific and overall risks.
3.3 Hazard Identification
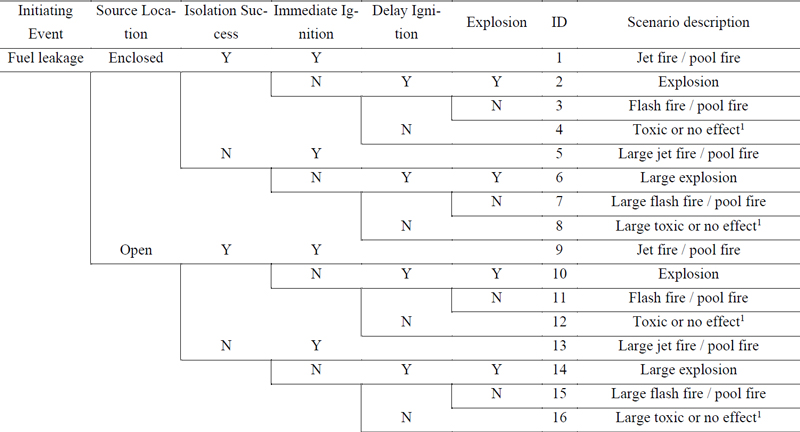
The QRA considered major hazardous events associated with fuel releases, modelled using the event tree shown in Table 6. These events encompassed:
- • jet, pool and flash fires;
- • vapour cloud explosions; and
- • toxic gas dispersion/impact.
3.4 Likelihood analysis
Historical data on fuel leaks in the maritime industry are limited. Consequently, data from the oil and gas industry were utilised, following Moon [21], who concluded that such data provide a reasonable basis for initial risk calculation. Leak frequency data from the International Association of Oil & Gas Producers (IOGP), covering events from 1992 to 2015 [22], were used.
While the IOGP offers two data sets—1992–2015 and 2006–2015—the more conservative data set (1992–2015) was selected to address uncertainty in leak frequency.
The alternative fuel system was divided into isolatable sections, and the fuel release frequencies estimated for each section based on the following leak hole size ranges, using the IOGP data:
- • hole diameter: 1–3 mm;
- • hole diameter: 3–10 mm;
- • hole diameter: 10–50 mm; and
- • hole diameter: 50 mm to full-bore rupture.
For the components with double barriers, such as double walled pipes, the leak frequencies were adjusted with reduction factors of 100, 75, and 10 for the respective ranges of 1–3 mm, 3–10 mm and over 10 mm hole diameters [23][24].
Collision and grounding incidents at the fuel tank location can also lead to fuel releases. The likelihood of such occurrences has been derived by rearranging the collision and grounding event trees from the IMO FSA containership study [9]. In addition to the likelihood of critical damage by collisions and groundings, the likelihood of collision within the vicinity of the fuel tank was assumed to be 10%, considering the ratio of the fuel tank length and vessel length. This resulted in 1.8% of collisions and 2.2% of groundings leading to a fuel release.
If a fuel release is to escalate into a fire or explosion, ignition must occur. The probability of ignition is a critical factor. However, there are a limited number of ignition probability models that can cover the alternative fuels considered in this study. In this study, the ignition probability model proposed by CCPS [25] was adopted as it accounts for different characteristics of fuels and release locations. The CCPS level 3 model provides the probabilities of immediate ignition, delayed ignition, and explosion given delayed ignition, considering the following factors:
- • immediate ignition
- o Minimum Ignition Energy (MIE)
- o Pressure
- o Temperature
- o Auto Ignition Temperature (AIT)
- • delayed ignition
- o Ignition strength
- o MIE
- o Release rate and duration
- o Phase (gas / liquid)
- o Flash / boiling point
- o Degree of enclosure (open / enclosed)
- o Room volume
- o Ventilation rate
- • explosion given delayed ignition
- o Fundamental burning velocity
- o Release location
- o Release rate
3.5 Consequence Analysis
Fuel release rates were estimated using formulas from IEC 60079-10-1 [26] for liquid, gas, and evaporating pool scenarios. Conservatively, the fuel release rate was assumed constant at the maximum flow rate.
The geometric mean diameter of each leak size range was selected as a representative hole size for calculating the release rate as recommended by IOGP [22].
The fuel piping in the tank connection spaces and fuel preparation rooms was assumed to have drip trays [5][6] and that released fuel could overflow onto the floor if drip tray volumetric capacity was exceeded.
For releases of superheated liquid, the flash and spraying fraction were calculated using Equation (3) [18] and Equation (4) [27] to estimate the total air born mass.
| (3) |
Fflash flash fraction of released liquid (unitless).
Cp average heat capacity of the liquid over T to Tb (J/kg⋅oC).
T initial temperature (oC).
Tb atmospheric boiling temperature (oC).
hfg latent heat of vaporisation of the liquid at Tb (J/kg).
| (4) |
Fspray spraying fraction of released liquid (unitless).
In the calculations, fuel properties from CoolProp library [28] were used.
For fuel leakages in enclosed spaces, it was assumed the isolation valve closed within 30 seconds after the average gas concentration reached shutdown limits, indicating gas detection activation. In open spaces, the isolation time was assumed to be 2 minutes, and the fuel inventory within the isolated section was assumed to continue releasing until fully depleted.
An isolation failure probability of 3.16E-02 was used, assuming that the isolation system has safety integrity equivalent to Safety Integrity Level (SIL) 1 [29][30]. This value is the geometric mean of the average probability of dangerous failure on demand (PFDavg) values of 0.1 and 0.01, which are boundary limits for SIL 1. Given isolation failure, operators were assumed to manually isolate the leak within 30 minutes.
The effects of jet fires, pool fires, flash fires, explosions, and toxic gas dispersions in open spaces were modelled using GEXCON RiskCurves software (version 12.2.0) [31][32]. The results were then imported into DeRiskbeta to estimate fatality probabilities. The fatality probabilities were calculated based on the size and direction of the lethal effect zone, the proportion of the receptor’s area affected, and whether people were indoors or outdoors.
For jet fires and pool fires in enclosed spaces, the fatality probabilities were estimated based on the ratio of the room area to the lethal effect zone area.
When determining the lethality and boundary failure by fires, the heat radiation levels recommended by IOGP [33][34] were adopted.
Typically, fuel handling equipment is located within enclosed spaces. Gas releases in enclosed spaces behave differently compared to those in open environments, necessitating a distinct modelling approach. Gas concentration in enclosed spaces was calculated using Equations (5) and (6) from Harris [35], which assumes perfect and instantaneous mixing of the released gas with air.
For gas concentration at time (t) after a leak,
| (5) |
For gas concentration at time (t) after leak isolation,
| (6) |
C(t) gas concentration in an enclosure at time, t (s).
C0 gas concentration at the isolation (unitless).
Qg release rate of flammable gas (m3/s).
Q2 flow rate of air-gas mixture leaving the room (m3/s).
f ventilation inefficiency factor, assumed 1.5.
V effective volume of the enclosure (m3).
For dense gas, the effective volume from the ‘bottom’ of the space to 5 m height was assumed.
Explosion overpressure in enclosed spaces is primarily due to the expansion of burned gases, rather than a blast wave. The maximum overpressure at any boundary was estimated using Equation (7) [36]. This calculation assumes a well-sealed enclosure without explosion relief panels and the maximum gas concentration observed during fuel releases was used to determine the amount of fuel (from Equations (5) and (6)).
| (7) |
∆p peak overpressure at walls.
P0 atmospheric pressure.
V volume of the enclosure (m3).
VFuel expanded volume of the released fuel (m3).
VStoich volume of the stoichiometric mixture of the fuel (m3).
σ expansion ratio of the stoichiometric mixture of the fuel.
γ specific heat ratio of air.
It was assumed that the enclosures are designed to withstand a maximum overpressure of 0.5 bar and where an explosion scenario exceeds this limit, escalation to adjacent spaces was assumed.
Fatality probabilities from toxic gas releases were estimated using a probit function, given in Equation (8) [20][37].
| (8) |
Pr probit value.
C gas concentration (mg/m3).
t exposure time (minutes).
a -15.6 for ammonia and -20.83 for methanol.
b 1 for both ammonia and methanol.
n 2 for both ammonia and methanol.
For open spaces, the size of a 50% lethal toxic dose zone was calculated using RiskCurves and then imported into DeRiskbeta to estimate the number of fatalities. For indoor receptors, the fatality probability was recalculated based on the average toxic concentration in the room, using Equation (9) [38] over the release period and the associated toxic dose.
| (9) |
CIndoor(t) concentration at time, t (s).
nv ventilation frequency of the room (s-1).
For enclosed spaces, the gas concentrations from Equations (5) and (6) were used to calculate the toxic dose and the corresponding fatality probability was derived using Equation (8). It was assumed that crew members have a 40% chance of failing to escape Error! Reference source not found. with complete escape impairment if a 1% lethal toxic dose occurs within two minutes.
Toxic gas release through ventilation outlets was also modelled as an open-space gas release with average concentration determined by in Equations (5) and (6) along with the relevant ventilation rate.
3.6 Risk Determination
Based on the likelihood and consequence analyses for each hazardous event involving alternative fuels, the risk was calculated and aggregated using the following measures:
Individual risk for each crew group, expressed in fatality per year;
Societal (or group) risk for crew members, expressed in Potential Loss of Life (PLL) per year and as an FN curve.
3.7 Verification of the QRA
To verify the QRA methodology, the safety risk of conventional fuel was calculated using DeRiskbeta (with the QRA methodology discussed in Sections 3.1 to 3.6) and results compared with the risk values derived from the historical accident records in Section 2.3. For these QRA calculations, Marine Diesel Oil (MDO) was chosen as the conventional fuel (for illustrative purposes). During the ignition probability estimation, the minimum ignition energy of MDO was assumed to be 5 mJ, acknowledging that high-flashpoint liquids, when leaking under pressure, have the potential to create a flammable mist that may ignite for spark energies less than 5 mJ [39][40].
The QRA results for the 15,000 TEU containership using conventional fuel oil are summarised in Table 7. The calculated fuel-specific (MDO) risk in Potential Loss of Life (PLL) is 4.97E-05 fatalities per year, which closely aligns with the historical record for conventional fuel of 5.13E-05 fatalities per year.
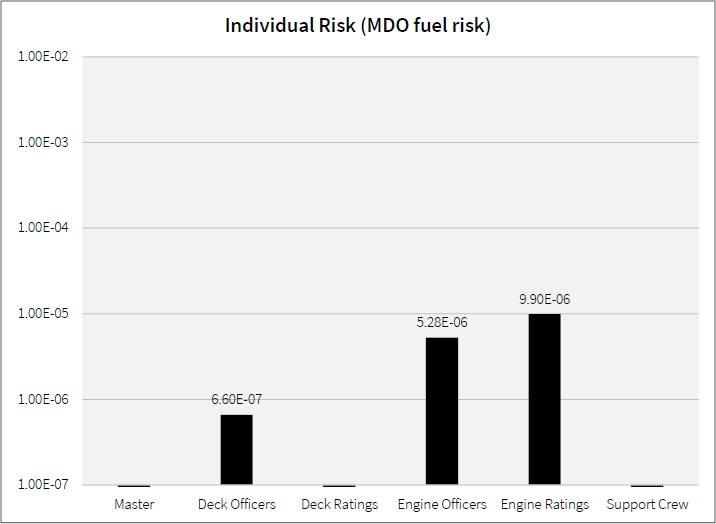
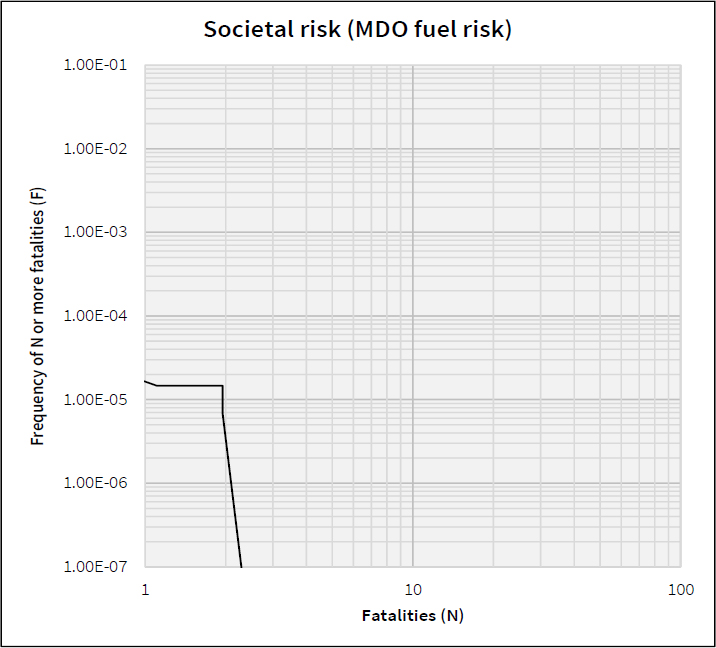
Figure 5 and Figure 6 illustrate the individual and societal fuel-specific (MDO) risks, respectively. The primary risk is concentrated among engine department crew members, with pool fire events in the engine room identified as the dominant contributors, leading to one to two fatalities.
The QRA results provide a reasonable estimate to the historical evidence. However, it is important to acknowledge that QRA provides indicative estimates, particularly when operating experience is limited. Its primary role is to support decision-makers in understanding the risk profile and evaluating and selecting risk control options (i.e. design/safeguard options).
4. Risks of Ships using Alternative Fuels
4.1 Vessel Designs for QRA
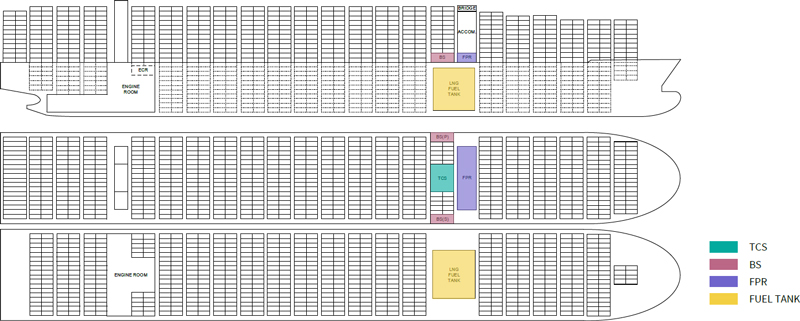
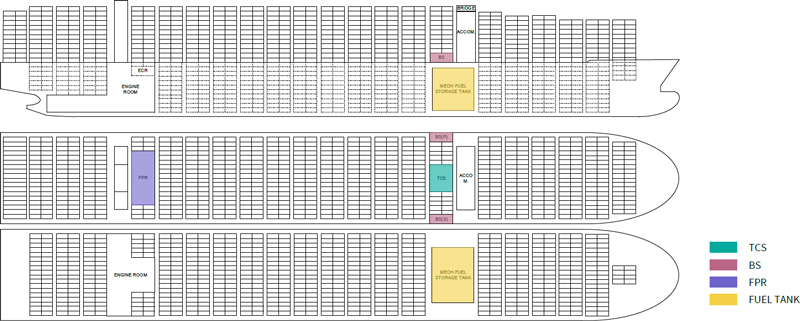
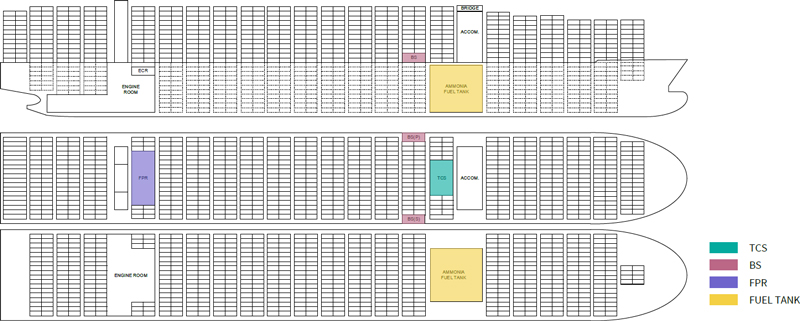
Based on the conventional containership design described in Section 2.1, alternative fuel designs for LNG, methanol, and ammonia were developed. These designs maintained the same general arrangement, with modifications limited to the fuel systems and associated arrangements. Figure 7, Figure 8, and Figure 9 show the general arrangements for LNG, methanol, and ammonia designs, respectively.
The fuel tank sizes differ due to the calorific value of each fuel: 12,000 m³ for LNG, 18,000 m³ for methanol, and 21,000 m³ for ammonia. The ammonia-fuelled vessel is 4 m longer to accommodate its larger tank. The location of the Fuel Preparation Room (FPR) also varies; for LNG the FPR is below the accommodation block and in the methanol/ammonia designs, near to the engine room. The Bunker Station (BS) for the ammonia design was relocated to meet toxic zone requirements, as per LR Rules [6].
The Tank Connection Spaces (TCSs) and FPRs have forced mechanical ventilation at 30 air changes per hour (ACH) in accordance with LR Rule requirements [6]. The LNG and methanol BSs are in open spaces, but the ammonia BS is enclosed and fitted with mechanical ventilation at 30 ACH. The accommodation and engine room are assumed to have ventilation rates of 6 and 10 ACH, respectively. For the ammonia design, the accommodation air intake is equipped with an automatic closing device that activates upon ammonia detection [6].
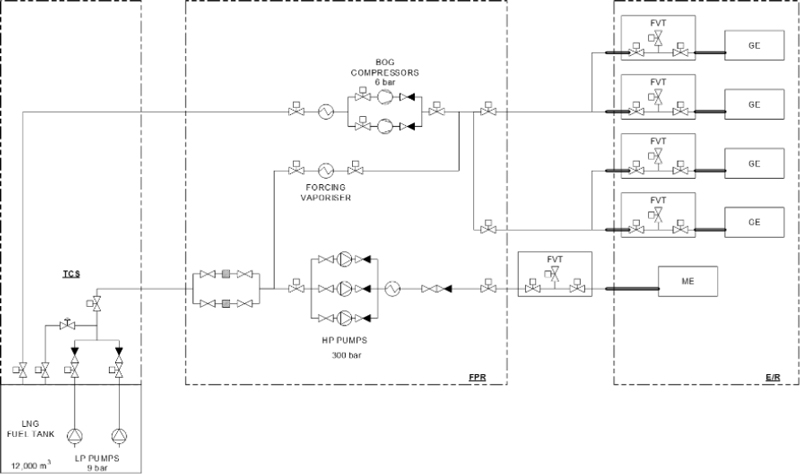
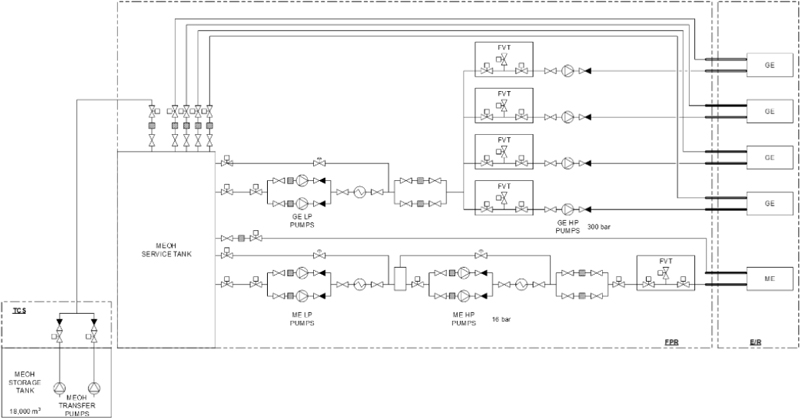
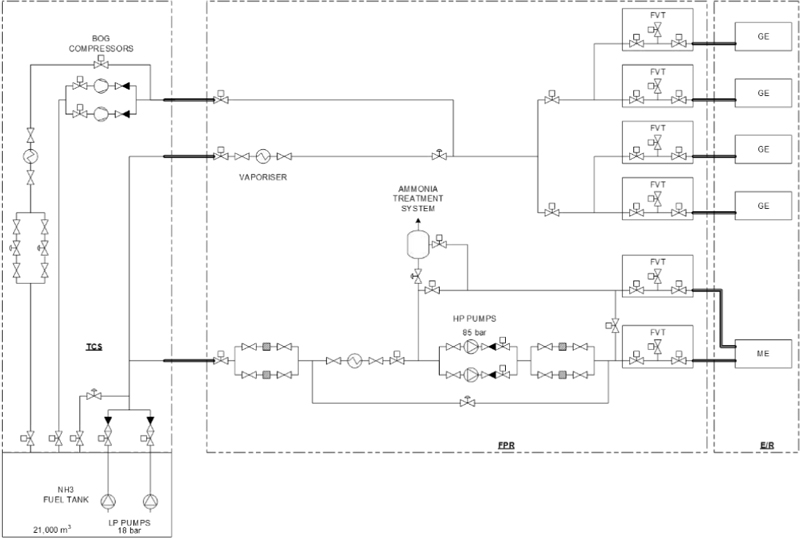
Figure 10, Figure 11, and Figure 12 provide simplified schematics for the LNG, methanol, and ammonia fuel systems respectively. Detailed drawings of the fuel systems were used to estimate leak frequencies (i.e. likelihoods) during the QRA process.
The enclosed spaces containing fuel handling equipment were assumed equipped with gas detection systems with limits summarised in Table 8, as per LR Rule requirements [6].
4.2 Manning Distribution
Table 9 details the crew composition and their time allocation across different vessel areas, forming the basis for individual risk calculations [3].
Table 10 summarises the crew distribution for each operating scenario that is used to calculate the societal risks. It is assumed that the vessel operates at sea on alternative fuel for 70% of the time, with the remaining 30% spent in port using either conventional fuel oil or shore power [41]. The presented data are indicative and will vary depending upon the operator’s practices and the crew’s composition and roles.
4.3 QRA Results: LNG fuelled 15,000 TEU Containership
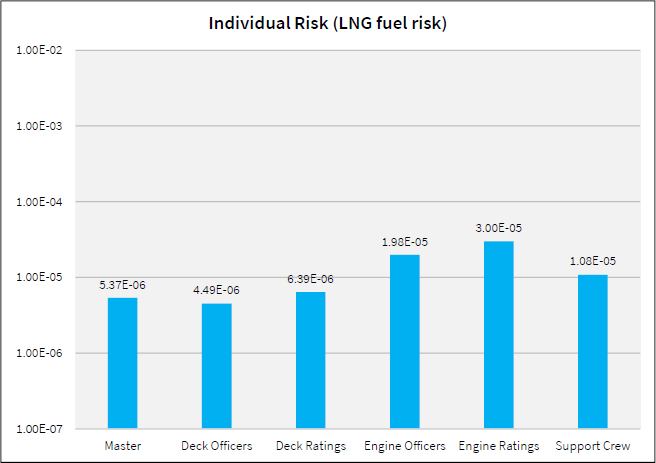
Figure 13 illustrates the individual risk from LNG as fuel. Engineering Officers and Engineering Ratings have the greatest fuel risk. Compared to the conventional fuel, the individual risks for these personnel have increased more than three times. Other crew members are also exposed to the fuel risk due to potential explosion events in the FPR, which is located beneath the accommodation.
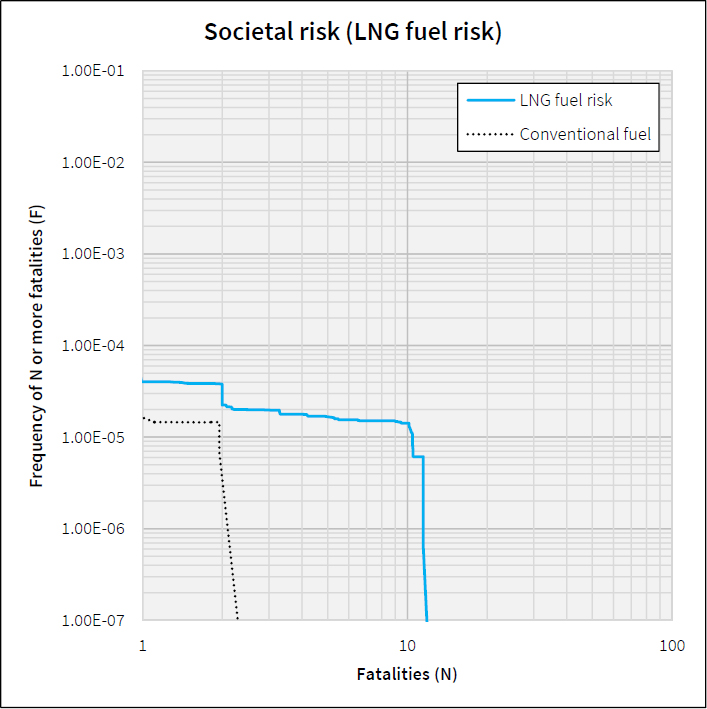
Figure 14 presents the societal risk from LNG as fuel. The FN curve shows the cumulative frequencies (F) of accidents involving N or more fatalities and that LNG introduces a greater chance of multiple fatalities compared to conventional fuel.
Table 11 compares the risk levels between LNG and conventional fuel oil in terms of PLL. LNG fuel risk is approximately five times greater than for conventional fuel oil and is attributable to potential explosions and jet fires.
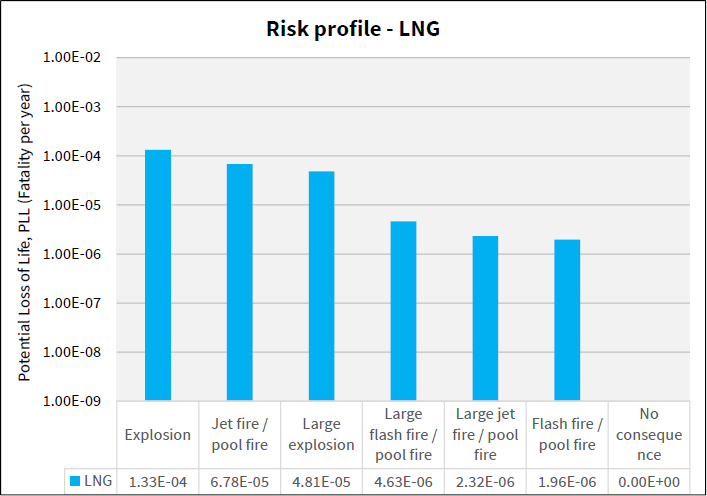
Figure 15 illustrates the risk profile for LNG as fuel. The greatest PLL is associated with explosion events, suggesting that potential explosion events require priority for risk mitigation. Although the likelihood of an explosion is less than that of fire events, such incidents can involve multiple fatalities, resulting in a relatively ‘high’ PLL. Jet fires also pose a significant risk due to the presence of high-pressure LNG piping (up to 300 bars in the fuel supply system).
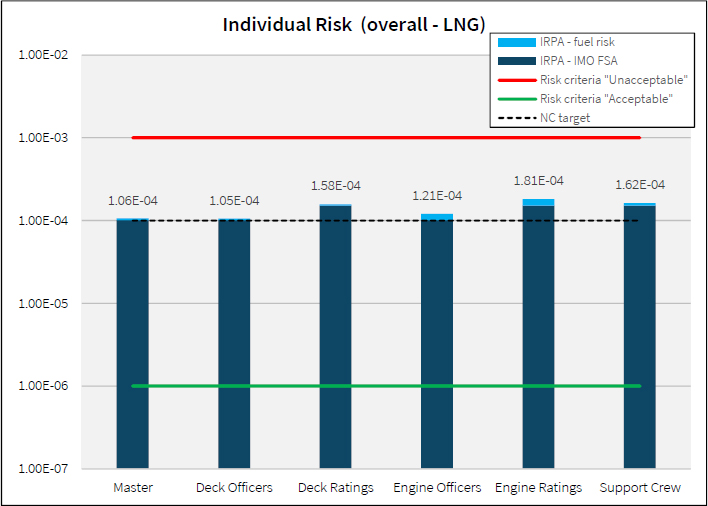
Figure 16 presents the overall individual risks to crew members in the LNG-fuelled containership. Although all crew groups face greater fuel risks than for a conventionally fuelled vessel, the overall increase in individual risk is marginal with a maximum increase of 14% for Engineering Officers.
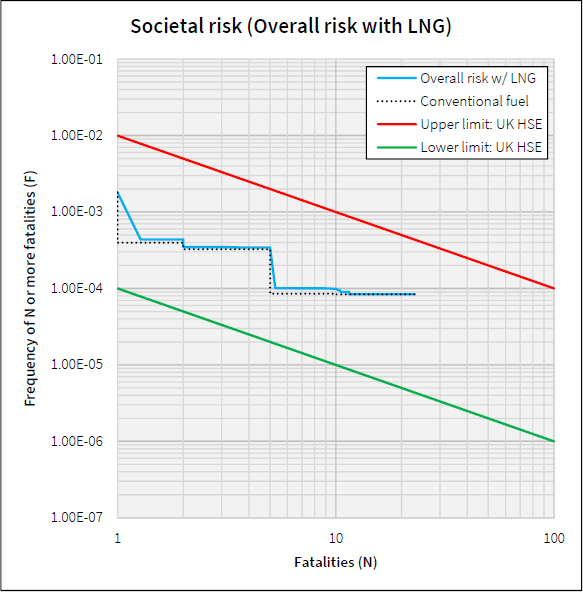
Figure 17 presents the overall societal risk for LNG. The five-fold increase in fuel-specific risk, discussed in Table 11, results in a 4.4% increase in the overall societal risk (PLL), as shown in Table 12.
4.4 QRA result: Methanol fuelled 15,000 TEU containership
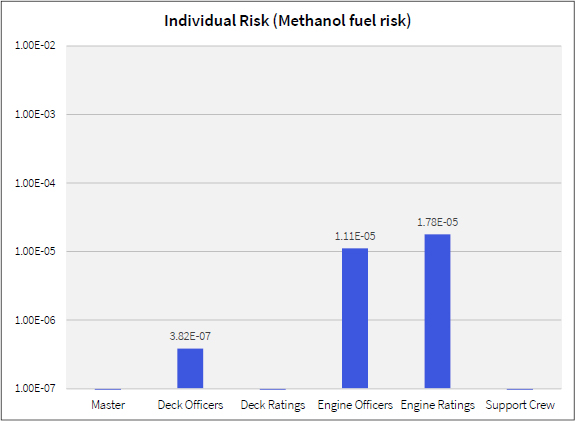
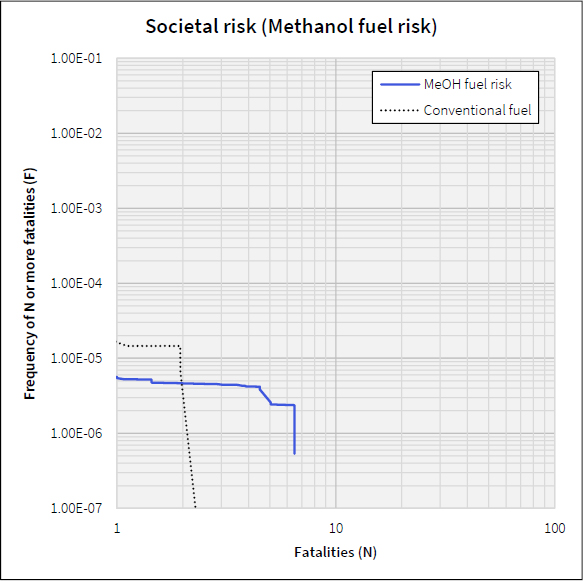
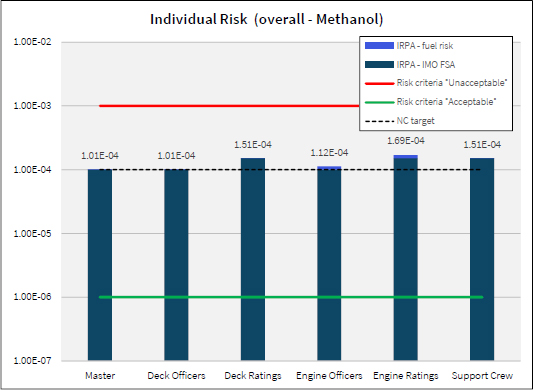
Figure 18 and Figure 19 display the fuel-specific individual and societal risks for the methanol-fuelled containership. As detailed in Table 13, the adoption of methanol as a fuel has led to a 19% increase in the fuel risk for PLL. Compared to conventional fuel oil, methanol exhibits higher ignition probabilities and a greater explosion potential, which could lead to multiple fatalities. However, additional safety measures, such as use of double-walled pipework and ignition source control, help manage these risks.
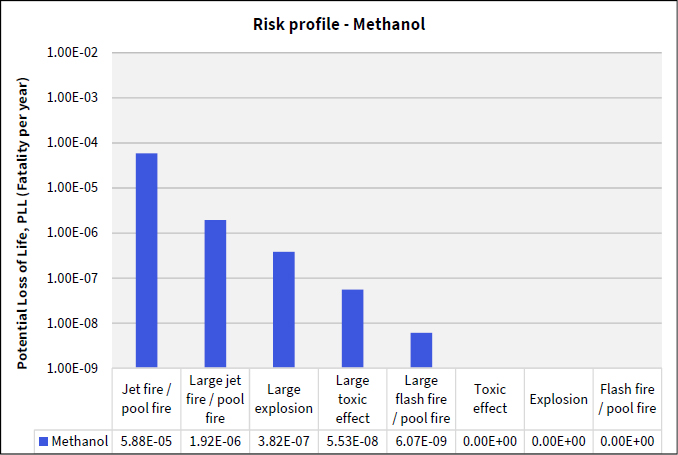
As depicted in Figure 20, the main risk contributors for methanol as fuel are pool fires in the FPR and engine room. Although methanol also presents explosion and toxic risks, their contribution to the overall fuel risk is relatively minor. Since methanol remains in a liquid state under normal conditions, only evaporated vapour from the methanol pool and aerosolised particles during a release contribute to the formation of a flammable or toxic atmosphere. Consequently, explosions or toxic effects are expected only in the event of large methanol spills. This also indicates that gas detection may be challenging, highlighting the importance of liquid leakage detection measures for early warning of a leak.
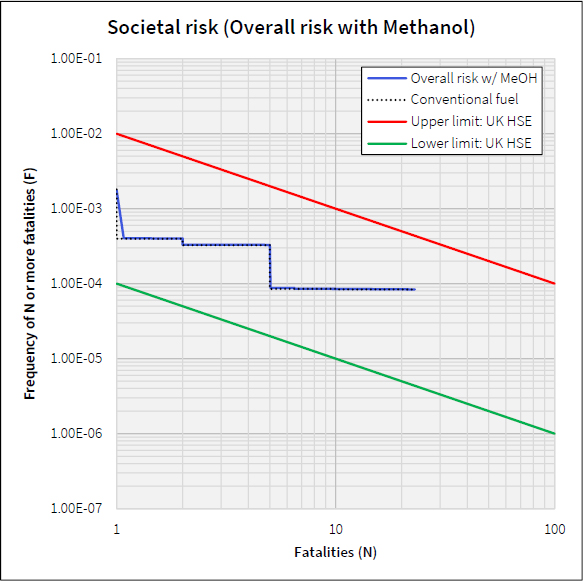
Since the methanol fuel risk shows only a marginal increase compared to conventional fuel, it does not result in significant changes to individual and societal risks, as shown in Figure 21 and Figure 22.
As indicated in Table 14, the calculated overall risk is 4.70E-03 fatalities per year in PLL, which is comparable to 4.69E-03 fatalities per year for the conventionally fuelled containership, clearly demonstrating an equivalent level of safety.
4.4 QRA Result: Ammonia fuelled 15,000 TEU Containership
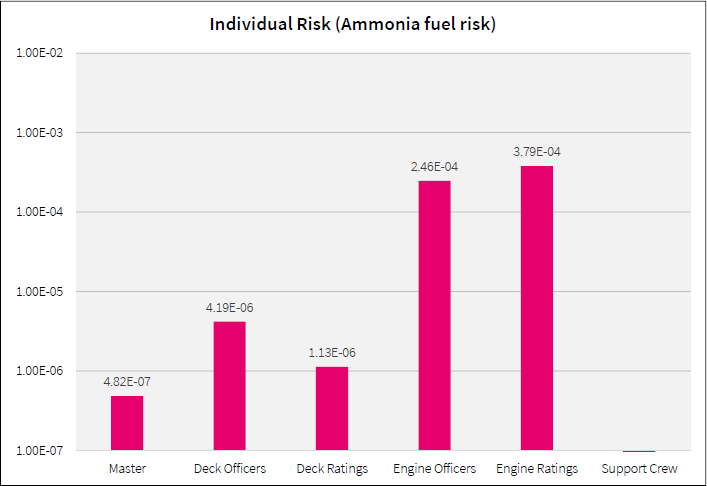
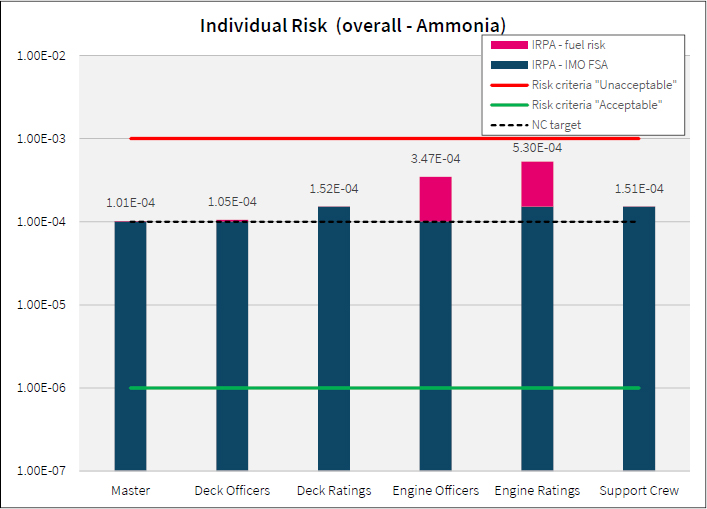
Ammonia as a fuel exhibits a significantly elevated risk profile. As shown in Figure 23, the fuel-specific individual risk exceeds the target for new ships of 1.00E-04 fatality per year for engineering department personnel. Although it is assumed that engineering personnel spend less than 25 minutes per day on average in the FPR, this significantly contributes to the elevated risk. Minimising time spent in the FPR is therefore crucial. This could be achieved through increased automation (i.e. remote monitoring and operation) of the fuel supply system. The individual risk would also reduce with rigorous safety procedures for FPR entry. Additionally, the risk reduction measures suggested by Franks [3] could be considered, such as subdivision of the FPR and increased ventilation rates in the FPR.
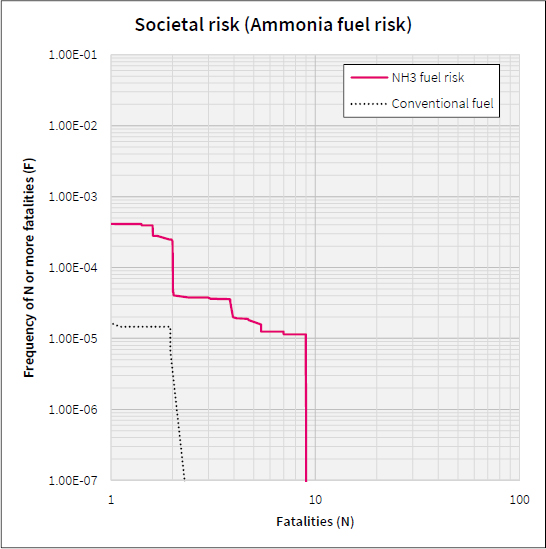
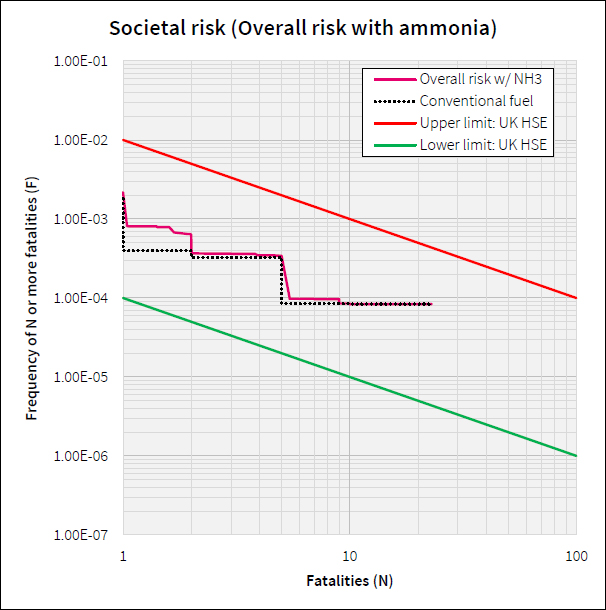
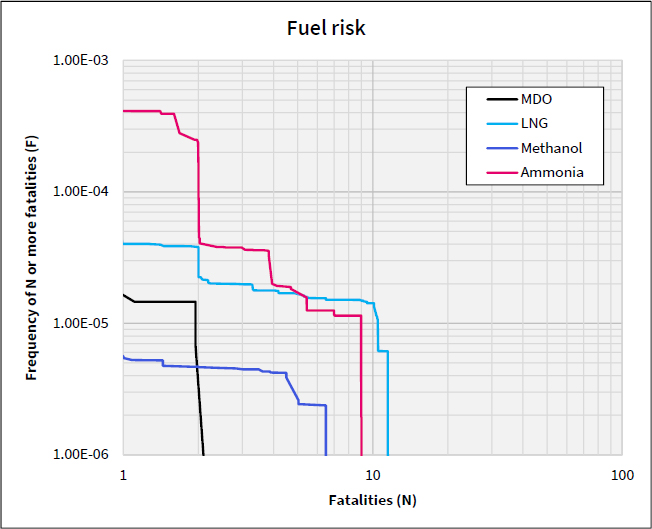
Figure 24 shows a significant increase in the frequency of accidents involving one or more fatalities compared to conventional fuel. This is because ammonia poses an immediate threat upon release, unlike conventional fuels that primarily require ignition to create fatal consequences. As a result, ignition source control, a common mitigation measure for flammable hazards, is ineffective in reducing ammonia-related risks. Furthermore, ammonia poses a substantial risk of multiple fatalities, particularly with potential leaks in the engine room. As summarised in Table 15, ammonia as fuel presents a PLL that is more than 22 times higher than that of conventional fuel oil.
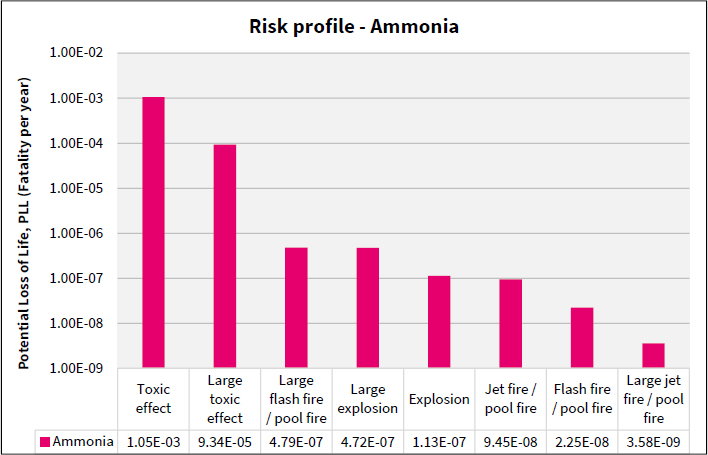
As shown in Figure 25, the predominant contributors to this increased fuel risk are ammonia releases and subsequent toxic effects. Leaks from the pressurised liquid segments resulted in ‘high’ fatality probabilities regardless of leak sizes due to the dense gas behaviour of the released ammonia.
Upon release of ammonia in the FPR, toxic gas clouds formed by vented ammonia can spread to other parts of the vessel, potentially affecting those in the engine room or accommodation. However, fatalities from these releases were rare due to safety measures, such as the assumed automatic closing devices at the accommodation air intakes, the separation between the ammonia handling spaces and accommodation areas, and the mitigating effects of indoor conditions.
Figure 26 highlights a substantial increase in individual risks for Engineering Officers and Ratings. These individual risk levels significantly exceed the target criterion for new ships, approaching the ‘unacceptable risk’ threshold. This emphasises the necessity for additional risk mitigation measures to achieve the target criterion.
Figure 27 illustrates the societal risk for ammonia as fuel. There is a notable increase in the likelihood of incidents involving more than one to two fatalities compared to conventional fuel use.
As summarised in Table 16, the overall risk (PLL) has risen by more than 20%. Although the estimated risk, both in individual and societal terms, remains within the tolerable region, substantial efforts are required to ensure onboard safety through adequate ALARP demonstration, application of inherently safer design and provision of additional meaningful protection [42].
5. Discussion: Comparison of Risks
5.1 Individual Risks of 15,000 TEU Containerships using Conventional Fuel, LNG, Methanol, and Ammonia
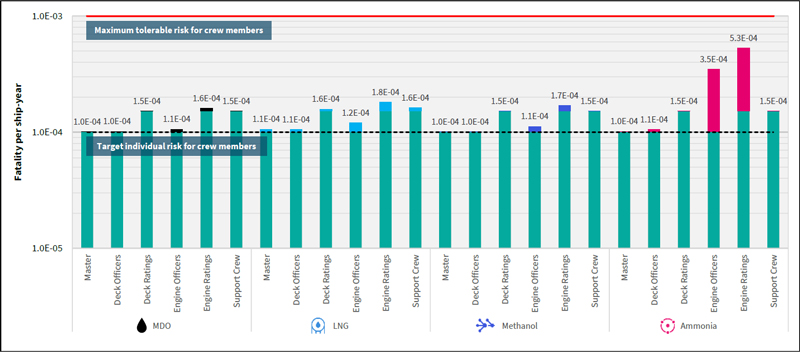
Figure 28 presents the individual risks for 15,000 TEU containerships using conventional fuel oil (MDO), LNG, methanol, and ammonia. The analysis indicates that the individual risks for fuel oil and methanol are relatively comparable, with LNG slightly greater. However, ammonia as fuel presents substantially greater individual risks, particularly for Engineering Officers and Ratings. As discussed earlier, the individual risk level for ammonia significantly exceeds the risk target for new ships, underlining the necessity for further risk reduction.
5.2 Fuel-specific societal risks of 15,000 TEU container-ships using conventional fuel, LNG, Methanol, and Ammonia
As shown in Figure 29 the frequency of incidents involving one or more fatalities is significantly greater for ammonia; over an order of magnitude greater than for the other fuels. This is primarily due to ammonia releases in the FPR and to a lesser extent releases in the engine room. LNG also presents a ‘high’ societal risk, mainly due to potential jet fires (in lower fatalities ranges) and explosions (in multiple fatalities ranges). Notably, LNG has the greatest potential for catastrophic consequences, involving more than 5 fatalities, driven by potential explosions in the FPR.
Methanol exhibits the ‘lowest’ risk amongst LNG, ammonia, and methanol, and is relatively comparable to fuel oil. Although there is a potential for multiple fatalities due to explosions or large pool fires, the likelihood is remote. Therefore, the overall methanol fuel risk is relatively ‘low’ as shown in Table 17.
5.3 Risk Profile of Conventional Fuel, LNG, Methanol, and Ammonia
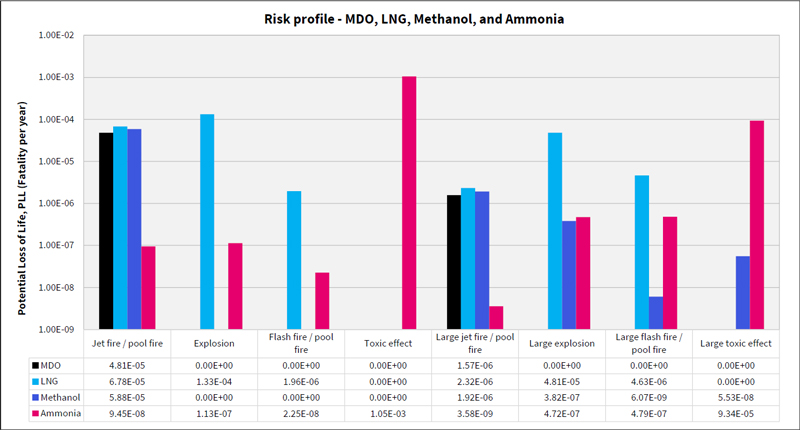
Figure 30 illustrates the comparative risk profiles of four fuel types: MDO, LNG, methanol, and ammonia across a range of events. The large-scale incidents refer to events involving prolonged fuel releases caused by isolation failure.
The toxic risk from ammonia is the greatest among all consequence scenarios for different fuels, with a PLL of 1.14E-03 fatalities per year. The explosion risk of LNG is also significant, with a PLL of 1.81E-04 fatalities per year. Jet fires related to LNG pose a notable risk as well, with a PLL of 7.01E-05 fatalities per year.
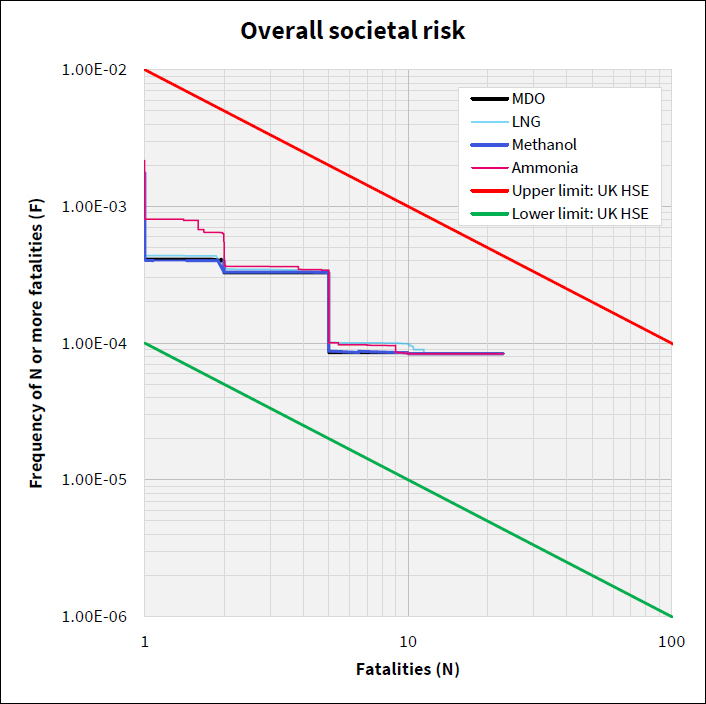
5.4 Overall Societal Risks of 15,000 TEU Containerships using Conventional Fuel, LNG, Methanol, and Ammonia
The overall risks of 15,000 TEU containerships using fuel oil, LNG, Methanol, and Ammonia are presented in Figure 31 and Table 18. The methanol-fuelled containership demonstrates an equivalent level of safety to that of the containership using conventional fuel oil, while a slight increase in risk is observed for the LNG-fuelled containership. Conversely, the ammonia-fuelled containership shows a considerable increase in overall risk.
5.5 Sensitivity Study
QRA involves inherent uncertainties, particularly when operating experience is limited. To address these uncertainties, this study adopted conservative approaches, assumptions, and parameters. Sensitivity studies were conducted to assess the impact of these factors, with the results summarised in Table 19. The findings indicate a significant reduction in PLL—approximately 30–40%—underscoring the importance of reliable data and thorough validation of assumptions and approaches. Although the QRA results may be conservative, this approach is considered reasonable given the limited operational experience and data for alternative fuels.
6. Conclusion
This study conducted a Quantitative Risk Assessment (QRA) of generic containerships using conventional fuel oil, LNG, methanol, and ammonia with the tool DeRiskbeta, to analyse their safety risk profiles and calculate both fuel-specific and overall risks.
LNG exhibited a noticeable increase in fuel-specific risk compared to conventional fuel oil (5 times higher in PLL), with explosion and jet fire scenarios as dominant contributors. However, the overall risk remained comparable to conventional fuel oil, with an increase of less than 5% (PLL).
Methanol showed a slightly higher but still comparable fuel-specific risk to conventional fuel oil (1.2 times higher in PLL). Consequently, the overall risk level also remained comparable to conventional fuel oil.
Ammonia, by contrast, posed substantially higher fuel-specific risks. Its unique challenges are primarily driven by its toxic nature with individual risks significantly exceeding the IMO safety target for new vessels of 1.00E-04 per year. Societal risk of the ammonia fuel was also markedly higher, with a PLL 22 times greater than that of fuel oil. Furthermore, the overall societal risk of ammonia-fuelled containerships showed more than a 20% increase in PLL. It remains within the tolerable if ALARP region; however, it appears that additional efforts are essential to achieve an equivalent level of safety to conventional fuel oil.
This study contributes to a broader understanding of the safety risks associated with alternative fuels by systematically quantifying and comparing their risk profiles. The findings emphasise the distinct challenges posed by each fuel type and the necessity for further research and innovation, particularly for ammonia, to address its unique hazards.
Acknowledgments
This paper is a revised and expanded version of a paper entitled ‘Comparative Quantitative Risk Assessment (QRA) of LNG, Methanol, and Ammonia Fuelled Container Ship’ presented at the 2024 Global Conference On Naval Architecture and Ocean Engineering of the Society of Naval Architects of Korea.
Author Contributions
Conceptualization, P. Davies and K. T. Moon; Methodology, K. T. Moon; Formal Analysis, K. T. Moon and S. J. Choi; Investigation, K. T. Moon; Writing—Original Draft Preparation, K. T. Moon; Writing—Review & Editing, P. Davies and L. Wright; Supervision, P. Davies; Project Administration, P. Davies & K. T. Moon; Funding Acquisition, P. Davies
References
- P. A. Davies, “Quantitative Risk Assessment Model, LNG Fuelled Ships (LNGQRAM),” Lloyd’s Register internal paper, October 2012.
-
B. Jeong, B. S. Lee, and P. Zhou, “Quantitative risk assessment of fuel preparation room having high-pressure fuel gas supply system for LNG fuelled ship,” Ocean Engineering, vol. 137, pp. 450-468, 2017.
[https://doi.org/10.1016/j.oceaneng.2017.04.002]

-
A. Franks, S. Parkar, and C. R. Hansen, “Use of quantitative risk assessment to enhance the safety of ships using ammonia as fuel,” Journal of Safety and Sustainability, vol. 1, no. 3, pp. 127-140, 2024.
[https://doi.org/10.1016/j.jsasus.2024.09.004]

- Lloyd’s Register, “RA-RBC guidance - potential consequences - low-flashpoint fuels for ships,” 2023.
- International Maritime Organization, “International code of safety for ships using gases or other low-flashpoint fuels (IGF code),” Resolution MSC.391(95), 2015.
- Lloyd’s Register, “Rules and regulations for the classification of ships using gases or other low-flashpoint fuels,” July 2024.
- International Maritime Organization, “Revised guidelines for formal safety assessment (FSA) for use in the IMO rule-making process,” IMO MSC-MEPC.2/Circ.12/Rev.2, 2018.
- International Maritime Organization, “Formal safety assessment, FSA – container vessels,” IMO MSC 83/21/2, 2007.
- International Maritime Organization, “Formal safety assessment, FSA – container vessels, details of the formal safety assessment,” IMO MSC 83/INF.8, 2007.
- S&P Sea-web [Online]. Available: https://maritime.ihs.com/, , Accessed December 8, 2024.
- European Maritime Safety Agency, Annual overview of marine casualties and incidents 2023, 2023.
- International Maritime Organization, “Formal safety assessment - decision parameters including risk acceptance criteria,” IMO MSC 72/16, 2000.
- UK Health and Safety Executive, “Reducing risks, protecting people,” Discussion document, 2001.
- UK Health and Safety Executive, “Guidance on ALARP Decisions in COMAH,” SPC/Permissioning/37, Version 3.
- UK Health and Safety Executive, “HID's approach to ALARP decisions,” SPC/Permissioning/39, Version 2.
- A. Charchalis and S. Czyz, “Analysis of fire hazard and safety requirements of a sea vessel engine rooms,” Journal of KONES Powertrain and Transport,” vol. 18, no. 2, pp. 49-56, 2011.
- Romanas Puisa, “Risk of onboard fires: summary & future prospects,” FAROS 3rd public workshop, 2015.
- Center for Chemical Process Safety, “Guidelines for chemical process quantitative risk analysis,” 2nd edition, 2000.
- National Institute of Public Health and the Environment, “Guidelines for quantitative risk assessment,” CPR 18E, 2005.
- National Institute of Public Health and the Environment, “Reference manual bevi risk assessments,” Version 3.2, 2009.
-
K. T. Moon, D. A. Paul, and L. H. Wright, “Ammonia as a marine fuel: likelihood of ammonia releases,” Journal of Advanced Marine Engineering and Technology, vol. 47, no. 6, pp. 447-454, 2023.
[https://doi.org/10.5916/jamet.2023.47.6.447]

- International Association of Oil & Gas Producers, “Risk assessment data directory – process release frequencies,” Report 434-01, Version 1.1, 2021.
- Idaho National Laboratory, Reliability Estimation for Double Containment Piping, 2012.
- P. A. Davies and E. Fort, “LNG as a marine fuel: likelihood of LNG releases,” Journal of Marine Engineering and Technology, vol. 12, no. 3, pp. 3-10, 2013.
- CCPS, Guidelines for Determining the Probability of Ignition of a Released Flammable Mass, 2014.
- IEC60079-10-1, Explosive atmospheres – Part 10-1: Classification of areas – Explosive gas atmospheres, 2020.
- AMINAL, New guideline for calculating flash and spray, doc. 97/001, 1997.
-
I. H. Bell, et al., “Pure and pseudo-pure fluid thermophysical property evaluation and the open-source thermophysical property library CoolProp,” Industrial & Engineering Chemical Research, vol. 53, no. 6, pp. 2498-2508, 2014.
[https://doi.org/10.1021/ie4033999]

- International Association of Oil & Gas Producers, Risk assessment data directory – guide to finding and using reliability data for QRA, Report 434-20, 2019.
- International Electrotechnical Commission, “Functional safety - Safety instrumented systems for the process industry sector - Part 1: Framework, definitions, system, hardware and application programming requirements,” IEC 61511-1, 2016.
- GEXCON, RiskCurves, Quick Start Guide and User Manual, Version 12, 2023.
- National Institute of Public Health and the Environment, “Methods for the calculation of physical effects,” CPR 14E, 1996.
- International Association of Oil & Gas Producers, Risk assessment data directory – vulnerability of humans, Report 434-15, 2010.
- International Association of Oil & Gas Producers, Risk assessment data directory – vulnerability of plant/structure, Report 434-14.1, 2010.
- R. J. Harris, “The investigation and control of gas explosions in buildings and heating plants,” British Gas, 1983.
-
C. R. Bauwens, “CFD modeling and consequence analysis of an accidental hydrogen release in a large scale facility,” International Journal of Hydrogen Energy, vol. 39, no. 35, pp. 20447-20454, 2014.
[https://doi.org/10.1016/j.ijhydene.2014.04.142]

- RIVM, Probit function technical support document, 20220608-Methanol-INHOUDELIJK VASTGETELD, 2022.
- TNO, CPR 16E Methods for the determination of possible damage - Green Book, 1992.
- P. J. Bown and L. C. Shirvill, “Pressurised atomisation of high flashpoint liquids – implications for hazardous area classification,” ICHEM E symposium series, no. 134, 1994.
-
P. J. Bown and L. C. Shirvill, “Combustion hazards posed by the pressurized atomization of high-flashpoint liquids,” Journal of Loss Prevention in the Process Industries, vol. 7, no. 3, pp. 233-241, 1994.
[https://doi.org/10.1016/0950-4230(94)80071-5]

- C. Banks, et al., “Understanding ship operating profiles with an aim to improve energy efficient ship operations,” 2013.
- P. A. Davies, “Designing for safety - alternative fuels, safety challenges,” Bunkerspot, vol. 21, no. 2, 2024.
- RIVM, Probit function technical support document, 20170606-ammonia-INTERIM, 2017.


