Improvement of indoor air quality aboard operational ships according to changes in atmospheric environment
Copyright © The Korean Society of Marine Engineering
This is an Open Access article distributed under the terms of the Creative Commons Attribution Non-Commercial License (http://creativecommons.org/licenses/by-nc/3.0), which permits unrestricted non-commercial use, distribution, and reproduction in any medium, provided the original work is properly cited.
Abstract
Although legal regulations for indoor air quality management are enacted on land, there is a lack of regulations for managing the indoor air quality of ships in maritime environments. This study was aimed to analyze the impact of external air quality changes on indoor air quality aboard operational ships and quantitatively evaluate key pollutants, such as particulate matter PM10, PM2.5, and PM1.0. Airtight ships and prolonged travels substantially affect the health and work efficiency of the crew. External air pollution (e.g., particulate matter, heavy metals, and volatile organic compounds) directly influences indoor air quality. Our results showed large changes in indoor air quality according to the external air quality, and the implementation of a novel high-efficiency filter ventilation system reduced indoor particulate matter. These findings support the need for indoor air quality management and regulatory frameworks for ships and provides foundational insights for establishing management strategies suited to maritime environments.
Keywords:
Indoor air quality, Maritime environment, Ship environment, High-efficiency filter ventilation system1. Introduction
Recently, domestic and international efforts to strengthen fine dust management have reduced air pollution levels. However, this reduction remains insufficient compared with the recommendations by the World Health Organization (WHO). Furthermore, with the economic recovery and increased international trade after the COVID-19 pandemic, air pollutant emissions are expected to considerably increase. Consequently, improving indoor air quality (IAQ) in environments such as ships according to changing atmospheric conditions is an urgent challenge [1].
Current legal regulations for IAQ aboard ships are insufficient. Although the International Maritime Organization and Maritime Labour Convention provide guidelines for ensuring the health and safety of seafarers, they remain nonbinding and lack regulatory enforcement [2][3]. In contrast, on land, the WHO set IAQ guidelines in 2010, establishing annual limits of 15 µg/m³ for particulate matter PM10 and 5 µg/m³ for fine particulate matter PM2.5. Additionally, stricter air quality standards have been imposed to pollutants such as ozone and nitrogen oxides (NOx) [4]. In South Korea, the Indoor Air Quality Control Act was enacted in 2004 to manage the IAQ of multiuse facilities, with its scope expanded to include residential apartments and public transportation in 2016 [5]. Moreover, PM10 and PM2.5 standards were tightened to 75 and 35 µg/m³, respectively, reflecting ongoing efforts to improve IAQ. These legal regulations and policies aim to protect the public health and create pleasant indoor environments, emphasizing the importance of IAQ management.
Similar efforts for air-quality management and regulation are required for ship environments to protect the seafarers’ health and ensure operational safety. In particular, direct mitigation measures to prevent the reentry of pollutants, such as pollution by incomplete fuel combustion, must be implemented. Simultaneously, indirect measures, such as ventilation management policies to adapt to changing atmospheric conditions and minimize health risks for crew members, must be developed [6].
This study was aimed to analyze the impact of atmospheric and environmental changes on IAQ aboard operational ships, focusing on preventing the reentry of pollutants into ship interiors through newly developed solutions and their evaluation. Accordingly, we devised systematic management and optimization strategies for improving IAQ aboard ships. Ultimately, this study seeks to safeguard the seafarers’ health and ensure the stability of ship operations.
2. Experimental Methods
To analyze the impact of changes in atmospheric conditions on the IAQ aboard ships and concentration of key pollutants (e.g., particulate matter PM10 and fine particulate matter PM2.5), IAQ measurements were conducted over a 100-day period aboard a 20,000-ton bulk carrier operating in real industrial settings. The fuels used in this ship included low-sulfur fuel oil and marine gasoil. The experiment focused on measuring the IAQ in the crew living quarters, specifically in a cabin located on the same floor as the dining area. Air was supplied to the cabin from the central air-handling unit in the machinery room and consisted of a fixed ratio of mixed indoor and outdoor air that passed through a filter system before being supplied. During the experimental period, the test ship regularly navigated the Korean coast, including the West Sea, South Sea, Ulsan Bay, and East Sea, transporting cargo. Measurements were conducted by categorizing operations at berths and different times of the day [7]. The measured parameters included particulate matter, including PM10 and PM2.5, as well as other environmental factors such as indoor temperature and humidity, which were recorded at 1 h intervals [8]. To compare the IAQ and outdoor air quality during the experiment, data from an automated synoptic observation system of the Korea Meteorological Administration were obtained. These data included observations of temperature, precipitation, wind speed, wind direction, humidity, and air pressure, all of which were available through the public data portal of the Korea Meteorological Administration. Real-time data from the automated synoptic observation system station closest to the ship location were utilized to analyze the atmospheric environment in this study.
3. Analysis of IAQ During In-Port and Voyage Periods
3.1 IAQ Trends Based on In-Port and Voyage Periods of Bulk Carrier
Changes in the IAQ of a ship occur due to various factors such as external environmental conditions and ship activities during voyage and in-port periods. To study the IAQ in ship cabins depending on whether the ship is in a voyage or in port, real-time IAQ measurements were acquired. This study compared the changes in IAQ (e.g., PM10 and PM2.5) between voyage and in-port periods and analyzed the key trends.
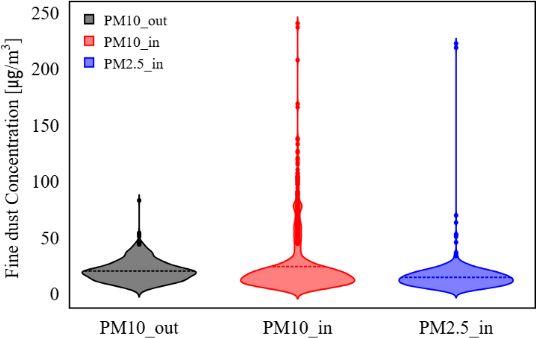
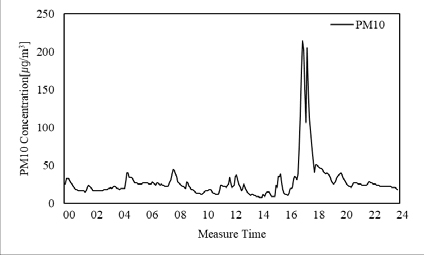
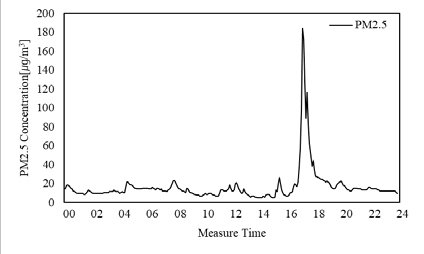
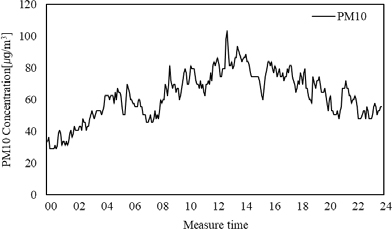
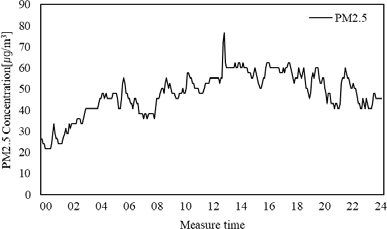
As shown in Table 1 and Figure 1, the average outdoor PM10 concentration on the ship during voyage was 20.12 μg/m³. During this period, the average indoor PM10 concentration in the ship cabin was 24.23 μg/m³, being similar to the outdoor air quality but 1.62 times higher than the WHO recommended IAQ standard for PM10. Furthermore, the average indoor PM2.5 concentration in the cabin during voyage was 14.61 μg/m³, being 2.92 times the corresponding WHO recommendation. Unlike the IAQ during the in-port period, both particulate matter and fine particles maintained relatively low average levels during voyage. However, as shown in Figures 2 and 3, because of external factors such as the outdoor wind direction during operation, harmful outdoor substances were introduced directly into the ship interior, resulting in a sharp increase in the concentration of fine dust inside the ship, and the IAQ deteriorated. Further investigation revealed that during voyage, harmful air pollutants from incomplete fuel combustion and fine particles originating from cargo directly entered the ship. As particulate matter is directly linked to respiratory diseases and mortality, measures to prevent the infiltration of harmful substances into the ship interior are required [9][10].
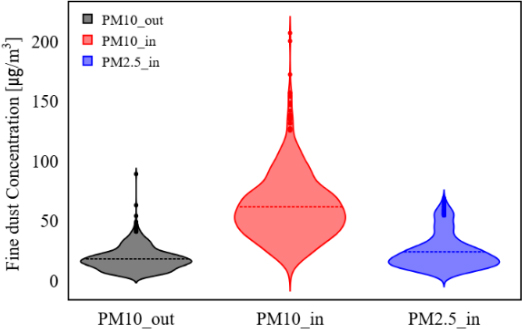
As shown in Figure 4, the average outdoor PM10 concentration in the ship was 18.13 μg/m³, while the average indoor PM10 concentration in the ship cabin was 61.52 μg/m³, reflecting a 70.54% increase compared with the average outdoor concentration. Additionally, the indoor PM10 concentration was 4.10 times higher than the WHO recommendation for IAQ. The average PM2.5 concentration was 23.98 μg/m³, being 4.80 times higher than the WHO recommendation. Hence, compared with indoor particulate matter concentrations during voyage, more meticulous management of IAQ during the in-port period is required. In particular, Figures 5 and 6 show that during cargo unloading operations, long-duration activities, such as bulldozer operations to level the cargo, can drastically increase the levels of particulate matter and fine particulate matter inside the cabin. Moreover, during the in-port period, harmful gases from the ship stack and pollutants from the cargo are continuously emitted and infiltrate the ship interior. Ship engine room repairs, which involve the release of fine particles containing heavy metals, contribute to the infiltration of pollutants into cabins. Therefore, more stringent management of IAQ is necessary during the in-port period than during voyage.
3.2 IAQ Trends Aboard Ships Based on Crew Activity Hours
Ships operate for long periods at sea, and the crew spends most of their time indoors. Activities such as cargo loading, which generate large amounts of particulate matter in spaces close to cabins, are typically carried out between 08:00 and 17:00. This study also examined the changes in key IAQ indicators (e.g., PM10 and PM2.5) aboard a ship according to the crew activity hours.
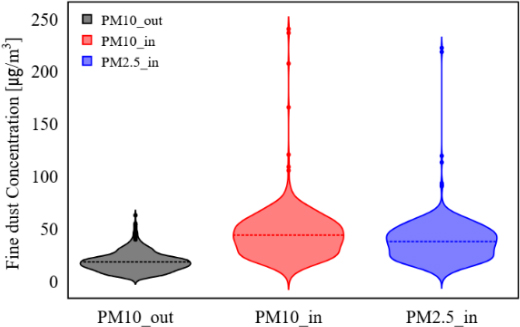
The IAQ aboard the ship during daytime and nighttime crew activity hours was measured, as listed in Table 2. As shown in Figure 7, the indoor PM10 concentration during daytime was 44.16 µg/m³, being 58.09% higher than the average concentration of outdoor fine dust (PM10) along the ship route, which was 18.51 μg/m3. This level was 2.94 times higher than the WHO recommendation for indoor fine dust concentration. The indoor PM2.5 concentration during the measurement period was 7.57 times higher than the WHO recommendation, indicating a substantially higher level of particulate matter than the recommended limit, which may adversely affect the health of the crew. The increase in indoor particulate matter concentration during daytime was primarily attributed to various activities, such as cargo unloading and maintenance, conducted during working hours. As a result, the average concentration and standard deviation of PM10 and PM2.5 were considerably higher during day-time than at night, showing large fluctuations in IAQ corresponding to the crew activity hours.
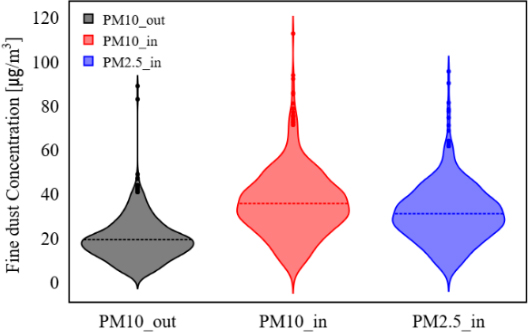
Next, we analyzed the indoor particulate matter concentration in the crew cabins during nighttime, when the crew activity was relatively low. As shown in Figure 8, the average concentration of fine dust in the cabin was 35.72 μg/m3, being a 45.98% increase compared with the concentration of outdoor fine dust during the same period. Although this value was lower than the daytime indoor PM10 concentration, the indoor PM10 level during the night remained considerably higher than the outdoor level, even despite the crew activity being minimal. This was likely due to the infiltration of pollutants, such as soot, from ship fuel combustion and cargo, which were influenced by weather conditions, as well as the accumulation of pollutants in the heating, ventilation, and air conditioning (HVAC) system due to ship aging. Additionally, the average indoor PM2.5 concentration during nighttime was 31.11 µg/m³, being 6.22 times higher than the WHO recommendation. Interestingly, this value was similar to the daytime average of PM2.5, unlike that of PM10, which showed a more noticeable difference. Based on these findings, we can conclude that air quality management of HVAC systems and individual cabins is necessary, even when the crew activity is minimal.
3.3 Preliminary IAQ Changes by Applying Developed Filter
We analyzed the changes in IAQ aboard ships under different conditions focusing on a single maritime environment. Accordingly, we aimed to develop filter media suitable for shipboard environments and conduct real-world evaluations of operational ships to analyze the filter effectiveness. We performed preliminary experiments for an in-depth analysis of pollutants captured in special environments, such as those with high humidity and high salinity.
To improve the IAQ aboard ships, an optimized filter medium for shipboard environments was developed, and the effects of its application on indoor particulate matter (i.e., PM10, PM2.5, and PM1.0) were measured and analyzed. Although PM1.0 is smaller than PM2.5, the research results are limited owing to resource constraints. However, similar to PM2.5, PM1.0 has a greater potential to penetrate deep into the alveoli, emphasizing the need for continuous monitoring and collection of corresponding data.
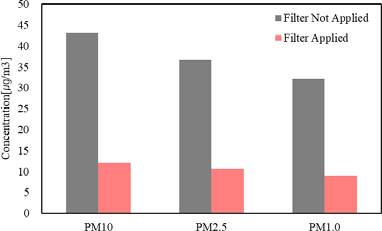
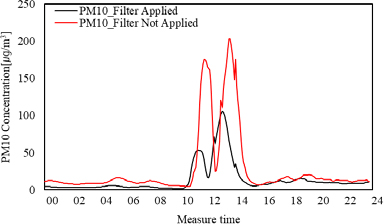
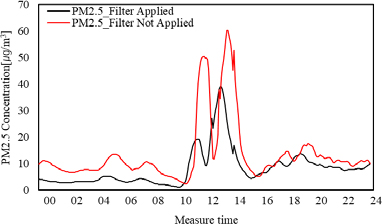
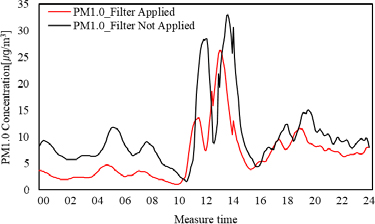
As shown in Figure 9, following the installation of the developed filter, the average indoor particulate matter concentration in the cabin decreased by 72.03%, from 43.18 to 12.08 µg/m³. The average PM2.5 concentration decreased by 71.16%, from 36.74 to 10.60 µg/m³. The PM1.0 concentration, with smaller particles than PM2.5, decreased by 71.77%, from 32.19 to 9.09 µg/m³. The concentration of fine dust inside the cabin according to the installation of the developed filter is shown in Figures 10–12. The results suggest that the performance was lower than the individual performance evaluation results of the developed filter. Thus, the filter performance could be further enhanced by addressing structural leaks and analyzing the contamination of filter media after real-world tests.
This study empirically demonstrated the IAQ improvement effect of the developed filter and established a basis for enhancing the filter performance through the chemical analysis of pollutants captured in real-world environments. Our proposal and findings will likely contribute to the development of tailored air quality management technologies for ship environments and provide crucial data for protecting the health and work efficiency of crews aboard ships.
4. Developed Filter for Improving IAQ Aboard Ships
4.1 Development and Performance Evaluation of Optimized Filter Media for Ship Environments
Ship filter design is based on dust collection models considering a single fiber and using simulation tools that predict aerosol attachment mechanisms (i.e., gravitational settling, inertial impaction, interception, and Brownian diffusion). This design approach considers variables such as fiber diameter, porosity, and distribution to predict the filter performance. Using this approach, filter media capable of removing fine and ultrafine particles were designed, and experimental validation allowed to optimize filter media for ship environments.
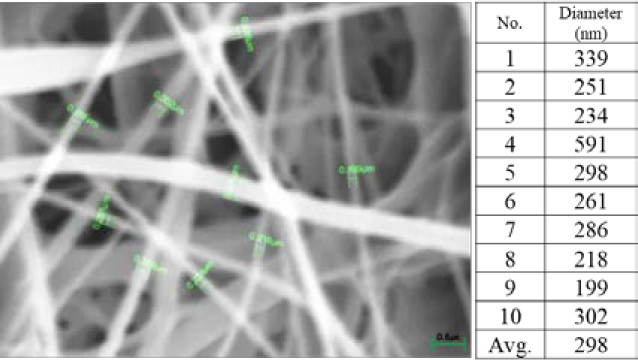
By applying filter design simulation, filter media were fabricated based on nanofibers. The physical characteristics were examined using scanning electron microscopy (SEM). The designed media were produced through three iterations, and their collection efficiency and pressure drop were measured through performance analysis (Figure 13). Filter media suitable for use in high-humidity environments were selected based on the measurements. The collection efficiency and pressure drop of the filter media were evaluated using a TSI 8130 filter tester, as detailed in the next section.
For the developed filter media, the dust collection efficiency was determined from the presence or absence of electrostatic force loss. Additionally, filter performance tests, such as bacterial removal efficiency tests, were conducted to evaluate the minimization of infectious disease reemergence in confined spaces typical of ships. These tests were aimed at optimizing the performance of the developed filter.
To evaluate the performance of the filter material developed for ships, tests were conducted using a TSI 8130 filter tester in accordance with the ASTM F3502 standard. TSI 8130 is a high-performance device designed to accurately measure the dust collection efficiency and pressure drop in filter media. It is widely recognized for providing reliable results, particularly in the industrial and scientific fields. This device injects sodium chloride (NaCl) particles with an average particle size of 0.3 μm into the filter material at an airflow rate of 5.33 cm/s. The particle concentrations before and after passing through the filter were precisely analyzed using a particle-counting method based on optical scattering. This method allowed to simultaneously evaluate the particle-removal efficiency and air permeability of the filter material. Additionally, the TSI 8130 tester automatically controlled environmental variables such as temperature and humidity to ensure consistent test conditions.
The results from testing the final selected filter media showed a particle removal efficiency of 99.957%, confirming the removal of fine particles at the HEPA (high-efficiency particulate air) filter level. For the same filter medium, the measured pressure drop was 34.32 Pa, demonstrating excellent air permeability. This confirmed that the developed product is suitable for use in ship environments.
A ship environment with high airtightness and extended stay periods aboard increase the risk of virus transmission, making the evaluation of virus reduction performance essential. Accordingly, we conducted virus reduction tests on a filter product to confirm its effectiveness in removing viruses from air. Additionally, a bacterial reduction rate test was conducted using the developed filter with its media, obtaining a 99.9% reduction in airborne bacteria. This result demonstrates the ability of the developed filter to remove airborne bacteria, suggesting that it can notably contribute to protect the health of crew members in the confined environment of ships.
4.2 Filter Test in Operational Ships
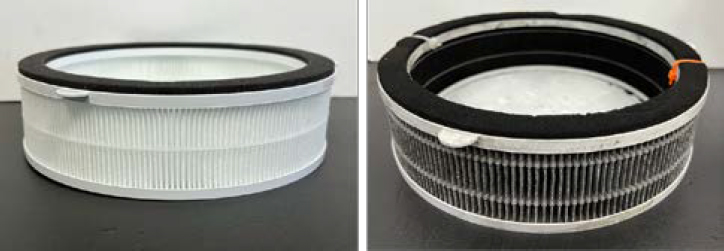
This experiment was aimed to analyze the characteristics and chemical composition of pollutants captured by the filter media used in operational ships and assess the impact of the ship environment during voyage on the filter performance. In particular, an in-depth chemical analysis was performed on normal and contaminated samples, as shown in Figure 14, to systematically analyze pollutants collected in the filter media during the departure and anchoring of ships.
For this experiment, SEM and energy dispersive X-ray spectroscopy (EDS) were applied. SEM is an analytical tool that uses an electron beam to scan the surface of a sample, providing high-resolution images at the nanometer scale. SEM was used to visually examine the distribution and morphology of the pollutants captured by the filter media. Thus, we could evaluate the particle size of the pollutants that infiltrated from the external environment during ship operation and specific capture state of the pollutants accumulated on the filter media surface.
EDS allows to analyze the elemental composition and concentration of a sample. Combined with SEM analysis, EDS provided detailed insights into the chemical composition of the pollutants captured in the filter media. EDS provided quantitative data about the elements detected on the filter media surface (e.g., carbon, sulfur, nitrogen, and metal particles), contributing to the chemical identification of the characteristics of pollutants on the filter.
SEM provided the results shown in Figure 15, indicating a large quantity of fine particles attached to the surface of the contaminated sample compared with the normal sample. Some particles were agglomerated, and particles from 1 to 5 µm in size were the most commonly observed, possibly affecting the pore structure of the filter media. This allowed the identification of the characteristics of pollutants captured on the ship, and these findings were applied to the development of filter media suitable for ship environments.
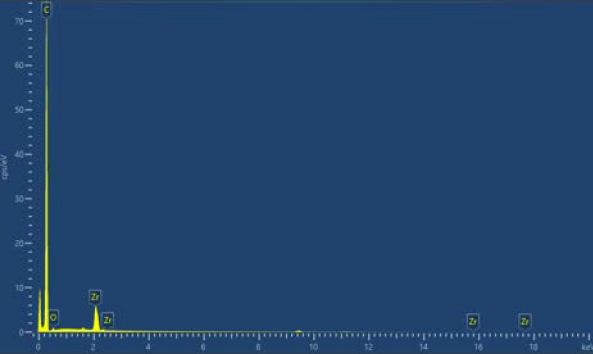
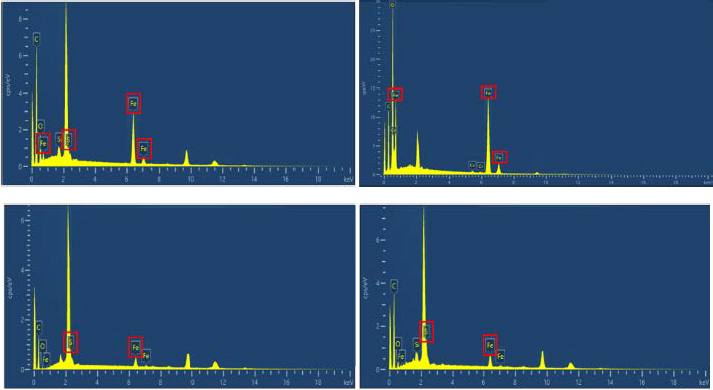
An EDS analysis was conducted to verify the adsorbed pollutants. By analyzing the major elemental ratios from the EDS results listed in Table 3, we can confirm the results shown in Figure 16. In the normal sample, the O and C element spectra were identifiable, reflecting the influence of hydro oxygen and carbon in air. Heavy metals and other pollutants were not detected. The EDS analysis of the contaminated sample revealed major elemental ratios, as listed in Table 4. The spectra of iron (Fe) and sulfur (S) were detected at the four measurement points, as shown in Figure 17. These particles, which have a micron size range, are classified as heavy metals that can generate volatile mixtures in the air or cause irritation and inflammation in the eyes, skin, and respiratory tract through inhalation or ingestion.
The application of the developed filter aboard ships demonstrated its effectiveness for filtering harmful heavy metals, likely contributing to protect human health. Based on the characteristics of pollutants and filter performance obtained in this study, we optimized filter media for ship environments and proposed improved application measures, such as minimizing leaks at the discharge points of individual cabin HVAC systems.
5. Conclusion
This study systematically analyzed the IAQ characteristics and effectiveness of filter application aboard operational ships. The findings revealed that the IAQ aboard ships varies drastically depending on operational conditions, work types, and activity hours, with particulate matter PM10, PM2.5, and PM1.0 concentrations exceeding the WHO recommendations, particularly during the in-port period and daytime activity hours.
The analysis of cabin IAQ during in-port and voyage periods showed that the average PM10 concentration in the cabin during the in-port period was 61.52 µg/m³, being 4.10 times the WHO recommendation, while the average PM10 concentration during voyage was 24.23 µg/m³, being 1.62 times the WHO recommendation.
The analysis of IAQ based on crew activity hours revealed that the average PM10 concentration during daytime, when crew activity is high, was 44.16 µg/m³, being 2.94 times the WHO recommendation. During nighttime, when crew activity is minimal, the average PM10 concentration was 35.72 µg/m³, being 2.38 times the WHO recommendation.
Third, IAQ analysis following the application of the developed filter demonstrated a substantial reduction in indoor particulate matter. After installing the filter, the indoor PM10 concentration decreased by 72.03%, from 43.18 to 12.08 µg/m³.
Finally, SEM and EDS analyses confirmed that the filter effectively removed heavy metal pollutants, such as iron and sulfur. These results highlight the potential of filters to protect crew health and improve the IAQ in ship environments.
This study identified the characteristics of pollutants in operational ship environments and outlined IAQ management strategies based on filter performance data. The findings provide foun-dational insights for developing systematic management and optimization strategies to improve the IAQ aboard ships.
Acknowledgments
This work was supported by the project for Collabo R&D between Industry, University, and Research Institute funded by Korea Ministry of SMEs and Startups in 2023. (RS-2023-00221800).
Author Contributions
Conceptualization, S.A Lee and S.D. Lee; Methodology, S.A Lee; Software, S.A Lee; Validation, S.A Lee and S.D. Lee; Formal Analysis, S.A Lee; Investigation, S.A Lee; Resources, S.A Lee; Data Curation, S.A Lee; Writing—Original Draft Preparation, S.A Lee; Writing—Review & Editing, S.D. Lee; Visualization, S.A Lee; Supervision, S.D. Lee; Project Administration, S.D. Lee; Funding Acquisition, S.D. Lee.
References
-
W.C Choi, K.S Cheong, Analysis of the Factors Affecting Fine Dust Concentration Before and After COVID-19, Journal of the Korean Society of Hazard Mitigation, 21(6), 395-402, 2021
[https://doi.org/10.9798/KOSHAM.2021.21.6.395]

- International Maritime Organization, Marine Environment Protection Committee (MEPC) 66th session report, IMO, 2014
- International Labour Organization, Maritime Labour Convention (MLC), Geneva, Switzerland: International Labour Of-fice, 2006
- World Health Organization, Global Air Quality Guidelines: Particulate matter (PM10 and PM2.5), ozone, nitrogen dioxide, sulfur dioxide and carbon monoxide, WHO, 2021
- Korean Joint Ministries, Comprehensive Plan for Fine Dust Management (2020–2024), 2019
- S.S Kim, Current Status of Indoor Air Quality in Transportation Modes - Importance and Status of Indoor Air Quality on Ships. Korean Air Cleaning Association, 27(3), 22-27, 2014
- Zhang, Y., Li, Z., & Wang, X, Indoor air particles in research vessel from Shanghai to Antarctic: Characteristics, influencing factors, and potential controlling pathway, Journal of Environmental Sciences, 55(3), 125-134, 2020
- Müller, J., Smith, R., & Johnson, T, A new approach to make indoor air quality in the accommodation of ships understandable and actionable for seafaring staff. Marine Environmental Research, 78(4), 123-135, 2021
- Korean Environmental Policy Association, Recent Policy Trends to Improve Health Impacts of Fine Dust, Korea Environmental Policy and Administration Society (KEPAS), 42(3), 45-67, 2023
- H.C Kim, The Health Impact of the Implementation of Fine Dust Management Policy, Master's Thesis, Master of Public Enterprise Policy, Seoul National University, 2020


