Study on the performance of wells turbine depending on tip clearance and blade machining geometry
Copyright © The Korean Society of Marine Engineering
This is an Open Access article distributed under the terms of the Creative Commons Attribution Non-Commercial License (http://creativecommons.org/licenses/by-nc/3.0), which permits unrestricted non-commercial use, distribution, and reproduction in any medium, provided the original work is properly cited.
Abstract
Harnessing natural energy has been a topic of interest and development in recent years. Waves are an important renewable energy source and can make a significant contribution if harnessed properly. The basic characteristic of a wells turbine is that for bidirectional flow, the turbine rotor rotates in the same direction. In this paper, the NACA0015 Wells turbine was used to study the effect of tip clearance and airfoil on the performance characteristics of the fillet. Wells turbines are most commonly used for wave power generation and have been the subject of many studies. We used the Navier-Stokes code Fluent to calculate the flow field of the Wells turbine. The CFD results were compared with experimental data for validation, and the CFD results show good agreement with the experimental results. The tip clearance was varied from 0 to 10% and the fillet was varied from 0,1,3,5%.
Keywords:
Wells turbine, Wave power energy, CFD, NACA0015, Coefficient of Torque and Pressure, Oscillation water column1. Introduction
Recently, natural energy utilization technologies have been developed with long-standing interest as measures for protecting the global environment and developing renewable energy sources. Renewable energy options such as wind power, solar energy, and marine energy have been extensively researched. In particular, wave energy conversion among marine energies is attractive as an excellent renewable energy source with no pollution, especially for South Korea, which is surrounded by the sea on three sides, making it promising for future economic viability [1][2]. However, like other renewable energy sources, marine energy currently faces relatively high installation costs and does not yet meet expectations for energy production efficiency. These issues necessitate continuous research through technological development of wave energy and the successful implementation of power generation projects. Leading countries, particularly in Europe, which spearhead marine energy technologies, have established institutions such as the European Marine Energy Centre (EMEC) in 2003 and the National Renewable Energy Center (NAREC) in 2002, later integrated into the Offshore Renewable Energy (ORE) in 2014. These institutions work to certify marine energy facilities, establish design standards, ensure reliability, maintain operations, and extend the lifespan of equipment, thereby promoting the renewable energy industry. As a result, demonstration projects began development in 2015, entered the initial stages of commercial production in 2018, and full-scale commercial development of marine energy is expected after 2023 [3][4]. Prior to 2013, OECD countries and the United States led in marine energy generation. However, with increased technological investment and national policy support from Asian countries, the development of marine energy in Asia is anticipated to accelerate. Tidal energy is projected to develop approximately 2.4 GW globally by 2030, with Europe accounting for 93% of this capacity. Similarly, wave energy is expected to be dominated by the European market, with around 500 MW being developed [5].
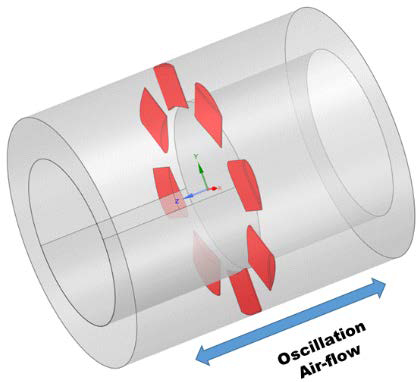
The turbine shown in Figure 1 is the most widely used air turbine among wave energy conversion devices utilizing Oscillating Water Columns (OWC) [6]. As the water level in the OWC rises and falls, air enters the Wells turbine bidirectionally, causing the turbine to rotate in a single direction. Therefore, the turbine blades use a symmetrical airfoil without camber. Research on Wells turbines has been extensively conducted by many researchers through numerical calculations and experiments.
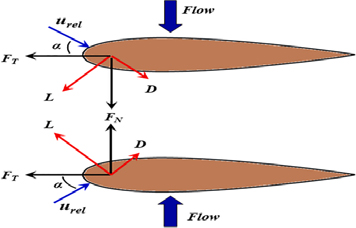
Wells turbines rotate in one direction despite bidirectional airflow. Due to this characteristic, Wells turbines employ symmetrical airfoils. When the turbine rotates, a relative velocity with an angle of attack is generated, which causes the turbine blades to produce lift and drag forces. These lift and drag forces result in the turbine blades also experiencing tangential force (Ft) and axial force (FA) (Equations (1), (2)).
| (1) |
| (2) |
The tangential force is the primary force that drives the rotation of the turbine. As shown in Figure 2, the tangential force causes the turbine to rotate in one direction despite bidirectional airflow [7].
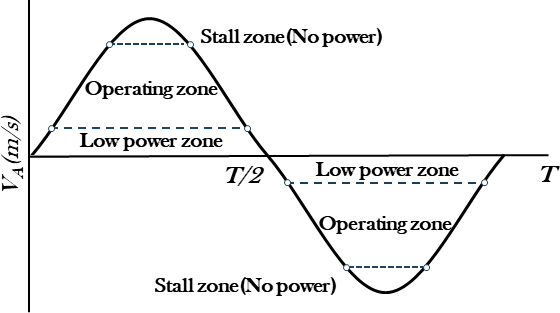
Figure 3 shows a typical velocity profile at the inlet of the Wells turbine. Each wave cycle is divided into two acceleration zones and two deceleration zones. The operating range of the Wells turbine depends on the angle of attack at the blade leading edge. At low velocity, the Wells turbine does not generate power. As the inlet velocity increases in the acceleration zones, the angle of attack (α) continues to rise. Beyond a certain value of α, the flow separates from the blade leading edge, causing the turbine torque to decrease sharply. This phenomenon is called stall, and the angle at this point is known as the stall angle. Beyond the stall point, the Wells turbine does not produce power output. In each half of the wave cycle, two regions exist where the turbine does not produce power when operating beyond the stall regime. As shown in Figure 3, four operating regions with power generation remain in each wave cycle. With the increasing ability to dynamically control the turbine's rotational speed, it becomes possible to develop Wells turbines with higher efficiency [8].
2. Numerical Analysis and Computational Conditions
The Wells turbine has primarily been studied for its inherent characteristics, with limited research conducted on optimal design for performance improvement. In this study, we aimed to enhance the performance of the Wells turbine by controlling its aerodynamic forces, based on previous research findings.
For numerical analysis, the CFD code Fluent 2022R2 was employed to calculate the aerodynamic performance of the Wells turbine and analyze optimized blade geometry design. Fluent applies the three-dimensional Reynolds-averaged Navier-Stokes (RANS) equations, and the governing equations are discretized using the finite volume method (FVM). The numerical simulation was performed under the assumption of three-dimensional incompressible steady-state flow conditions. The k-ω SST turbulence model, which is commonly provided in commercial CFD codes, was utilized.
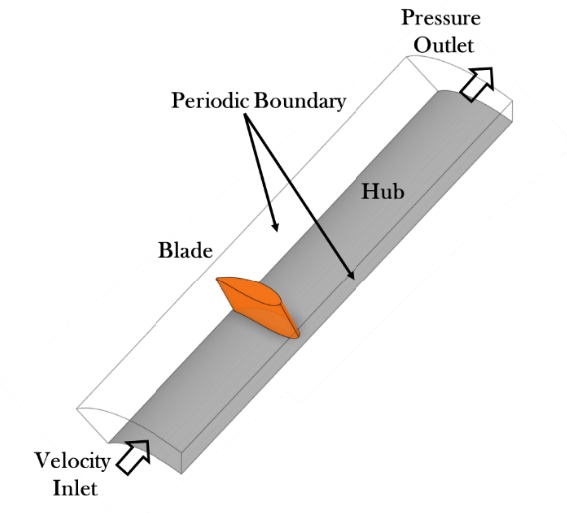
The specifications of the Wells turbine used in the numerical analysis are detailed in Table 1. The three-dimensional model of the Wells turbine was designed using the NACA0015 airfoil without camber, which was utilized in experimental setups. Due to the rotational and cyclic nature of the turbine's geometry and flow pattern, only a single blade section was modeled, as shown in Figure 4. To simplify the calculation conditions for all eight blades, periodic boundary conditions were applied.
The mesh used for the numerical analysis was generated using the Poly-Hexcore mesh type provided by Fluent, consisting of a total of 1.57e+06 mesh cells.
Poly-Hexcore Mesh optimizes accuracy, mesh efficiency, and geometric adaptability. It uses structured hexahedral meshes in the interior region to enhance computational efficiency and accuracy, while applying polyhedral meshes near boundaries to precisely capture complex geometries. This mesh is particularly advantageous for boundary layer treatment, enabling high-resolution flow analysis and reducing computation time for large-scale CFD problems, which is why this mesh type was employed.
During the generation of the computational grid, special attention was given to the mesh density near the wall to ensure reliable results, particularly since a low Reynolds number turbulence model was applied. Therefore, in the mesh used for the calculation, the first grid point concentrated on the rotor blade surface was set to satisfy a y+ value of ≤3.
The characteristics of the Wells turbine can be defined by the following dimensionless coefficients: the flow coefficient (Φ), the pressure coefficient (CP), the torque coefficient (CT), and the efficiency (η).
| (3) |
| (4) |
| (5) |
| (6) |
Many researchers have conducted studies on controlling the flow of the Wells turbine using various shapes and forms to enhance its performance. Additionally, the tip clearance was modeled with seven different values: 0% (no gap), 1%, 2%, 3%, 5%, 7%, and 10%, to evaluate the performance of the Wells turbine under different conditions
3. Research and Discussion
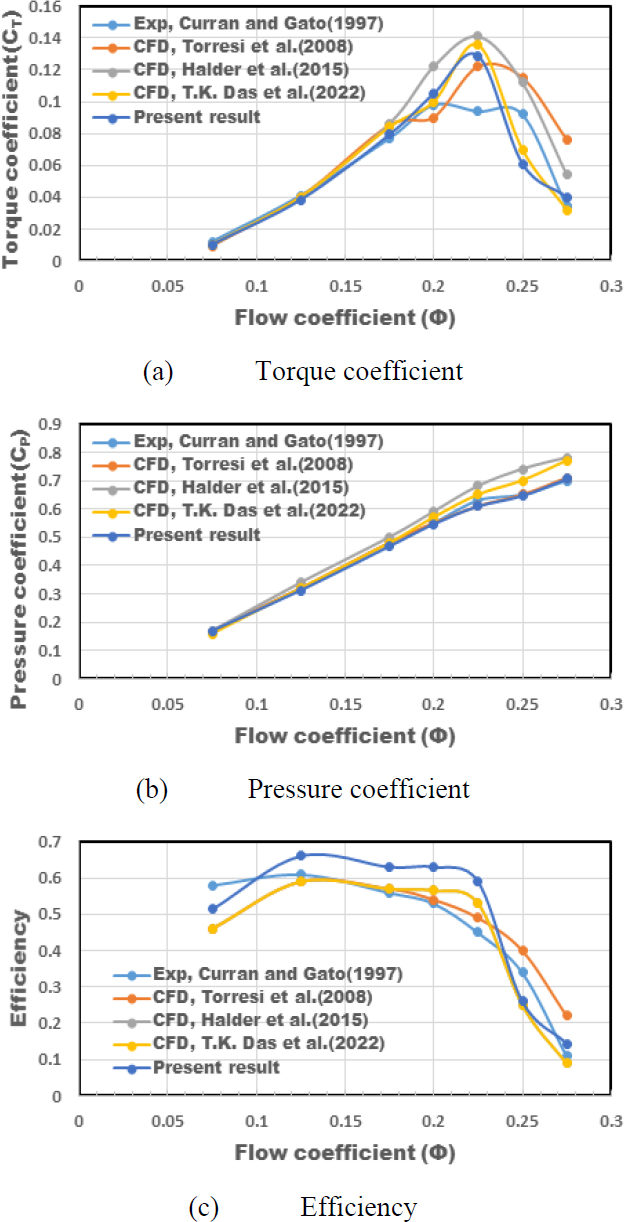
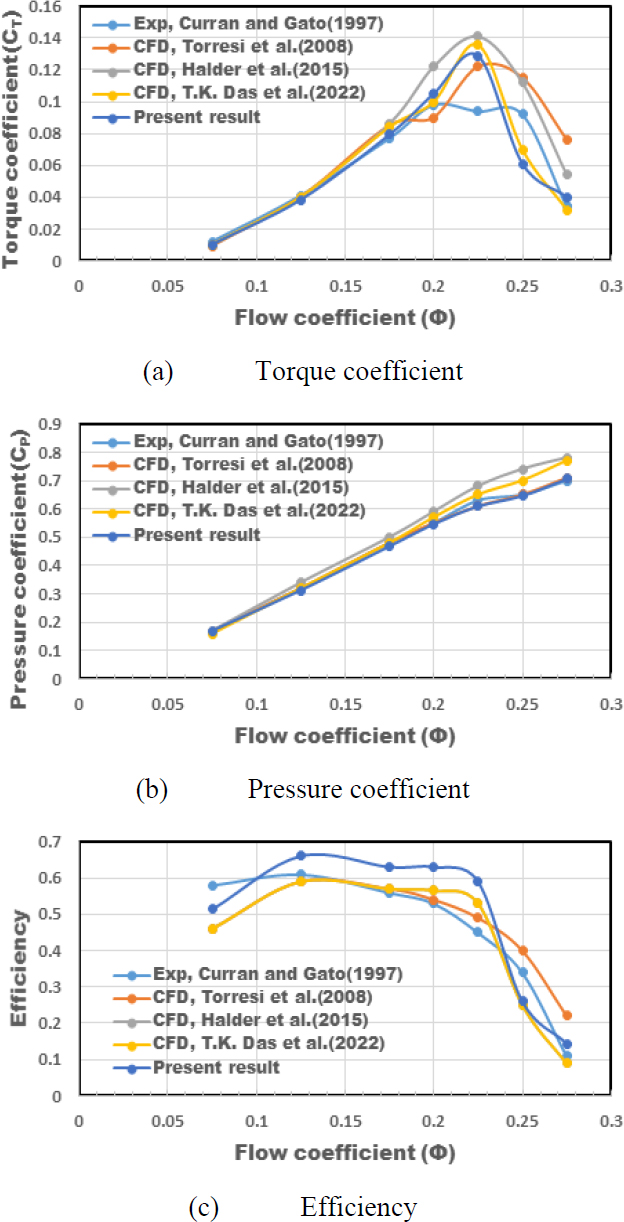
Before conducting the study on the effects of tip clearance and fillet radius on the performance of the Wells turbine, a comparison was made using experimental results and CFD results from other previous studies to validate the FLUENT code. The results of the calculations showed that the torque coefficient closely matched experimental results and the results of other researchers up to a flow coefficient of 0.175, with the maximum deviation from the experimental data being within ±2%.
Additionally, the stall of the Wells turbine used in this calculation occurred at a flow coefficient of 0.2 and reached its maximum at a flow coefficient of 0.225. The pressure coefficient increased linearly up to a flow coefficient of 0.2, after which the error between the experimental results and the calculated results increased [9].
Therefore, the study on the effects of tip clearance and fillet radius on Wells turbine performance in this paper was carried out based on a flow coefficient of 0.175.
3.1 Effect of Tip Clearance
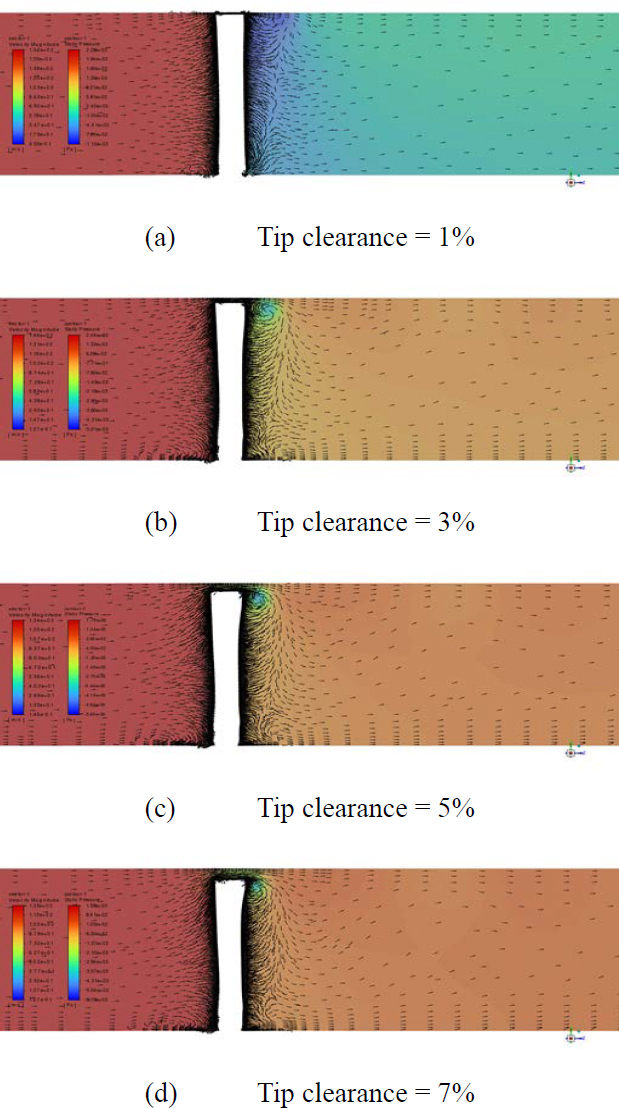
In Figure 8, the axial velocity is kept constant while the tip clearance is varied. It shows the axial velocity vector and pressure distribution at mid-chord. It can be observed that a tip vortex forms at the suction side of the tip edge when the tip clearance is 3%, due to high-speed jetting between the tip gaps. Additionally, unstable flow can also be seen at the hub region.
Figure 9 presents the torque, pressure coefficient, and efficiency for various tip clearances as the fillet radius increases. As the tip clearance increases, the torque, pressure coefficient, and efficiency generally decrease. However, for a tip clearance of 1%, the torque coefficient increases up to a fillet radius of 2%, after which it starts to decrease. For tip clearances greater than 2%, the fillet radius causes a steady decrease in these values. The highest efficiency is observed at a tip clearance of 1% and a fillet radius of 1%.
3.2 Effect of Fillet Radius
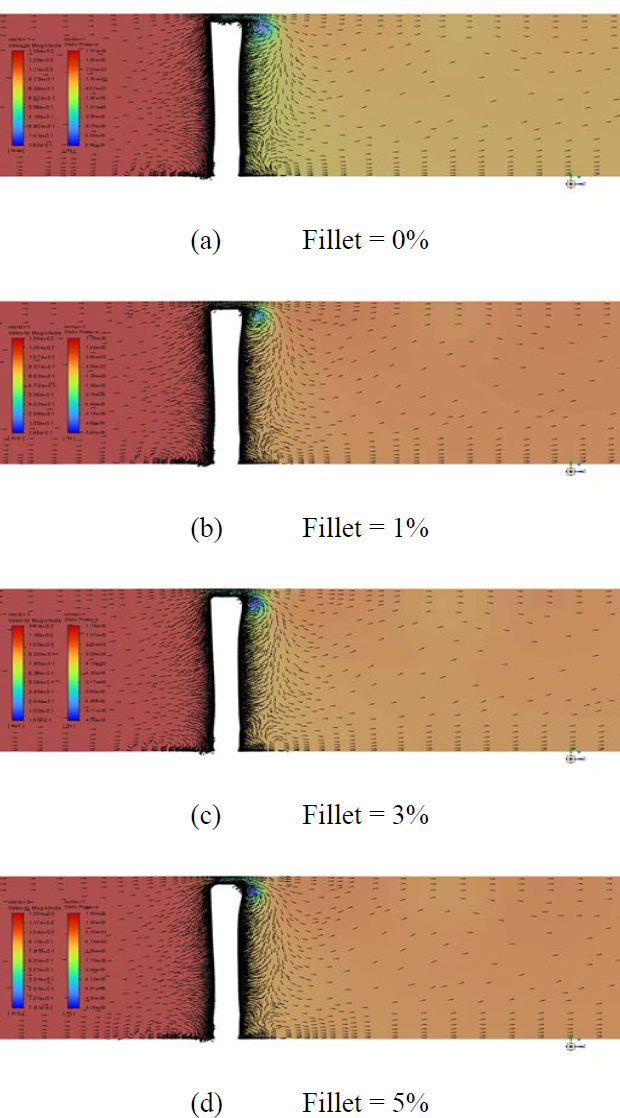
In Figure 10, the axial velocity vector and pressure distribution at the mid-chord are presented for a constant axial velocity while varying the fillet radius with a tip clearance of 2%.
The flow pattern appears similar across cases; however, the pressure distribution shows that the pressure difference between the pressure side and the suction side decreases as the fillet radius increases.
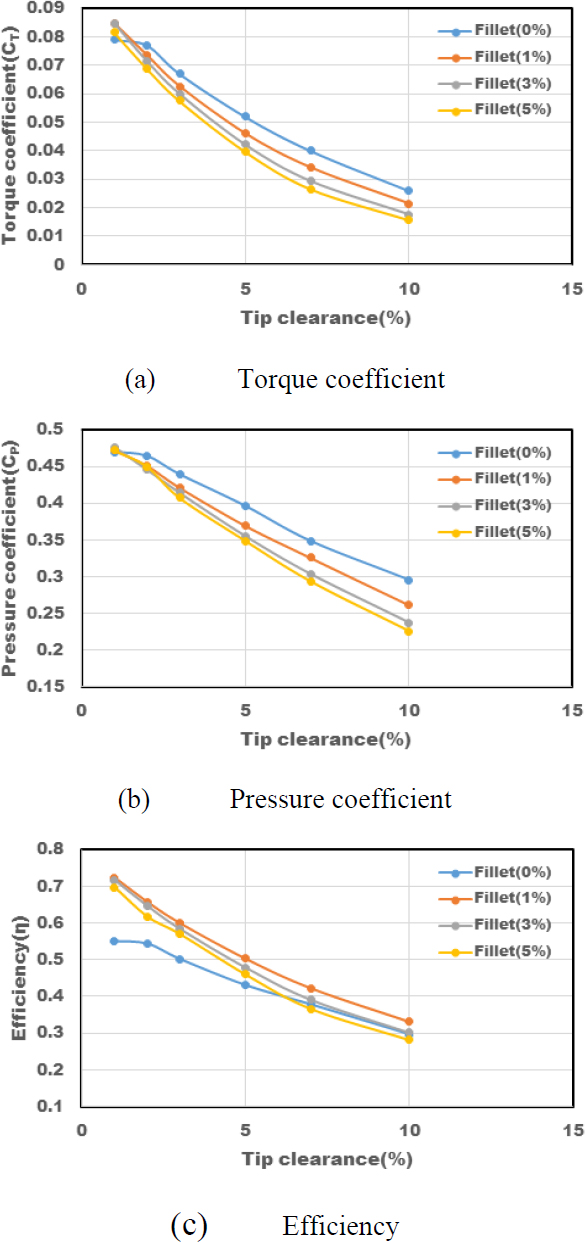
For the other cases, the torque coefficient decreases in a similar manner. The pressure coefficient also shows trends similar to the torque coefficient. In contrast, the efficiency is significantly lower for the 0% fillet radius compared to the other cases.
Figure 11 illustrates the torque coefficient, pressure coefficient, and efficiency characteristics when the fillet radius is 0%, 1%, 3%, and 5% for various tip clearances. In the case of a 0% fillet radius, the torque remains constant up to a tip clearance of 1% but then decreases sharply.
This is attributed to the increased wall friction caused by the restriction of flow from the pressure side to the suction side of the blade in the case of a 0% fillet radius.
4. Conclusion
In this study, the performance characteristics of a Wells turbine, commonly used in wave energy conversion, were analyzed using CFD for various parameters such as tip clearance and fillet radius.
To validate the Fluent code, CFD simulations were conducted under the same conditions as the experimental data. The results showed that the CFD results quantitatively matched the experimental data with high accuracy.
Regarding the effect of tip clearance on Wells turbine performance, torque, pressure, and efficiency decreased under all conditions. However, except for the 0% fillet radius, the decline was generally linear.
For various tip clearances, as the fillet radius increased, the torque coefficient and pressure coefficient decreased. However, at tip clearance = 1%, the values increased up to a fillet radius of 1% before decreasing thereafter.
From an efficiency perspective, the maximum efficiency was observed at fillet radius = 1%, after which the efficiency began to decline.
Nomenclature
| A : | The total blade area, (zcb) |
| Ar : | Rotor area, π |
| b : | Blade Span, m |
| c : | Blade chord, m |
| CD : | Drag force coefficient |
| CL : | Lift force coefficient |
| CP : | Pressure coefficient |
| CT : | Torque coefficient |
| D : | Drag force, N |
| L : | Lift force, N |
| FA : | Axial force, N |
| Ft : | Tangential force, N |
| Δp : | Static pressure drop, N/m2 |
| Q : | Flow rate through the rotor area, m3/s |
| Rh : | Rotor radius at hub, m |
| Rm : | Mean radius at hub, m |
| Rr : | Rotor radius , m |
| Rt : | Rotor radius at tip, m |
| VA : | Axial velocity, m/s |
| Utip : | Circumferential velocity, m/s |
| Z : | Number of blades |
| α : | Angle of attack, degree |
| ρ : | Air density, kg/m2 |
| η : | Turbine efficiency |
| σ : | Turbine solidity |
| Φ : | Flow coefficient |
| ω : | Rotor angular speed, rad/s |
Author Contributions
Conceptualization, Methodology, Software, Formal Analysis, Investigation, Resources, Data Curation, Writing-Original Draft Preparation, Writing-Review & Editing, Visualization, Supervision, Project Administration, Funding Acquisition, J. H. Kim.
References
-
A. F. O. Falcao and J. C. C. Henriques, “Oscillating-water-column wave energy converters and air turbines: A review,” Renewable Energy, vol. 85, pp. 1391-1424, 2016.
[https://doi.org/10.1016/j.renene.2015.07.086]

-
G. Dalton and B.P.O Gallachoir, “Building a wave energy policy focusing on innovation, manufacturing and deployment,” Renewable and Sustainable Energy Reviews, vol. 14, no. 8, pp. 2339-2358, 2010.
[https://doi.org/10.1016/j.rser.2010.04.007]

- MARINE ENERGY, http://www.emec.org.uk/marine-energy, , Accessed March 11, 2023.
- RESOURCE HUB, http://ore.catapult.org.uk, , Accessed November 12, 2023.
-
G. Dalton and B.P.Ó Gallachóir, “Building a wave energy policy focusing on innovation, manufacturing and deployment,” Renewable and Sustainable Energy Reviews, vol. 14, no. 8, pp. 2339-2358, 2010.
[https://doi.org/10.1016/j.rser.2010.04.007]

-
P. M. Kumar, “Nature-inspired design of a turbine blade harnessing wave energy” Proceedings of the Institution of Mechanical Engineers, Part A: Journal of Power and Energy, vol. 234, pp. 670-689, 2020.
[https://doi.org/10.1177/0957650919874620]

-
K. Tapas, E. Kerikous, N. Venkatesan, G. Janiga, D. Thevenin, and A. Samad, “Performance improvement of a Wells turbine through an automated optimization technique,” Energy Conversion and Management: X volume 16, 100285, 2022.
[https://doi.org/10.1016/j.ecmx.2022.100285]

-
P. Halder, S. H. Rhee, and A. Samad, “Numerical optimiza-tion of Wells turbine for wave energy extraction,” International Journal of Naval Architecture and Ocean Engineering, vol. 9, no. 1, pp. 11-24, 2017.
[https://doi.org/10.1016/j.ijnaoe.2016.06.008]

-
T. K. Das, E. Kerikous, N. Venkatesan, G. Janiga, D. Thevenin, and A. Samad, “Performance improvement of a Wells turbine through an automated optimization technique,” Energy Conversion and Management: X, vol. 16, 2022.
[https://doi.org/10.1016/j.ecmx.2022.100285]

- Ansys Fluent v. 2023R2 user guide.

