가스 확산층(GDL)내부의 물이 연료전지 성능에 미치는 영향


Copyright © The Korean Society of Marine Engineering
This is an Open Access article distributed under the terms of the Creative Commons Attribution Non-Commercial License (http://creativecommons.org/licenses/by-nc/3.0), which permits unrestricted non-commercial use, distribution, and reproduction in any medium, provided the original work is properly cited.
초록
본 연구에서는 연료전지 캐소드 가스 확산층에서의 물의 영향이 연료전지 성능에 미치는 영향을 검토하기 위하여 연료전지 스택의 부하 변동에 따른 가스 확산층에서의 2상 현상의 구현이 가능한 동적 모델을 개발하였다. 개발된 모델에 대하여 2상의 영향에 의한 연료전지 부하변동에 따른 연료전지 스택 성능, 가스 확산층 내부에서의 물 증기와 산소의 농도분포, 가스 확산층의 두께 및 다공성이 연료전지 스택 전압에 미치는 영향에 대하여 검토하였다. 그 결과 본 연구의 범위 내에서 연료전지 스택 전압은 부하에 관계없이 2상 모델이 1상 모델보다 낮아짐을 알 수 있다. 촉매층 부근 가스 확산층에서의 산소 농도는 가장 낮고 물 증기의 농도는 가장 높음을 알 수 있었다. 또한, GDL의 두께가 두꺼울수록 GDL의 다공성이 작을수록 연료전지 스택 전압이 낮아짐을 알 수 있었다.
Abstract
In this paper, a dynamic model describing the 2 phase effect on the gas diffusion layer depending on load change of a fuel cell stack was developed to examine the effects of liquid water in fuel cell cathode gas diffusion layer on the fuel cell performance. For the developed model, 2 phase effect on the performance of a fuel cell stack depending on the load changes, concentration distribution of water vapor and oxygen inside a gas diffusion layer, the effect of the thickness and porosity of the gas diffusion layer on the fuel cell stack voltage were examined. As a result, a fuel cell stack voltage for the 2 phase model within the scope of the research become lower than that for the 1 phase model regardless of the load. Although oxygen molar concentration for the gas diffusion layer adjacent to the catalyst layer was the lowest, water vapor concentration is the highest. In addition, as thickness and porosity of the gas diffusion layer increased and decreased, respectively, the fuel cell stack voltage decreased.
Keywords:
Fuel cell, Gas diffusion layer, Vapor, Liquid, Dynamic model키워드:
연료전지, 가스 확산층, 증기, 액체, 동적 모델1. 서 론
연료전지(Fuel Cell) 수소와 산소의 화학반응에 의하여 전기, 열 및 물을 생산하는 친환경 기술로 대기오염물질을 저감하기 위한 동력원으로 주목받고 있다[1]-[3]. 다양한 종류의 연료전지 중에서 고체고분자형 연료전지(PEMFC, Polymer Electrolyte Membrane Fuel Cell)는 비교적 낮은 운전온도, 짧은 시동시간 등의 특징을 가지고 있어 자동차 및 소형 선박 등에 사용되어지고 있는 기존의 내연기관을 대체할 동력 발생장치로 주목 받고 있다[4]-[6]. PEMFC는 스택의 운전온도, 가스 공급압력 및 습도 등과 같은 다양한 요인에 따라서 발전성능에 차이가 발생한다. 이러한 성능인자들이 PEMFC에 미치는 영향에 대하여 다양한 실험적 연구와 수치해석이 이루어지고 있다[7]-[9]. 운전 중인 PEMFC 스택의 캐소드(Cathode)측에서 생성되는 물은 가스확산층(GDL : Gas Diffusion Layer)층을 통과하여 캐소드 채널을 통하여 외부로 배출되게 된다. GDL내부에서의 산소의 농도는 생성되는 물의 영향 등으로 인하여 연속적으로 변화하며 연료전지 성능에 큰 영향을 준다. 연료전지 스택 내부에서의 물에 관한 현상을 물 증기로 간주하거나 물의 영향을 무시한 다양한 열역학적 모델 개발되었다[10][11]. 또한 GDL내부에서 물을 2상(Phase)으로 표현하는 모델을 개발하여 액체 물과 물 증기에 따른 연료전지 성능에 관하여 검토도 수행되어 지고 있다[12].
본 연구에서는 연료전지 캐소드 GDL에서의 물(Water)이 연료전지 스택의 성능에 미치는 영향을 검토하기 위하여 연료전지 스택의 부하 변동에 따라 GDL영역에서의 액체 물과 물 증기 2상의 물질전달 현상을 수학적으로 구현할 수 있는 동적 모델의 개발을 목표로 하고 있다. 개발된 모델에 대하여 연료전지 부하변동에 따라 2상의 영향 1상일 때와 비교하여 연료전지 스택 성능에 미치는 영향, 연료전지 부하변동에 따른 GDL 내부에서의 물 증기와 산소의 농도분포에 대한 검토, 연료전지 부하변동에 따른 GDL의 두께 및 GDL의 다공성이 스택 전압에 미치는 영향에 대하여 검토하였다.
2. 수치해석
2.1 전압 전류 방정식
본 연구에서는 Matlab 상용프로그램을 활용하여 아래에 기술되는 방정식을 기반으로 모델을 개발하였다. 연료전지 단셀 전압(Vcell)은 개회로 전압에서 활성화, 저항 및 농도과전압을 뺀 값이며 단셀 전압의 합이 스택의 전압(Vstack)이 된다.
개회로 전압(E)은 화학에너지와 전기에너지의 에너지 평형에 의한 온도와 압력의 함수로 정의된다[13].
활성화 과전압(ηact)은 온도와 산소 농도(co2)의 함수로 정의 되며 계수값은 참고문헌의 값을 사용하였다[13]-[15].
저항 과전압(ηohm)은 옴의 법칙에 따라 전류, 멤브레인 두께와 멤브레인 전도율을 함수로 표현된다[16][17].
멤브레인의 전도율(σmem)은 온도와 멤브레인 내부의 수분량에 따른 함수로 정의된다[16][17]
농도 과전압(ηcon)은 실험적으로 도출된 값으로 최대 전류밀도의 함수로 정의된다[14][15].
2.2 가스 확산층 방정식
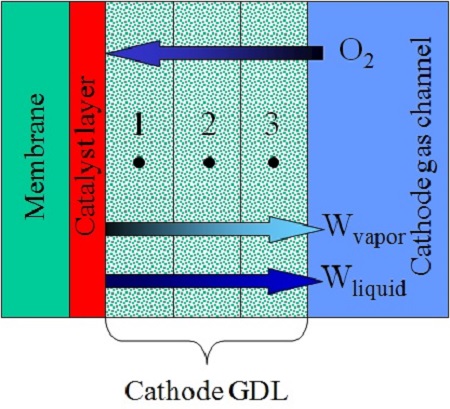
캐소드 GDL 내부에서 화학반응에 의해서 생성되는 물의 상태가 기체일 경우와 액체일 경우에 따라서 반응물인 산소의 물질 확산에 영향을 줄 것이다. 본 연구에서는 캐소드 GDL 내부에서 물과 물의 증기상태가 동시에 존재하는 2상의 경우를 고려하였다. 캐소드 GDL을 Figure 1에서 보이는바와 같이 3영역(3point)으로 분리하여 반응물질인 산소와 생성물질인 물에 대한 물질전달에 대하여 검토하였다.
GDL에서의 물질 확산은 기체와 액체 물의 확산 거동 및 다공성의 영향을 포함한 유효 확산율(<Dj>)로 다음과 같이 표현 된다[18][19].
GDL 내부에서의 액체 물의 부피는 GDL 내부에서의 물질 흐름의 합과 모세관에서의 물의 증발율로 나타낼 수 있다[18][19].
GDL 각각의 영역에서의 액체 물의 부피는 다음과 같이 정의된다[18][19].
모세관에서의 액체 물의 흐름은 압력구배에 의해서 표현되어진다[18][19].
모세관에서의 압력은 액체 물방울의 표면장력의 함수로 주어진다[18][19].
모세관에서의 몰 증발율은 다음과 같이 정의된다[18][19].
GDL 내부에서의 2상의 흐름은 압력과 농도의 영향을 받는다. GDL 각각의 영역에서의 산소농도와 증기의 증발율의 다음과 같이 계산되어진다[18][19].
GDL 각각의 영역에서의 농도 경계조건은 다음과 같이 표현할 수 있다.
GDL 각각의 영역에서의 산소와 증기의 몰플럭스는 가스 농도와 유효 확산율에 따라 계산되어진다[18][19].
산소와 증기의 몰플럭스는 전류의 함수이다[18][19].
GDL 각각의 경계영역에서의 산소와 증기의 몰플럭스 구배는 다음과 같이 표현할 수 있다.
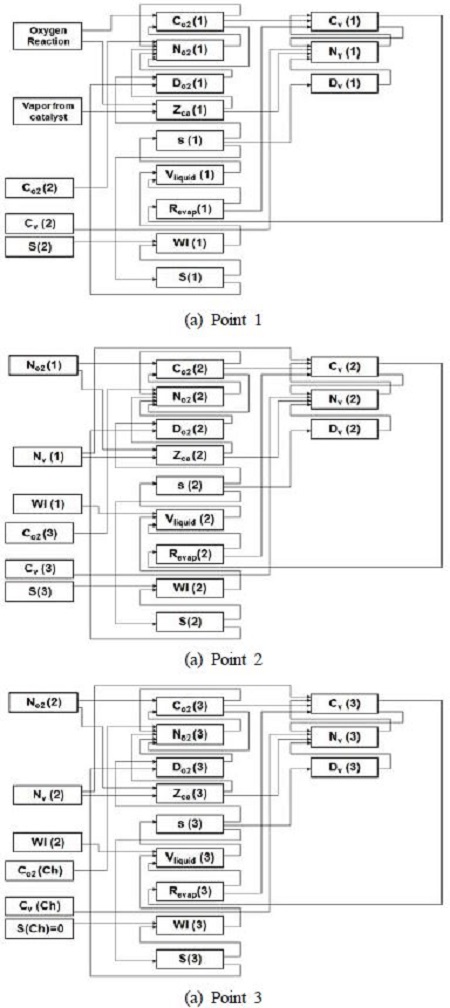
Figure 2는 GDL에서의 2상 모델의 수치계산 흐름도를 보여주고 있다.
3. 결과 및 고찰
3.1 1상 모델과 2상 모델의 비교
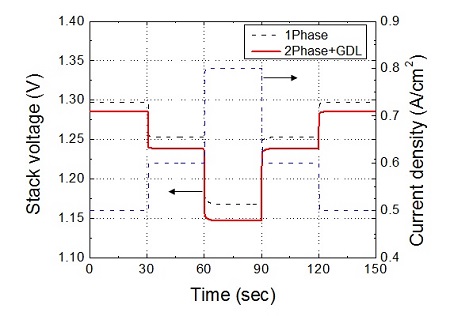
Figure 3은 1상 모델과 2상 모델에 대하여 수치해석을 수행한 결과를 보여주고 있다. 본 연구에서의 수치해석 조건은 애노드 가스인 수소가스의 공급에 대하여 화학양론비 = 1.2, 온도 = 333.15(K), 압력 1(atm) 및 상대습도 = 0(%)이고, 캐소드 가스인 공기에 대하여 화학양론비 = 3.0, 온도 = 333.15(K), 압력 1(atm) 및 상대습도 = 100(%)로 계산을 수행하였다. 연료전지 스택에 시간에 따라 부하를 0.5, 0.6 및 0.8 (A/cm2)로 변화를 주어 그에 따른 스택 전압의 변동을 검토하였다. 스택 전압은 각각의 부하에서 2상 모델이 1상 모델보다 낮음을 알 수 있다. 이는 캐소드 GDL 내부에서 2상 모델에 의해서 생성된 물의 영향으로 공기의 물질 확산이 감소하여 농도과전압이 높아지고, 압력강하가 증가하기 때문이다.
3.2 GDL 내부의 농도 분포
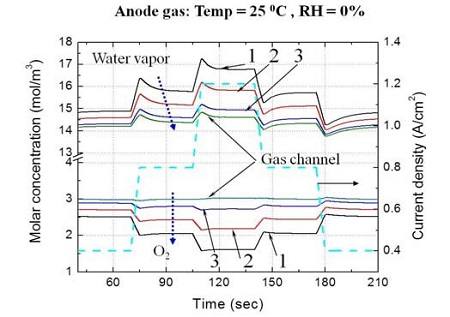
Figure 4는 연료전지 스택에 시간에 따라 부하를 0.4, 0.8 및 1.2 (A/cm2)로 부하를 주었을 경우 2상 모델의 캐소드 GDL 내부 3영역에서의 물 증기와 산소의 농도변화를 보여주고 있다. 각각의 영역에서 부하가 높아질수록 물 증기의 농도는 높아지고, 산소의 농도는 낮아짐을 알 수 있다. 이는 부하가 높아짐에 따라서 화학반응이 증가하여 물 증기의 생성량이 증가되기 때문이며, 산소의 농도는 부하가 높아짐에 따라서 많은 양이 화학반응으로 소비되어지기 때문이다.
각 영역에서의 물 증기의 농도분포는 부하에 관계없이 1번 영역에서 가장 높음을 알 수 있다. 이는 1번 영역이 화학반응이 일어나는 촉매층에 접해 있기 때문에 화학반응에 의해서 물 증기가 생성되기 때문이다. 산소의 농도분포는 부하에 관계없이 1번 영역이 가장 낮음을 알 수 있다.
이는 물 증기가 생성되는 것과 반대로 촉매층에 접해 있는 1번 영역에서 화학반응에 의해서 산소가 소비되어 지기 때문이다.
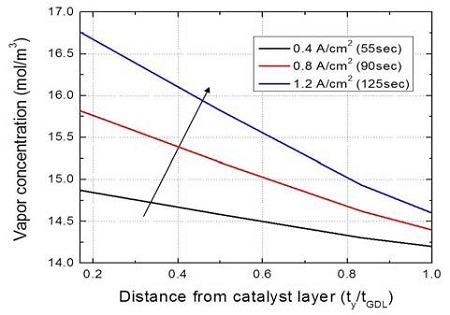
Figure 5는 GDL 영역에서의 거리에 따른 물 증기의 농도를 보여주고 있다. ty/tGDL = 0.0은 화학반응이 일어나는 촉매층을 의미하고, ty/tGDL = 1.0은 가스가 공급되는 가스 채널을 의미한다. 앞서 기술한 바와 같이 부하가 높을수록 물 증기의 농도가 높아짐을 알 수 있다. 또한, 촉매층 부근에서의 높은 물 증기의 농도는 가스채널로 갈수록 낮아짐을 알 수 있다. 이는 촉매층에서 생성된 물 증기가 가스 채널 방향으로 확산하여 이동을 하면서 일부가 응축이 되어 물로 변화하여 가스채널로 배출되기 때문이다.
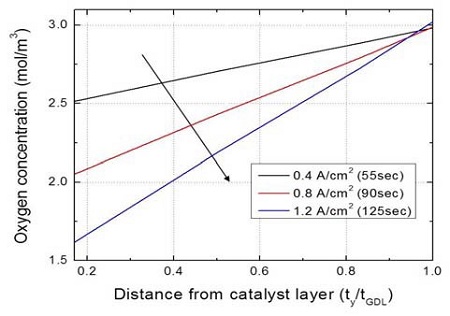
Figure 6은 GDL 영역에서의 거리에 따른 산소의 농도 변화를 보여주고 있다. 앞서 기술한 바와 같이 부하가 높을수록 산소의 농도가 낮아짐을 알 수 있다. 채널부근에서는 부하에 관계없이 동일한 산소 농도이지만 촉매층 부근에서는 낮은 부하에서는 산소의 농도가 높고 높은 부하에서는 산소의 농도가 낮아짐을 알 수 있다. 이는 높은 부하에서 물 증기 및 물의 생성량이 많아짐에 따라서 가스채널부에서 촉매층으로 산소가 확산이 어려워지는 영향과 산소의 반응속도가 빨라서 산소의 소비량이 증가하기 때문이다.
3.3 GDL 두께 및 다공성의 영향
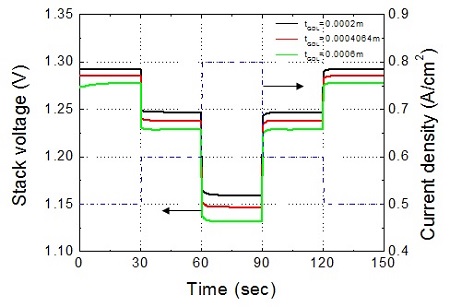
Figure 7은 2상 모델에 대하여 GDL의 두께의 변화에 따른 연료전지 스택 전압의 변화를 보여주고 있다. 부하를 0.5, 0.6 및 0.8 (A/cm2)로 변화를 주었을 경우 각각의 부하에서 GDL의 두께가 두꺼울수록 스택 전압이 낮아짐을 알 수 있다. 이는 GDL이 두꺼울수록 촉매층에서 생성된 물 증기 및 물이 촉매층에 많이 존재하여 산소의 확산을 방해하고, GDL 두께 자체가 가스 채널에서 촉매층으로 공급되는 산소에 대하여 저항의 역할을 하여 촉매층 부근의 산소 농도가 감소하기 때문이다.
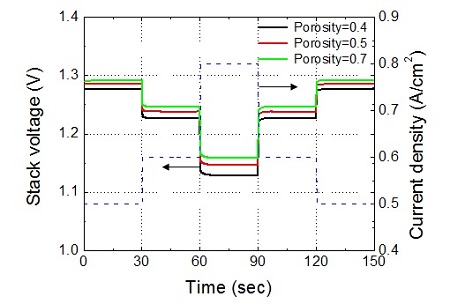
Figure 8은 2상 모델에 대하여 GDL의 다공성의 변화에 따른 연료전지 스택 전압의 변화를 보여주고 있다. 부하를 0.5, 0.6 및 0.8 (A/cm2)로 변화를 주었을 경우 각각의 부하에서 GDL의 다공성이 작을수록 스택 전압이 낮아짐을 알 수 있다. 이는 GDL의 다공성이 작아지면 GDL 내부를 확산하여 통과하는 산소의 압력손실이 증가하기 때문에 촉매층에서의 산소농도가 낮아지기 때문이다.
4. 결 론
본 연구에서는 연료전지 캐소드측 GDL 내부의 물이 연료전지 성능에 미치는 영향을 파악하기 위하여 GDL 내부의 물에 대한 2상의 구현이 가능한 수치해석 모델을 개발하여, 2상의 영향에 따른 연료전지 스택 성능에 관하여 검토하여 다음과 같은 결과를 얻었다.
- (1) 본 연구의 연구범위 내에서 연료전지 부하 변동에 따른 스택 전압은 액체 물의 영향을 포함한 2상 모델이 물 증기만을 표현한 1상 모델보다 낮아짐을 알 수 있다.
- (2) 연료전지 스택의 부하에 관계없이 촉매층에서 화학반응에 의하여 산소는 소비되고, 물 증기는 생성되기 때문에 촉매층 부근에서 산소의 농도는 가장 낮고, 물 증기의 농도분포는 가장 높음을 알 수 있다.
- (3) 캐소드 GDL의 두께가 두꺼울수록 산소의 물질 확산이 어려워져 농도과전압이 증가하고, GDL의 다공성이 작을수록 GDL 내부를 확산하여 통과하는 산소의 압력손실이 증가하기 때문에 연료전지 스택전압이 낮아진다.
Nomenclature
| a : | water activity |
| b : | parametric coefficient(V) |
| A : | area (m2) |
| c : | concentration of species (mol/cm3) |
| C : | mass concentration (kg/m3) |
| Cp : | specific heat capacity (J/kg·K) |
| Dm : | diffusion coefficient (m2/s) |
| <Dm> : | effective diffusivity (m2/s) |
| Dwater : | water diffusion coefficient |
| E : | open circuit potential (V) |
| i : | current density (A/m2) |
| I : | current (A) |
| K : | absolute permeability (m2) |
| m : | mass (kg) or O2 of vapor |
| M : | molecular mass (kg/mol) |
| n : | number of electrons (2 or 4) |
| nd : | electro-osmotic drag coefficient |
| p : | pressure (atm or Pa) |
| Q : | heat transfer ratio (W) |
| R : | resistance (Ω) |
| R1 : | ideal gas constant(J/kg·K) |
| Revap : | molar evaporation rate(mol/s·m3) |
| s : | liquid water saturation ratio |
| s1im : | level of immobile saturation(-) |
| S : | change in entropy (J/mol·K) |
| S1 : | reduced liquid water saturation(-) |
| t : | thickness (cm or m), time (s) |
| T : | temperature (K) |
| V : | volume (m3) or voltage (V) |
| x : | molar ratio(-) |
| ε : | porosity |
| ξ : | constant parametric coefficient |
| η : | over-potential (V) |
| λ : | water content |
| ρ : | mass density (kg/m3) |
| σ : | surface tension between water and air(N/m) |
| σmem : | membrane conductivity (1/Ω·cm) |
| μ : | viscosity (kg/m·s) |
| θc : | contact angle of the water droplet |
| γ : | volumetric condensation coefficient(-) |
| act : | activation |
| an : | anode |
| c : | capillary |
| ca : | cathode |
| conc : | concentration |
| e : | inlet and outlet of the capillary |
| ele : | electrical |
| fc : | fuel cell active |
| h2 : | hydrogen |
| i : | cell number |
| in : | inlet |
| j : | layer |
| k : | reactant or product gases |
| l : | liquid |
| max : | maximum |
| mem : | membrane |
| o2 : | oxygen |
| ohm : | ohmic |
| rl : | relative |
| p : | pore |
| sat : | saturation |
| sou : | source |
| v : | vapor |
References
-
M. H. Kim, “Analysis on the technology R&D of the fuel cell systems for power generation in ships”, Journal of the Korean Society of Marine Engineering, 31(8), p924-931, (2007), (in Korean).
[https://doi.org/10.5916/jkosme.2007.31.8.924]

-
S. K. Park, and M. E. Kim, “A study on thermal management of stack supply gas of solid oxide fuel cell system for ship applications”, Journal of the Korean Society of Marine Engineering, 35(6), p765-772, (2011), (in Korean).
[https://doi.org/10.5916/jkosme.2011.35.6.765]

-
K. C. T. Lawrence, W. Steven, M. Niall, U. Bernhard, and M. B. Ricardo, “Soild oxide fuel cell/gas turbine trigeneration system for marine application”, Journal of Power Sources, 196(6), p3149-3162, (2011).
[https://doi.org/10.1016/j.jpowsour.2010.11.099]

- K. J. Park, H. J. Ji, and J. M. Bae, “Study of operation strategy for hybrid PEM fuel cell and super-capacitor”, Transactions of the Korean Society fo Mechanical Engineers (B), 30(8), p756-763, (2006), (in Korean).
-
S. Gunter, “Fuel cells going on-board”, Journal of Power Sources, 86(1-2), p61-67, (2000).
[https://doi.org/10.1016/S0378-7753(99)00414-0]

- D. Y. Park, H. K. Yang, and J. S. Oh, “Power system using the fuel cell (PEMFC) for the leisure ship”, Proceedings of the Korean Society for Power System Engineering Conference, p225-225, (2012), (in Korean).
-
J. H. Lee, M. Y. Lee, S. S. Lee, I. S. Nam, and D. H. Lee, “An experimental study on the performance of PEMFC stack depending on operating conditions”, Journal of the Korean Society of Marine Engineering, 33(5), p770-777, (2009), (in Korean).
[https://doi.org/10.5916/jkosme.2009.33.5.770]

-
K. Y. Kim, Y. J. Sohn, M. J. Kim, and W. Y. Lee, “Numerical study on the effects of GDL porosity on the PEMFC performance”, Transactions of the Korean Society of Mechanical Engineers (B), 33(12), p1022-1030, (2009), (in Korean).
[https://doi.org/10.3795/KSME-B.2009.33.12.1022]

-
M. Khandelwal, S. H. Lee, and M. M. Mench, “One dimensional thermal model of cold-start in a polymer electrolyte fuel cell stack”, Journal of Power Sources, 172(2), p816-830, (2007).
[https://doi.org/10.1016/j.jpowsour.2007.05.028]

-
M. Sundaresan, and R. M. Moore, “Polymer electrolyte fuel cell stack thermal model to evaluate sub-freezing startup”, Journal of Power Sources, 145(2), p534-545, (2005).
[https://doi.org/10.1016/j.jpowsour.2004.12.070]

-
Y. Shan, and S. Y. Choe, “Modeling and simulation of a PEM fuel cell stack considering temperature effects”, Journal of Power Sources, 158(1), p274-286, (2006).
[https://doi.org/10.1016/j.jpowsour.2005.09.053]

-
A. J. del Real, A. Arce, and C. Bordons, “Development and experimental validation of a PEM fuel cell dynamic model”, Journal of Power Sources, 173(1), p310-324, (2007).
[https://doi.org/10.1016/j.jpowsour.2007.04.066]

-
J. C. Amphlett, R. M. Baumert, R. F. Mann, B. A. Peppley, P. R. Roberge, and T. J. Harris, “Performance modeling of the ballard mark IV solid polymer electrolyte fuel cell”, Journal of the Electrochemical Society, 142(1), p1-8, (1995).
[https://doi.org/10.1149/1.2043866]

-
Z. H. Mo, X. J. Zhn, L. Y. Wei, and G. Y. Cao, “Parameter optimization for a PEMFC model with a hybrid genetic algorithm”, International Journal of Energy Research, 30(8), p585-597, (2006).
[https://doi.org/10.1002/er.1170]

-
J. M. Correa, F. A. Farret, L. N. Canha, and M. G. Simoes, “Performance modeling of the ballard mark IV solid polymer electrolyte fuel cell”, IEEE Transactions on Industrial Electronics, 51(5), p1103-1112, (2004).
[https://doi.org/10.1109/TIE.2004.834972]

-
T. E. Springer, T. A. Zawodzinski, S. Gottesfeld, “Polymer electrolyte fuel cell model”, Journal of the Electrochemical Society, 138(8), p2334-2342, (1991).
[https://doi.org/10.1149/1.2085971]

-
T. V. Nguyen, and R. E. White, “A water and heat management model for proton‐exchange‐membrane fuel cells”, Journal of the Electrochemical Society, 140(8), p2178-2186, (1993).
[https://doi.org/10.1149/1.2220792]

- D. A. McKay, W. T. Ott, and A. G. Stefanopoulou, ASME International Mechanical Engineering Congress & Exposition, no. IMECE 2005-81484, (2005).
-
J. H. Nam, and M. Kaviany, “Effective diffusivity and water-saturation distribution in single- and two-layer PEMFC diffusion medium”, International Journal of Heat and Mass Transfer, 46(24), p4595-4611, (2003).
[https://doi.org/10.1016/S0017-9310(03)00305-3]

