Experimental study on hydrolysis of urea−water solution by compression pressure of diesel engines
Copyright © The Korean Society of Marine Engineering
This is an Open Access article distributed under the terms of the Creative Commons Attribution Non-Commercial License (http://creativecommons.org/licenses/by-nc/3.0), which permits unrestricted non-commercial use, distribution, and reproduction in any medium, provided the original work is properly cited.
Abstract
Exhaust gases generated during combustion in diesel engines are harmful to the environment. Therefore, carbon-free fuels have attracted attention as alternative fuels to achieve decarbonization goals. In this study, a system was developed to supply ammonia, a carbon-free fuel for diesel engines, from a urea–water solution (UWS). The generation of ammonia in the combustion chamber was verified when the UWS was injected into the intake system using a device supplying the UWS to the selective catalytic reduction system, which is used to reduce nitrogen oxides in diesel engines. The experimental results revealed that ammonia was generated at the compression temperature by motoring at 900 rpm without firing. Compared to the maximum compression pressure of the combustion chamber when only air was compressed, the maximum compression pressure when the urea−water solution was added decreased by 0.17%. By measuring the ammonia concentration in the exhaust gas pipe, an average of approximately 103 ppm was emitted. This value was estimated to be approximately 2.4% of the theoretical amount of the sprayed urea−water solution. In the future, we plan to develop a greenhouse-gas-reduction technology for diesel engines using a urea−water solution by investigating the effective solution injection and increasing the ammonia conversion rate.
Keywords:
Urea−water solution, Hydrolysis, Ammonia, Diesel engine, Compression pressure1. Introduction
Exhaust gases generated during combustion in diesel engines contain six types of harmful substances. Unburned hydrocarbons, carbon monoxide, and particulate matter are generated during incomplete fuel combustion, whereas carbon dioxide is generated from complete combustion. Nitrogen and sulfur oxides are also generated during the combustion process. Strict regulations on these harmful substances have been imposed, except for carbon dioxide. However, with the emergence of severe climate change, regulations on carbon dioxide emissions have recently been strengthened. The 80th Marine Environment Protection Committee of the International Maritime Organization established a greenhouse-gas-reduction strategy to be implemented by 2050 and expressed a strong commitment to decarbonization. The importance of alternative fuels is being emphasized to achieve decarbonization goals, and attempts to decarbonize the shipping industry are expected to continue.
Among alternative fuels used for decarbonization, ammonia is a carbon-free fuel that does not emit carbon dioxide during combustion. Thus, ammonia has attracted attention as a fuel with the potential of minimizing greenhouse gas emissions [1]-[6]. Ammonia has a lower flame speed than other fuels [1] but requires additional safety systems owing to its toxicity and corrosiveness. Infrastructure and safety devices are required to ensure the safe handling and storage of ammonia, which incur additional costs. Therefore, a medium that can safely supply ammonia to diesel engines can play a significant role in achieving decarbonization by using ammonia as fuel. In this study, we conduct experiments and numerical analyses using a urea–water solution (UWS), which is easy to handle and store and can be converted into ammonia. The composition of the UWS is similar to that of an aqueous ammonia solution, but it poses no explosion risk during storage, making it easy to handle and usable in a liquid form.
A selective catalytic-reduction (SCR) system based on exhaust gas post-treatment technology is used to reduce nitrogen oxides emitted from diesel engines. The SCR system uses urea as the reducing agent. During the reduction process, the UWS injected into the exhaust gas is hydrolyzed by high heat to generate ammonia, and nitrogen oxides are converted into nitrogen and water by ammonia. Various studies have been conducted on urea hydrolysis in SCR systems. Payri et al. [7] and An and Kim [8] investigated the spraying behavior of urea in SCR. Ku et al. [9] experimentally determined the conversion rate of urea into ammonia in an exhaust pipe and found that the conversion rate increased by approximately 30%–40% for the exhaust gas at 250 °C compared to that at 210 °C. Habchi et al. [10] found that, when the injection speed of the UWS was low, the conversion rate increased to 80% at 400 °C. Because the ignition point of diesel oil is approximately 250 °C, the temperature of the combustion chamber in the compression stroke is significantly higher than this value, and the temperature in the combustion chamber increases to that at which the UWS can be hydrolyzed. Therefore, ammonia can be supplied as fuel through hydrolysis if the UWS is supplied to the combustion chamber. In this study, a conversion rate of 2.4% was obtained; this is because the analyzed characteristics differed from those of previous studies in that UWS was injected into the intake system. The conversion process inside the cylinder was analyzed, independent of the residence time, temperature profiles, and presence of catalysts. In addition, because the urea injection method differed from that used in conventional SCR systems, the resulting distinct conversion process was examined.
This study proposes a method for using a UWS to supply ammonia, a carbon-free fuel, to diesel engines. In particular, we attempt to experimentally verify whether ammonia could be generated in the combustion chamber by spraying the UWS into the intake system using the currently used device for supplying the UWS to the SCR system. This experiment aims to determine whether ammonia is produced at the compression temperature generated by simple motoring. In addition, through numerical analysis, we aim to create basic data for use in various engines by comparing the combustion chamber temperature and the amount of generated ammonia with the experimental values.
The remainder of this paper is organized as follows: Section 2 provides an explanation of the hydrolysis process of UWS. In Section 3, the experimental methods and numerical analysis are detailed. Section 4 presents a discussion of the experimental and numerical analysis results. Finally, Section 5 concludes the study and outlines directions for future research.
2. Hydrolysis of UWS
The UWS used in the hydrolysis experiment was designed for automobiles and consisted of 32.5% urea (CH4N2O) and 67.5% water. The process for converting ammonia into a gaseous state after spraying the UWS is expressed as follows [8].
| (1) |
| (2) |
| (3) |
Equation (1) shows the process of moisture evaporation from the sprayed droplets of the UWS. One mole of an automotive UWS is decomposed, producing 1 mol of urea and 6.9 mol of water. Equation (2) indicates that 1 mol of urea produces 1 mol of gaseous ammonia and 1 mol of isocyanate via thermal dissociation. Equation (3) shows the process in which 1 mol of isocyanate gas is converted into 1 mol of ammonia and 1 mol of carbon dioxide through hydrolysis. Ammonia is produced from a UWS in three steps. Theoretically, when 1 mol of urea is decomposed, 2 mol of ammonia is generated. The energy required to evaporate the UWS is the sum of the energy required for temperature increase and evaporation. The maximum temperature was determined based on the compression heat resulting from a maximum cylinder pressure of 40 bar. Additionally, the conversion rate to ammonia was calculated based on its molar mass. The mass flow rate of the UWS measured at a 100% load of the urea−water injection pump used in this study was 77.5 mg/s. The mass flow rate of the intake air was 5,548 mg/s. The conversion rate into ammonia was calculated using the molar masses of the materials that comprised the UWS (air: 29, H2O: 18, CO(NH2)2: 60, NH3: 17, and CO2: 44 g/mol). The theoretical amount of fully converted ammonia was calculated to be 4,304 ppm. However, the amount of ammonia produced based on Equation (3) may be very small, depending on the surrounding environment [8]. The timing of the reaction is particularly crucial, and in the absence of a catalyst, sufficient time must be provided for the UWS to effectively convert into ammonia.
The thermal dissociation of urea involves a reaction that breaks down the substance into its components using thermal energy at high temperatures, whereas hydrolysis converts a compound into another compound through a reaction with water. In this study, we analyzed the hydrolysis process of the UWS owing to the presence of water.
3. Methods
3.1 Experimental Method
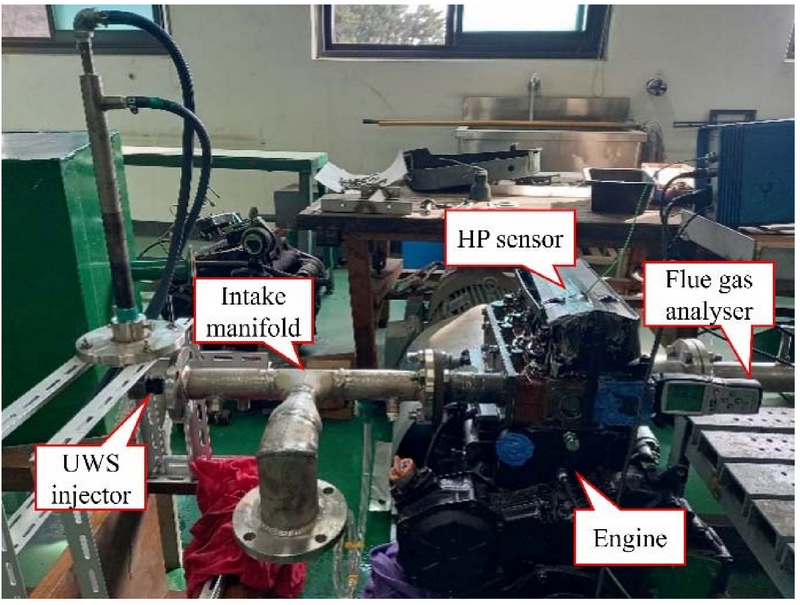
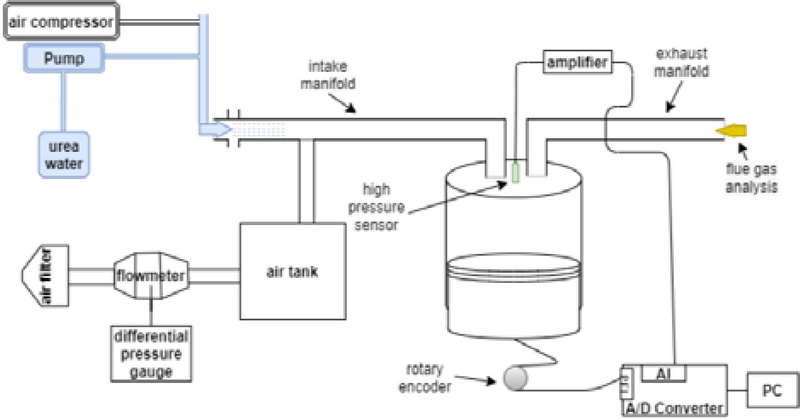
Figure 1 shows a photograph of the experimental equipment, and Figure 2 shows its schematic. The diesel engine was a three-cylinder, naturally aspirated engine, and the intake and exhaust manifolds were removed to conduct the experiments on the first cylinder. The diesel engine was then rotated at 900 rpm using a motor with specifications listed in Table 1.
The engine operated in a cold-flow state, where no combustion occurred, and was driven by a motor connected to a flywheel. Consequently, both the fuel-injection system of the experimental apparatus and the cooling system of the cooling jacket were deactivated. This effectively eliminated the external factors that might influence the compression heat generated by the compression stroke in the cylinder.
The intake airflow rate was measured using a laminar flowmeter (LFE-100B; Sokken) to block the UWS injection line. The mass flow rate was measured at the inlet point of the intake manifold, and the differential pressure of the laminar flowmeter was monitored using a differential pressure gauge (FCO332, FC). The average measured flow rate was 5.548 g/s at an engine revolution speed of 900 rpm. Even when measuring without blocking the UWS injection line, the results showed a difference of within 0.5%. This value was within the error range of the laminar flowmeter, indicating that the UWS injection line did not affect the intake airflow to the experimental engine. The combustion chamber pressure was measured at time intervals of 0.5° of the crankshaft angle using a high-pressure sensor (Kistler (6051A). The measured pressure data were acquired using a data acquisition system equipped with a piezoresistive amplifier. The injection angle of the UWS injector was approximately 90°, which has the disadvantage of spreading significantly compared with the small exhaust gas diameter. The UWS was continuously sprayed, and the average amount of sprayed UWS was 77.5 mg/s. The amount of converted ammonia in the exhaust gas line was measured using an ammonia meter (ECOM, MK-9000). We aimed to compare the measured amount of converted ammonia with the theoretical maximum value of 4,304 ppm calculated in Section 2. To establish a benchmark for the maximum amount of converted ammonia that can be obtained in future experiments, we analyzed the factors influencing the conversion rate and compared the results obtained under various conditions. The results obtained using the ensemble average of the data measured over 15 min under identical conditions were used to validate the experimental data. Measurements were performed after the motor connected to the flywheel reached a stable rotational speed. The measurements were conducted in an environment where no external forces acted.
An injector used in automotive SCR systems was employed in the UWS injection system, featuring a three-hole design, in which 0.023 g of UWS was injected in a single spray. The pump was drawn from the UWS tank and supplied the UWS to the injector at a pressure of 6 bar. The injection was started at 338 CAD and completed at 140 CAD, resulting in a total injection duration of 0.026 s. Various attempts have been made to prevent UWS from accumulating in areas other than the cylinder. For example, the number of holes in the injector have been adjusted for spraying experiments, and visualization of the spray patterns at various distances have been attempted using photography techniques. However, the issue of UWS accumulation has not been completely resolved. Accumulation is expected to occur in the intake system unless the UWS is directly injected into the cylinder. In this study, a three-hole injection system, which is the most optimized method for configuring the intake system of the engine, was used to perform the experiments and obtain the results.
3.2 Computational Fluid Dynamics Analysis Method
The geometries of the intake port, cylinder, and exhaust port of the diesel engine were modeled and numerically analyzed using Ansys Fluent. The UWS was injected into the intake valve zone, assuming that it uniformly mixed with air. Because the main observation target was the flow inside the cylinder, the intake and exhaust ports were created with low-density meshes. The compression stroke of the cylinder was implemented with a dynamic mesh, with the number of meshes being 1.8 million at the bottom dead center (BDC) and 800,000 at the top dead center (TDC). The number of meshes was determined through a mesh-dependency analysis. The mesh dependency was confirmed for the BDC and TDC meshes to validate whether the cylinder pressure increased owing to the compression stroke. Although reasonable results were obtained at mesh densities of 1.8 million and higher at the BDC and 400,000 and higher at the TDC, a numerical analysis was performed using 800,000 meshes at the TDC to implement a dynamic mesh. Table 2 lists the setting conditions for hydrolysis analysis of the UWS. A volumetric chemical species transport reaction model was used for the numerical analysis. This enabled the consideration of interactions within the continuous phase. The initial and boundary conditions were applied based on the experimental values.
4. Results
4.1 Cylinder Pressure and Temperature
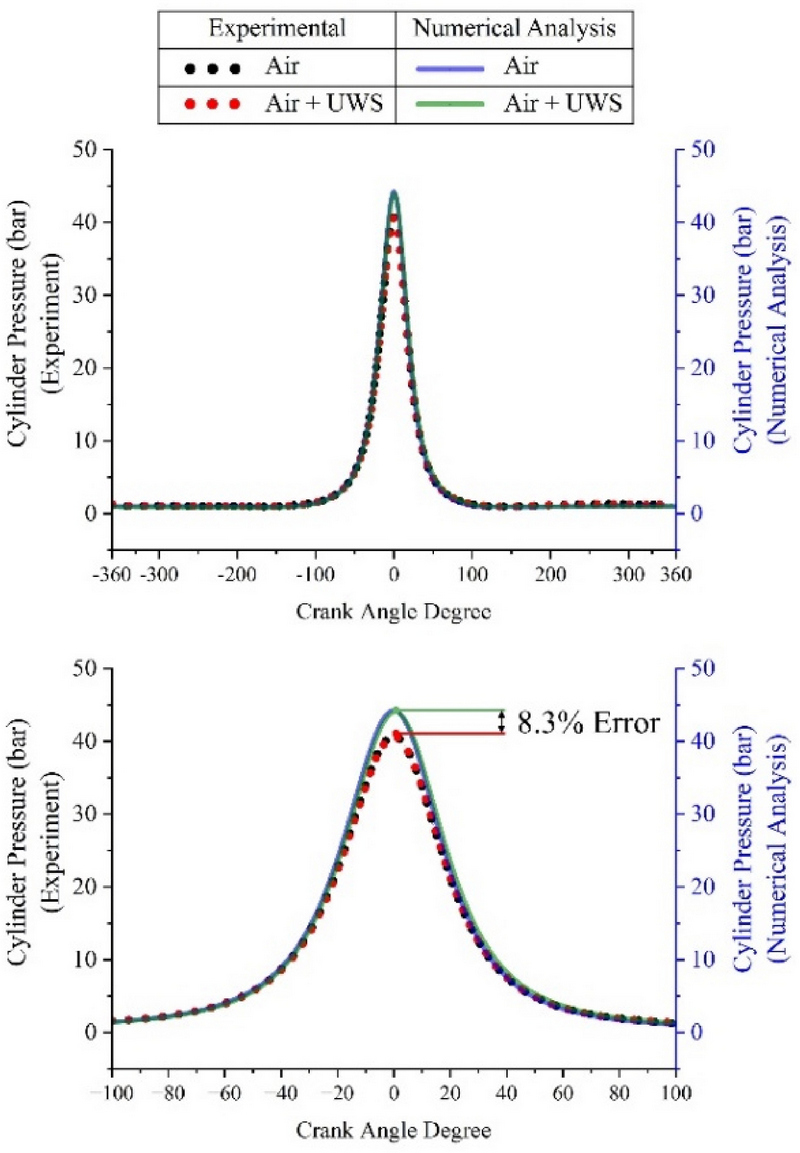
Figure 3 shows a comparison between the experimentally measured cylinder pressure and the pressure calculated using numerical analysis. In addition, the experimental and numerical analysis results were compared for cases in which only air and a mixture of UWS and air entered. The maximum pressure point was the same for the experimental and numerical analysis. The maximum pressure point with only air was at 0 CAD, whereas that with the UWS−air mixture was at 0.5 CAD. The maximum pressure point with the mixture was higher than that with only air because the UWS decomposed, and heat was lost in the combustion chamber, resulting in a delayed effect.
In the experiment, the maximum pressure with only air was 40.72 bar, and that with the UWS−air mixture was 40.65 bar. When the UWS was sprayed, the maximum compression pressure decreased by 0.17%. This slight difference is attributed to the heat absorbed during the UWS decomposition during the compression process, which can occur even in the absence of combustion. The numerical analysis yielded maximum pressure values of 44.19 bar for the air-only intake and 44.04 bar for the UWS−air mixture intake. The numerical analysis results showed an error that was 8.3% higher than that of the experimental results. The calculation of the cylinder pressure using numerical analysis has limitations that make it challenging to obtain accurate results. These errors arise not only because the numerical analysis model cannot perfectly replicate the actual phenomena, but also because of differences in the physical conditions used to determine the decomposition rate of urea and heat loss at the cylinder walls. The experimental derivation of correction values for numerical analysis can reduce the discrepancies between the experimental results, improving the results. However, because the timing of the pressure increase was the same, no problem was assumed to exist in predicting this trend. Therefore, numerical analyses of the cylinder temperature and UWS response were conducted.
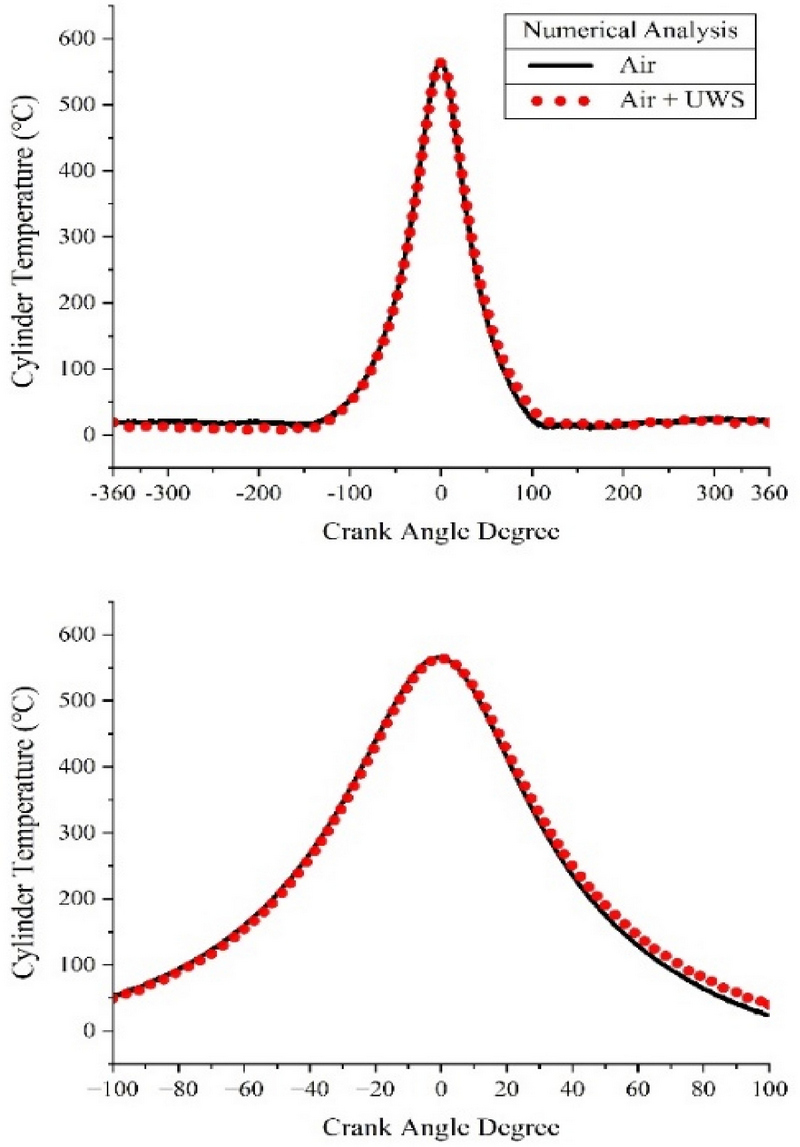
Figure 4 shows the temperature in the cylinder calculated using numerical analysis. The temperature in the cylinder proportionally increased with the pressure in the cylinder, reaching a maximum value of 564.89 °C when only air entered, and up to 564.11 °C when the mixture of air and UWS entered.
4.2 Ammonia Conversion
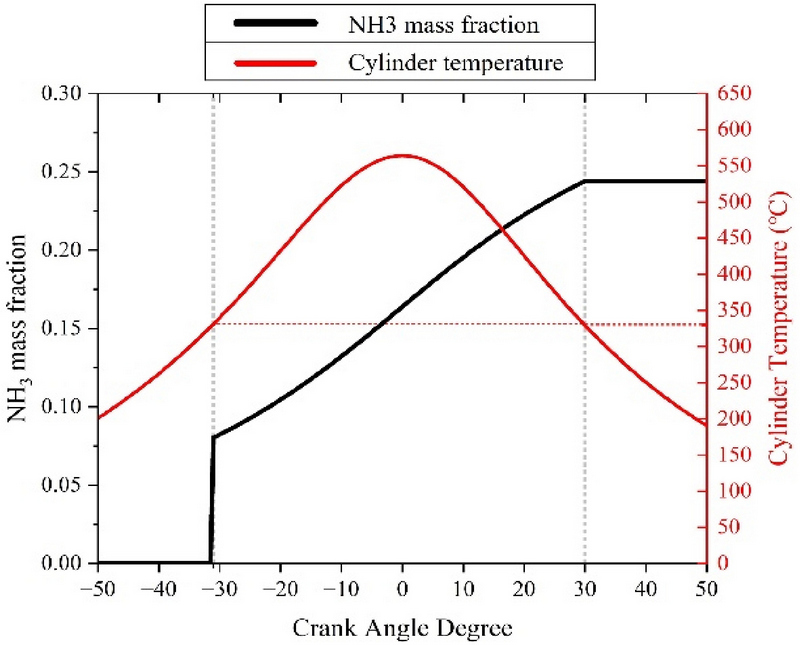
The calculation results were analyzed using numerical analysis to predict the amount of ammonia converted through thermal decomposition and hydrolysis of the UWS. Figure 5 shows the mass fraction of urea converted into ammonia as a function of the temperature in the cylinder. The UWS started transforming into ammonia at −31 CAD (331.10 °C). As the ammonia mass fraction continued to increase and reached 30 CAD as the piston descended, the temperature reached 329.09 °C, and the UWS no longer transformed into ammonia.
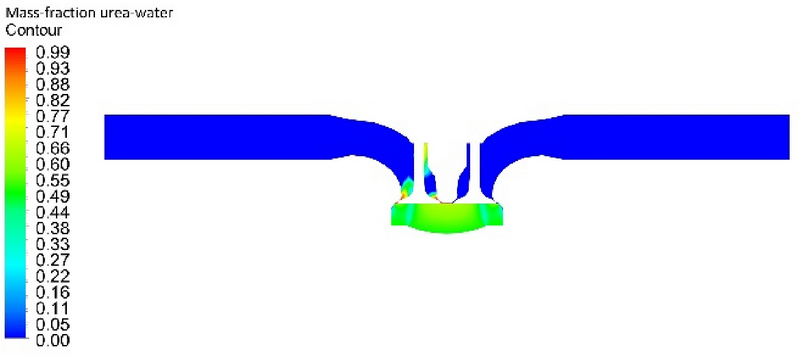
Figure 6 shows the mass fraction of the UWS at −23 CAD, the point at which the UWS began transforming into ammonia. At this time, the temperature in the cylinder was 404 °C. The contour represents the mass fraction of the UWS in the overall substance. A value of zero indicates the absence of a UWS. During the compression stroking of the cylinder, chemical reactions occurred owing to the compression heat, resulting in the generation of a UWS.
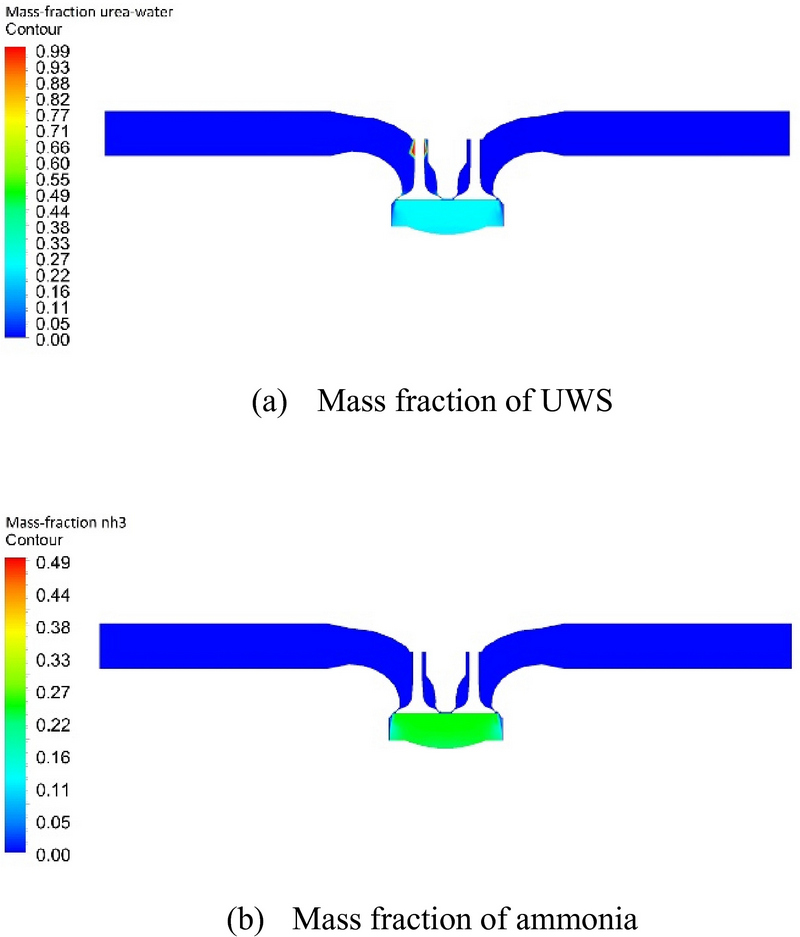
Figure 7 (a) and (b) shows the mass fractions of the UWS and ammonia at 30 CAD, respectively, after which the UWS no longer transformed into ammonia. The numerical analysis results showed that the UWS converted into ammonia when the temperature in the cylinder was approximately 330 °C or higher. This temperature value (330 °C) corresponds to pressure of approximately 13.09 bar in the cylinder. In other words, the UWS is expected to convert into ammonia when the compression pressure in the cylinder is approximately 13.09 bar or higher.
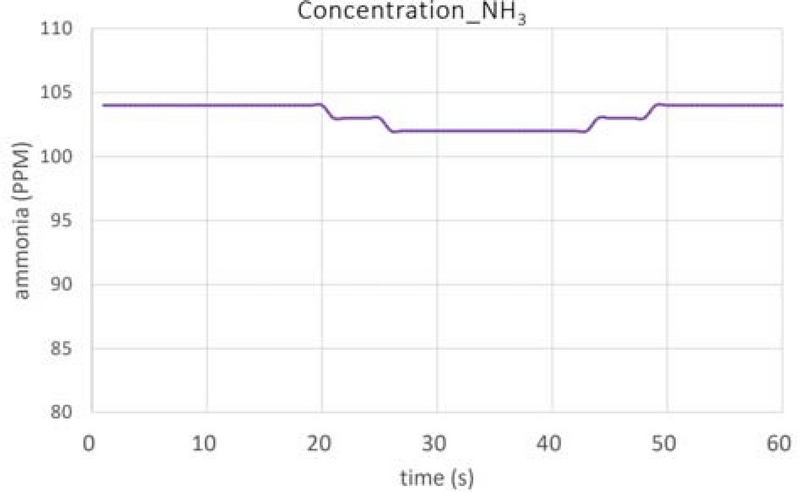
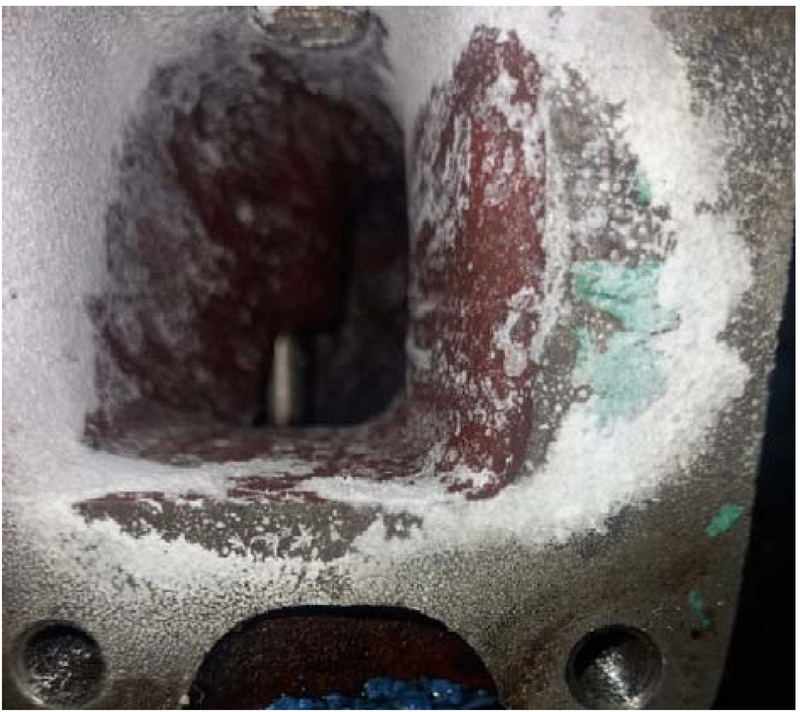
Figure 8 shows the results of the ammonia concentration measurements in the exhaust gas line for 1 min. The average value was approximately 103 ppm, which was only 2.4% of the 4,304 ppm that would theoretically be produced when fully converted. The following three reasons may cause this. (1) Not all the total mass of UWS injected into the intake line entered the combustion chamber; only a portion was introduced. The injection angle of the injected UWS may cause some of the UWS to settle on the walls of the intake line or manifold. In this study, the experimental setup was designed to inject the UWS while the intake valve was open; however, a portion of the UWS settled on the intake valve. Future research is required to improve the settling amount by optimizing the injection angle of the UWS and using mixers. (2) A low amount of the UWS thermally decomposed into a gaseous form at low temperatures of the intake line. (3) The reaction time required for the UWS to undergo hydrolysis in the combustion chamber was insufficient. In particular, in case (1), as explained in Section 3, the injection angle is large compared to the pipe diameter; hence a large amount of urea accumulates in the pipe, intake port, and valve. Figure 9 shows a photograph of the elements remaining in the intake port after the experiment. Therefore, it is necessary to control the injection time of the UWS during the opening of the intake valve such that no amount of the UWS remains in the intake system.
5. Conclusion
In this study, an experiment was conducted to determine whether ammonia could be generated from a UWS during compression in a diesel engine. It was confirmed that the UWS could be converted into ammonia by the heat of compression in the cylinder. The results of the experimental ammonia production process were compared with those of a numerical analysis. The conclusions of this study are summarized as follows.
- 1. The maximum compression pressure in the combustion chamber with only compressed air was 40.72 bar. When the UWS was added, the maximum compression pressure was 40.65 bar. In the case of the UWS−air mixture, the maximum compression pressure decreased by 0.17% owing to thermal dissociation.
- 2. The concentration of ammonia in the exhaust gas line was determined to be approximately 103 ppm, which was only 2.4% of the theoretical amount of UWS sprayed into the intake line (4,304 ppm).
In the future, we plan to develop a greenhouse-gas-reduction technology for diesel engines using a UWS through research on the effective injection of the UWS and by increasing the ammonia conversion rate. Future research on methods to improve UWS mixing for facilitated entry into the combustion chamber, approaches to improve the low ammonia conversion rate, and the differences in ammonia conversion rates resulting from coupling with combustion reactions will contribute to decarbonization efforts.
Nomenclatures
| aq : | Aqueous |
| BDC : | Bottom dead center |
| CAD : | Crank angle degree |
| CO : | Carbon monoxide |
| CO(NH2)2 : | Carbonyl diamide, Urea |
| CO2 : | carbon dioxide |
| g : | Gas |
| HNCO : | Isocyanic acid |
| l : | Liquid |
| NH3 : | Nitrogen trihydride, Ammonia |
| TDC : | Top dead center |
| UWS : | Urea water solution |
Acknowledgments
This work was supported by a Research Grant of Pukyong National University(2023).
Author Contributions
Conceptualization, C. Li and S. Jung; Methodology, J. Lim and D. Lee; Validation, K. Kong and S. Jung; Data Curation, C. Li and K. Kong; Writing—Original Draft Preparation, C. Li, J. Lim and D. Lee; Writing—Review & Editing, S. Jung; Project Administration, S. Jung; Funding Acquisition, S. Jung.
References
- Korean Register, Report on Ammonia-Fueled Ships, Busan, Korea, pp. 5-6, 2021.
-
A. V. Medina, H Xiao, M O. Jones, W.I.F. David, and P.J. Bowen, “Ammonia for power,” Progress in Energy and Combustion Science, vol. 69, pp. 63-102, 2018.
[https://doi.org/10.1016/j.pecs.2018.07.001]

-
P. Dimitriou and R. Javaid, “A review of ammonia as a compression ignition engine fuel,” International Journal of Hydrogen Energy, vol. 45, pp. 7098-7118, 2020.
[https://doi.org/10.1016/j.ijhydene.2019.12.209]

-
A. J. Reiter and S. Kong, “Combustion and emissions characteristics of compression-ignition engine using dual ammonia-diesel fuel,” Fuel, vol. 90, pp. 87-97, 2011.
[https://doi.org/10.1016/j.fuel.2010.07.055]

-
H. Nakamura and S. Hasegawa, “Combustion and ignition characteristics of ammonia/air mixtures in a micro flow reactor with a controlled temperature profile,” Proceedings of the Combustion Institute, vol. 36, pp. 4217-4226, 2017.
[https://doi.org/10.1016/j.proci.2016.06.153]

-
A. J. Reiter and S. Kong, “Demonstration of Compression-Ignition Engine Combustion using Ammonia in Reducing Greenhouse Gas Emissions,” Energy & Fuels, vol. 22, pp. 2963-2971, 2008.
[https://doi.org/10.1021/ef800140f]

-
R. Payri, G. Bracho, P. Marti-Aldaravi, and J. Marco-Gimeno, “Computational Study of Urea−Water Solution Sprays for the Analysis of the Injection Process in SCR-like Conditions,” Industrial & Engineering Chemistry Research, vol. 59, pp. 18659-18673, 2020.
[https://doi.org/10.1021/acs.iecr.0c02494]

-
T. An and M. Kim, “Numerical Investigation of the Spray Behavior and Flow Characteristics of Urea-Water Solution Injected into Diesel Exhaust Pipe,” Transactions of the Korean Society of Mechanical Engineers - B, vol. 38, no. 1, pp. 41-48, 2014.
[https://doi.org/10.3795/KSME-B.2014.38.1.041]

-
K. Ku, H. Park, and J. Hong, “Experimental study on characteristics of ammonia conversion rate of urea aqueous solution in 250 ℃ exhaust pipe,” Transactions of the Korean Society of Mechanical Engineers - B, vol. 39, no. 2, pp. 177-181, 2015.
[https://doi.org/10.3795/KSME-B.2015.39.2.177]

-
C. Habchi, S. Quan, S. Drennan, and J. Bohbot, “Towards quantitative prediction of urea thermo hydrolysis and deposits formation in exhaust Selective Catalytic Reduction (SCR) systems,” SAE Technical Paper, 2019-01-0992, pp. 1-9, 2019.
[https://doi.org/10.4271/2019-01-0992]


