
Effects of dynamic injection pressures on spray, combustion, and exhaust emission characteristics in a CRDI diesel engine with naval vessel fuel

Copyright © The Korean Society of Marine Engineering
This is an Open Access article distributed under the terms of the Creative Commons Attribution Non-Commercial License (http://creativecommons.org/licenses/by-nc/3.0), which permits unrestricted non-commercial use, distribution, and reproduction in any medium, provided the original work is properly cited.
Abstract
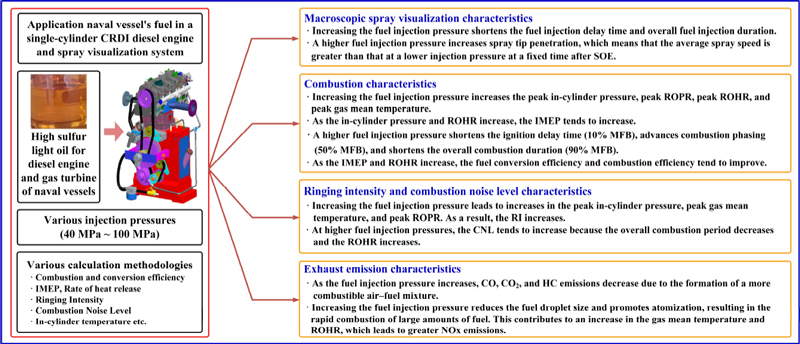
This study focuses on the experimental analysis of the effects of dynamic injection pressures on diesel engine spray, combustion, and emission characteristics. Increasing the fuel injection pressure shortens the fuel injection delay and overall fuel injection duration. A higher fuel injection pressure increases the spray tip penetration. Increasing the fuel injection pressure increased the peak in-cylinder pressure, peak rate of pressure increase, peak rate of heat release, and peak gas mean temperature. As the in-cylinder pressure and rate of heat release increased, the indicated mean effective pressure tended to increase. A higher fuel injection pressure shortens the ignition delay, advances combustion phasing, and shortens the overall combustion duration. As the indicated mean effective pressure and rate of heat release increase, the fuel conversion and combustion efficiency tend to improve. Increasing the fuel injection pressure led to an increase in the ringing intensity. At higher fuel injection pressures, the combustion noise level tends to increase. As the fuel injection pressure increases, CO, CO2, and HC emissions decrease. However, increasing the fuel injection pressure contributed to an increase in the gas mean temperature and rate of heat release, which leads to greater NOx emissions.
Keywords:
Dynamic injection pressure, Spray, Combustion, Emission1. Introduction
Much research has been conducted on fuel injection systems to improve diesel engine performance and reduce emissions. Electronic injectors and common rail systems for diesel engines have dramatically improved fuel injection techniques, contributing significantly to greater fuel efficiency, improving performance, and reducing emissions. Improvements in the fuel injection system of diesel engines have led to various controllable injection factors such as fuel injection timing, injection method (e.g., multistage), and fuel injection pres-sure. In diesel engines, fuel injection pressure variation is a key factor that significantly affects combustion quality, engine performance, fuel efficiency, and emissions as well as engine noise and vibration characteristics. In particular, it has a strong influence on combustion parameters such as ignition delay, in-cylinder pressure, ROPR, and ROHR, including spray characteristics. In general, an increase in the fuel injection pressure shortens the ignition delay, thereby increasing the peak in-cylinder pressure, peak ROPR, and peak ROHR. In addition, a higher injection pressure increases turbulent kinetic energy and decreases the size of fuel droplets, thereby promoting atomi-zation. Therefore, a superior air-fuel mixture forms at a faster rate, shortening the ignition delay is shorter. This phenomenon leads to rapid burning of the injected fuel at the beginning of combustion, that is, during the premixed combustion period, and has a significant impact on engine noise and vibration levels [1]-[4].
The fuel injection pressure also affects exhaust emission levels from diesel engines. As the fuel injection pressure increases from low to high, CO and HC emissions are generally reduced because more combustible mixtures are formed. However, in the case of NOx emissions, which are sensitive to combustion temperature, an increase in the fuel injection pressure has a negative effect on NOx reduc-tion because it increases the ROHR [1][5][6].
The purpose of this study was to experimentally analyze the effect of dynamic fuel injection pressures (40 MPa ~100 MPa, 10 MPa units) on the spray, combustion, and emission characteristics. The spray characteristics-injection delay, spray tip penetration, and spray average speed-were analyzed from recorded spray images. In the combustion investigation, combustion parameters with dynamic injec-tion pressures were calculated by applying the in-cylinder pressure and various theoretical methods. In addition, various emissions, such as HC, CO, CO2, and NOx, were analyzed with fuel injection pressures. A single-cylinder CRDI diesel engine was used for the experi-ment. For spray visualization, the fuel injection pressure was varied in the CVC connected to the test engine, and fuel was supplied from the common rail of the test engine.
2. Experimental System
2.1 Experimental Setup
Figure 1 shows the experimental devices used to analyze the effect of the fuel injection pressure on the spray, combustion, and ex-haust emission characteristics of a diesel engine.

Schematic illustration of the experimental system
A single-cylinder diesel engine with a high-pressure injection system and a common rail system that can precisely control fuel pres-sure was used in this study and was equipped with a solenoid-driven injector. The main specifications of the single-cylinder diesel en-gine used in this study are summarized in Table 1.

Specifications of the test engine
Various devices were constructed for this study. The engine speed was constantly controlled by an electric motor. A spray visualiza-tion system was connected to the test engine, and the tests were performed under the same conditions.
Table 2 lists the main functions of the various components to provide a comprehensive illustration of the experimental setup used in this study.
Function of the main devices for the experimental system
2.2 Experimental Conditions and Test Fuel
In this study, pilot injection was not applied to analyze the effects of fuel pressure injection on the combustion and exhaust emission characteristics.
The fuel injection timing was fixed at BTDC4 CA, and the fuel injection pressure was changed in 10 MPa intervals from 40 MPa to 100 MPa. In the fuel injection pressure variation test, the engine speed was fixed at 1000 rpm.
An experimental investigation was conducted with the fuel injection amount set to 15 mg, and when the injection pressure was changed, the ET was adjusted to maintain a constant fuel injection mass. The in-cylinder pressure was averaged by measuring 500 cy-cles.
The ROPR, ROHR, IMEP, and combustion parameters were calculated using the measured cylinder pressure. To analyze the spray characteristics resulting from changes in the fuel injection pressure under the same conditions, the fuel supply system was directly con-nected to the test engine. The test fuel used in the naval vessels was high-sulfur diesel.
The main physicochemical properties of the test fuel are presented in Table 3. Table 4 indicates the test conditions used to conduct this research.
Physiochemical properties of the naval vessel fuel
Experimental conditions
2.3 Methodologies for Combustion Parameter, RI, and CNL Analysis
In this study, indicators representing combustion parameters and engine performance were calculated by analyzing the measured in-cylinder pressure. In particular, the MFB was predicted using the ROHR by analyzing the measured in-cylinder pressure.
To analyze the vibration state of the engine according to changes in the fuel injection pressure, an RI analysis methodology was ap-plied without using a measuring device. The RI is a metric calculated using the peak in-cylinder pressure, the peak GMT, and the peak ROPR.
Table 5 shows various equations for analyzing the combustion parameters and the RI and CNL characteristics according to the fuel injection pressure. To quantify the RI, the ROPR considering the change in CA was calculated as a function of time.
Combustion parameter and RI analysis methodologies
Additionally, in this paper, the peak ROHR, combustion duration, and statistical analysis were used to quantitatively evaluate the CNL characteristics [9]-[12].
3. Results and Discussions
3.1 Macroscopic Spray Characteristics at Different Injection Pressures
Figure 2 depicts the definition of the STP used to analyze macroscopic spray characteristics at different fuel injection pressures.

Definition of spray tip penetration
The STP related to various injection pressures was defined as the distance from the nozzle tip of the injector to the spray tip boundary. The distance of the STP indicated in Figure 2 was determined by converting the size of one pixel from the acquired image to a scale of 1 mm.
Figure 3 shows the STP (a) and spray average speed (b) simulated with the STP at various fuel injection pressures. The higher the fuel injection pressure was, the faster the SOI and the longer the STP in the same period after the SOE. In particular, at the time when the spray was fully developed (0.9375 ms) at 100 MPa, the spray reach at 100 MPa was approximately 110 mm greater than that at 40 MPa.

Spray tip penetration (a) and spray average speed (b) at various injection pressures
At the same atmospheric pressure, the higher the injection pressure was, the greater the momentum of the fuel droplets sprayed from the injector nozzle. The higher the momentum of the sprayed fuel particles was, the faster their relative speed with respect to the air. In addition, increasing the injection pressure increased the Reynolds number, which resulted in an increase in the fuel flow coefficient.
Therefore, both the spraying velocity of the fuel injected from the nozzle tip and the average spraying speed in the same period in-creased [13]-[16].
Figure 4 shows the ET, injection delay, and injection duration results under the same fuel injection conditions at different fuel injec-tion pressures.

Injection delay and duration at different injection pressures
The ET of the injector had to decrease to ensure that the fuel mass was the same because the initial injection amount increased signifi-cantly as the fuel injection pressure increased. Therefore, as the ET of the injector decreased, the fuel injection duration also decreased.
The injection delay time tended to decrease as the fuel injection pressure increased. The higher the fuel injection pressure was, the lower the compressibility of the fuel; as a result, a higher pressure formed in the injector control chamber, which lifted the needle valve faster, reducing the injection delay time [13][17].
An image showing spray characteristics at various fuel injection pressures displayed in Figure 5.

Spray characteristics at various injection pressures
As shown in Figure 5, spray visualization confirmed that the STP increased as the fuel injection pressure increased, and the injection delay became shorter in the same period.
The spray characteristics confirmed through the macroscopic spray visualization are summarized in Table 6. As the fuel injection pressure increased, the STP became longer in the same period, and the injection delay became shorter.
Analysis of macroscopic spray visualization
To inject the same fuel mass as the fuel injection pressure increased, the ET of the injector had to decrease, and the fuel injection dura-tion shortened accordingly.
3.2 Combustion Parameter Characteristics at Various Injection Pressures
Figure 6 shows the effects of various fuel injection pressures on the in-cylinder pressure, ROHR, and ROPR. As the fuel injection pressure was increased from low pressure to high pressure, the in-cylinder pressure, ROHR, and ROPR increased.

In-cylinder pressure, ROHR, and ROPR characteristics at different injection pressures
Considering the constant fuel injection timing (BTDC4 CA), Figure 6 shows that as the fuel injection pressure increased, the position of the peak in-cylinder pressure, peak ROHR, and peak ROPR shifted toward the TDC.
This means that at higher injection pressures, a large amount of the initial fuel injected was burned during the premixed combustion phase. In addition, a higher injection pressure promotes fuel atomization, allowing evaporated fuel to be evenly distributed inside the combustion chamber. Therefore, it improved the initial premixed combustion and promoted combustion quality.
Figure 7 shows the peak in-cylinder pressure, peak ROPR, and peak ROHR at various fuel injection pressures.

Peak in-cylinder pressure, ROPR, and ROHR characteristics at different injection pressures
The results confirmed that increasing the fuel injection pressure caused an increase in three combustion parameters. This occurred be-cause, as shown in Figure 6, the intensity of the premixed combustion increased as a large amount of fuel was injected at a high injec-tion pressure.
Figure 8 shows the effect of fuel injection pressure on the IMEP. Additionally, the indicated torque was calculated using Equation (4) in Table 5. The IMEP and indicated torque increased as the fuel injection pressure increased. Under the same injection timing condi-tions, a higher injection pressure promoted fuel atomization and resulted in the formation of a better mixture.

IMEP and indicated torque characteristics at various injection pressures
This phenomenon shortened the ignition delay time, improved the premixed combustion, and increased the ROHR. Therefore, the IMEP, an index of combustion performance, became even higher as the fuel injection pressure increased, and the indicated torque, which is proportional to the IMEP, also increased.
Figure 9 represents the MFB characteristics according to the fuel injection pressure.

Mass fraction burned and EGT characteristics at various injection pressures
The 10% MFB, traditionally defined as the ignition delay, tended to become shorter as the fuel injection pressure increased. Increas-ing the fuel injection pressure enhances the turbulent kinetic energy. In addition, the smaller the SMD of the fuel was, the greater the reduction in the fuel particle size. The decreased SMD of the fuel promoted the evaporation of the injected fuel. Consequently, a com-bustible air-fuel mixture was rapidly generated, and the ignition delay time was shortened. The overall fuel atomization condition was improved, and a combustible mixture was quickly formed; thus, the combustion rate increased and the combustion duration became shorter [18]-[20].
The 50% MFB, representing the combustion phase, also tends to decrease as the fuel injection pressure increases, implying that pre-mixed combustion occurred rapidly owing to the short ignition delay of the large amount of fuel injected. Moreover, as the fuel injection pressure increased, the reduction in the ET of the injector contributed to a decrease in the fuel injection duration. A high ROHR at the beginning of the combustion phase leads to a reduction in the overall combustion duration and exhaust gas temperature.
Figure 10 shows the fuel conversion and combustion efficiencies calculated according to the fuel injection pressure using Equation (5) and (6) in Table 5.

Fuel conversion efficiency and combustion efficiency characteristics at various injection pressures
As the fuel injection pressure increased, the fuel conversion efficiency improved because the indicated work, which is proportional to the IMEP, increased. The ROHR during the premixed combustion period was close to that of TDC, providing additional work for the piston during the expansion stroke. Under higher injection pressure conditions, fuel atomization occurred faster, resulting in accelerated air-fuel mixing inside the combustion chamber and the rapid formation of a homogeneous mixture.
Accordingly, the ignition delay time decreased, the intensity of premixed combustion increased, and the ROHR rapidly increased. The combustion efficiency also improved with increasing ROHR and combustion quality under high injection pressure conditions.
Figure 11 shows the RI and CNL characteristics under various fuel injection pressure conditions. The RI, used to quantitatively eval-uate the intensity of knocking caused by combustion, is closely related to engine vibration and noise. The RI of 5 MW/m2 is assumed in this study [21].

RI and CNL characteristics at various injection pressures
According to Equation (7) in Table 5, the RI is proportional to the peak GMT and time-based peak ROPR and inversely proportion-al to the peak in-cylinder pressure. An increase in the fuel injection pressure caused the RI to increase.
As mentioned earlier, due to greater premixed combustion intensity and excellent combustion quality, the peak in-cylinder pressure, peak ROPR, and peak mean gas temperature increase as the fuel injection pressure increases from low to high injection pressure. To evaluate the CNL based on the fuel injection pressure, the overall combustion duration and peak ROHR from Equation (8) were ap-plied in this study [8][11].
As the fuel injection pressure increased, a homogeneous mixture rapidly formed, shortening the ignition delay, and the large amount of fuel injected during the short fuel injection duration increased the intensity of the premixed combustion.
Therefore, the overall combustion period became shorter, and the peak ROHR increased; thus, the CNL also tended to increase. The combustion parameters at various fuel injection pressures are listed in Table 7. All combustion parameters, except MFB, such as igni-tion delay, combustion phasing, and combustion duration, increased as the fuel injection pressure increased from low to high injection pressure.
Combustion parameters
3.3 Exhaust Emission Characteristics under Various Injection Pressures
Figure 12 shows the O2, CO2, and lambda(λ) characteristics at various fuel injection pressures.

O2, CO2, and lambda (λ) characteristics with various injection pressures
As the fuel injection pressure increased, the O2 concentration in the exhaust gas decreased, whereas the CO2 concentration increased. Increasing the fuel injection pressure promoted fuel atomization; moreover, considering a combustible mixture was quickly formed, the intensity of oxidation during the combustion process increased significantly.
Therefore, the O2 concentration in the exhaust gas was reduced owing to rapid oxidation reactions. Active oxidation improves the MFB of the injected fuel; therefore, the CO2 emissions increase as the fuel injection pressure increases. Additionally, oxidation becomes more complete as the fuel injection pressure increases; thus, so lambda matches the stoichiometric values.
The main causes of HC formation during the combustion process of a diesel engine are the trapping of injected fuel in the crevices of the combustion chamber, incomplete oxidation of fuel at low temperatures, non-vaporized fuel films on walls, and local combustion of lean and rich mixtures in the combustion chamber. CO primarily forms by the combustion of extremely lean or rich mixtures.
When an overly lean mixture burns, flame propagation does not occur throughout the mixture, and thermal decomposition of the fuel occurs owing to partial oxidation, resulting in the emission of CO and HC.
In the case of an overly rich mixture, sufficient time is not available for thorough fuel oxidation because sufficient air mixing is not achieved. These phenomena are the main causes of CO and HC emissions [22]-[24].
Figure 13 shows the emission characteristics of CO and HC at different fuel injection pressures.

CO and HC emission characteristics at various injection pressures
The CO and HC emission levels clearly decreased as the fuel injection pressure increased. An increase in the fuel injection pressure created a superior air–fuel mixture in the combustion chamber, resulting in a very high degree of oxidation.
The higher the fuel injection pressure, the smaller the fuel droplets, resulting in the formation of a combustible mixture and better flame propagation, thus improving the combustion quality. Therefore, increasing the fuel injection pressure resulted in reduced CO and HC emissions.
The main source of NOx emissions from internal combustion engines is the nitrogen in the air, which oxidizes at high temperatures during combustion; this NOx is called thermal NOx. The generation of NOx depends on the oxygen concentration, GMT during the combustion period, and the excess air coefficient [1][25].
Figure 14 shows the NOx emission characteristics at different fuel injection pressures. The NOx emission level gradually increased as the fuel injection pressure increased toward the high-pressure region. The fuel droplet size decreases at high fuel injection pressures; therefore, the fuel spray evaporates rapidly. Therefore, it is difficult for the fuel spray to penetrate deep into the combustion chamber.

NOx and peak GMT characteristics at various injection pressures
As a result, the initial combustion rate becomes extremely high, resulting in an increase in the GMT during the combustion process. This phenomenon increases NOx emissions because NOx formation is sensitive to the GMT during combustion. The effect of the fuel injection pressure on the exhaust emission characteristics, including lambda, is summarized in Table 8. O2, CO, NOx, and lambda de-creased, whereas CO2 and NOx increased as the fuel injection pressure increased.
Exhaust emissions and Lambda (λ)
4. Conclusions
An experimental analysis was conducted by applying high-sulfur diesel used in naval vessels to a single-cylinder CRDI diesel engine to determine the spray, combustion, and exhaust emission characteristics of a diesel engine at various fuel injection pressures. The main conclusions drawn from the experimental investigation are summarized as follows:
- 1) A higher fuel injection pressure resulted in an increase the STP and average spray speed during the same period. Additionally, both the injection delay and injection duration were reduced.
- 2) A higher injection pressure resulted in an increase in the peak in-cylinder pressure, peak ROPR, peak ROHR, and peak GMT. In addition, the IMEP and the indicated torque tended to increase because of the high ROHR as the injection pressure increased in the high-pressure region. Therefore, the fuel conversion and combustion efficiency also improved. Increasing the fuel injection pres-sure resulted in the rapid formation of a superior combustible mixture, shorter ignition delay time, rapid advance of combustion phasing to the TDC, a decrease in the overall combustion period and an increase in the exhaust gas temperature. Increasing the fuel injection pressure increased the RI and CNL.
- 3) A superior combustible mixture was formed as the fuel injection pressure increased, resulting in a reduction in CO and HC, and an increase in CO2. Increasing the injection pressure decreased the droplet size of the injected fuel, and the fuel evaporated more quickly, increasing the initial combustion intensity. Consequently, NOx emissions gradually increased because of the higher ROHR and GMT during the combustion process.
Nomenclatures
| ABDC : | After before dead center |
| ATDC : | After top dead center |
| BBDC : | Before top dead center |
| BTDC : | Before top dead center |
| CA : | Crank angle |
| CD : | Combustion duration (10%MFB~90%MFB) |
| CNL : | Combustion noise level |
| CO : | Carbon monoxide |
| CO2 : | Carbon dioxide |
| CRDI : | Common rail direct injection |
| CVC : | Constant volume chamber |
| EGT : | Exhaust gas temperature |
| ET : | Energizing time of injector |
| GMT : | Gas mean temperature |
| HC : | Hydrocarbon |
| IMEP : | Indicated mean effective pressure |
| MFB : | Mass fraction burned |
| MPa : | Mega pascal |
| NOx : | Nitrogen oxides |
| O2 : | Oxygen |
| RI : | Ringing intensity |
| ROHR : | Rate of heat release |
| ROPR : | Rate of pressure rise |
| ROPRpeak : | Peak rate of pressure rise |
| rpm : | revolutions per minute |
| SOE : | Start of energizing |
| SOI : | Start of injection |
| STP : | Spray tip penetration |
| TDC : | Top dead center |
| mf : | Fuel injection mass |
| mintake : | Intake air mass at intake valve closing |
| Pamb : | Ambient pressure |
| Pinj : | Injection pressure |
| Ppeak : | Peak in-cylinder pressure |
| QLEV : | Lower heating value |
| SMD : | Sauter mean diameter |
| Tind : | Indicated torque |
| Tpeak : | Peak gas mean temperature |
| Vd : | Displacement |
| Vivc : | Cylinder volume at intake valve closing |
| Wind : | Indicated work |
| : | Peak rate of pressure rise relating with time |
| β : | Constant value |
| λ : | Lambda |
| γ : | Specific heat ratio |
| ρair : | Air density |
| vl : | Function of valve lift |
| ϴvod,intake : | Intake valve opening duration |
| ϴvod,exhaust : | Exhaust valve opening duration |
| ϴIVO : | Intake valve opening angle |
| ϴEVO : | Exhaust valve opening angle |
| ηfc : | Fuel conversion efficiency |
| ηcomb : | Fuel combustion efficiency |
Acknowledgments
This study was supported by the 2024 Academic Research Project of the Naval Institute for Ocean Research of the Republic of Korea Naval Academy.
Author Contributions
Conceptualization, H. Lee; Methodology, H. Lee; Formal Analysis, H. -M. Baek; Writing-Original Draft Preparation, H. -M. Baek and H. Lee; Writing-Review & Editing, H. -M. Baek and H. Lee.
References
-
S. Imtenam, S. M. Ashrafur Rahman, H. H. Masjuki, M. Varman, and M. A. Kalam, “Effect of dynamic injection pressure on performance, emission and combustion characteristics of a compression ignition engine,” Renewable and Sustainable Energy Reviews, vol. 52, pp. 1205-1211, 2015.
[https://doi.org/10.1016/j.rser.2015.07.166]

-
A. K. Agarwal, A. Dhar, J. G. Gupta, W. I. Kim, C. S. Lee, and S. Park, “Effect of fuel injection pressure and injection timing on spray characteristics and particulate size-number distribution in a biodiesel fuelled common rail direct injection diesel engine,” Applied Energy, vol. 130, pp. 212-221, 2014.
[https://doi.org/10.1016/j.apenergy.2014.05.041]
-
O. E. Alaatin, “Effect of fuel injection pressure on the characteristics of single cylinder diesel engine powered by butanol-diesel blend,” Fuel, vol. 256, 115928, 2019.
[https://doi.org/10.1016/j.fuel.2019.115928]
-
H. -M. Back, G. -S. Jung, Q. D. Voung, J. -U. Lee, and J.-W. Lee, “Effect of performance by excessive advanced fuel injection timing on marine diesel engine,” Applied Sciences, vol. 13, no. 16, p. 9263, 2023.
[https://doi.org/10.3390/app13169263]
-
Z. Shi, H. Wu, H. Li, L. Zhang, X. Li, and C. F. Lee, “Effect of injection pressure and fuel mass on wall-impinging ignition and combustion characteristics of heavy-duty diesel engine at low temperature,” vol. 229, 120904, 2021.
[https://doi.org/10.1016/j.fuel.2021.120904]
- W. -K. Cho, S. -W. Kang, C. -S. Bae, and Y. -H. Kim, “Effect of ultra-high injection pressure on combustion and emission characteristics in a single-cylinder diesel engine,” Proceedings of the 51th KOSCO Fall Conference, pp. 41-44, 2015 (in Korean).
-
N. Septivani and B. W. Riyandwita, “Spark ignition engine modeling for in-cylinder pressure and temperature prediction using Simulink,” MATEC Web of Conference, vol. 204, no. 04001, 2018.
[https://doi.org/10.1051/matecconf/201820404001]
-
R. K. Maurya, Reciprocating Engine Combustion Diagnostics-In-Cylinder Pressure Measurement and Analysis, Cham, Switzerland: Springer, 2019.
[https://doi.org/10.1007/978-3-030-11954-6]
-
J. A. Eng, “Characterization of pressure waves in HCCI combustion,” SAE Technical paper, 2002-01-2859, 2002.
[https://doi.org/10.4271/2002-01-2859]
-
R. K. Maurya and M. R. Saxena, “Characterization of ringing intensity in a hydrogen-fueled HCCI engine” International Journal of Hydrogen Energy, vol. 43, no. 19, pp. 9423-9437, 2018.
[https://doi.org/10.1016/j.ijhydene.2018.03.194]
-
G. Shibata, Y. Shibike, H. Ushijima, and H. Ogawa, “Identification of factors influencing premixed diesel engine noise and mechanism of noise reduction by EGR and supercharging,” SAE Technical paper, 2013-01-0313, 2013.
[https://doi.org/10.4271/2013-01-0313]
-
H. -M, Baek and H. -M, Lee, “Experimental investigation of ringing intensity and combustion noise level from biodiesel fuel in CRDI diesel engine with various injection timings,” Journal of Advanced Engineering and Technology, vol. 46, no. 2, pp. 56-63, 2022.
[https://doi.org/10.5916/jamet.2022.46.2.56]
-
V. T. Cho, T. D. Long, H. B. Vang, N. M. Hoang, N. H. Phuc, and N. Q. Sy, “A study on the injection rate characteristics of the solenoid common-rail injector under using a high-pressure fuel system,” Journal Teknologi, vol. 85, no. 3, pp. 25-33, 2023.
[https://doi.org/10.11113/jurnalteknologi.v85.19106]
-
S. -A. Kim, W. -G. Wang, and J. -K. Yang, “A study on the spray characteristics of CRDI system with injection pressure,” Journal of the Korean Society Fisheries and Ocean Technology, vol. 52, no. 1, pp. 65-71, 2016 (in Korean).
[https://doi.org/10.3796/KSFT.2016.52.1.065]
-
C. Yao, P. Geng, Z. Yin, J. Hu, D. Chen, and Y. Ju, “Impacts of nozzle geometry on spray combustion of high pressure common rail injectors in a constant volume combustion chamber,” Fuel, vol. 179, pp. 235-245, 2016.
[https://doi.org/10.1016/j.fuel.2016.03.097]
-
Y. Wakuri, M. Fuji, R. Amitani, and R. Tsuneya, “Studies on the penetration of fuel spray in a diesel engine,” Bulletin of the Japan Society of Mechanical Engineers, vol 3, no 9, pp. 123-130, 1960.
[https://doi.org/10.1299/jsme1958.3.123]
-
D. Han, Y. Duan, C. Wang, H. Lia, and Z. Huang, “Experimental study on injection characteristics of fatty acid esters on a diesel engine common rail system,” Fuel, vol. 123, pp. 19-25, 2014.
[https://doi.org/10.1016/j.fuel.2014.01.048]
-
H. -K. Suh, S. -W. Park, and C. -S. Lee, “A study of the flow and atomization characteristics of impinged diesel spray on a chamber wall,” Atomization Sprays, vol. 17, no. 7, pp. 569-599, 2007.
[https://doi.org/10.1615/AtomizSpr.v17.i7.10]
-
K. Nishida, J. Zhu, and Z. He, “Effects of micro-hole nozzle and ultra-high injection pressure on air entrainment, liquid penetration, flame lift-off and soot formation of diesel spray flame,” International Journal of Engine Research, vol. 18, no. 1-2, pp. 51-65, 2017.
[https://doi.org/10.1177/1468087416688805]
-
G. Bruneaux, “Mixing process in high pressure diesel jets by normalized Laser Induced Exciplex Fluorescence Part II: wall impinging versus free jet,” SAE paper 2005-01-2097, 2005.
[https://doi.org/10.4271/2005-01-2097]
-
J. Dernotte, J. E. Dec, and C. -S. Ji, “Investigation of the sources of combustion noise in HCCI engines,” SAE International Journal of Engines, vol. 7, no. 2, pp. 730-761, 2014.
[https://doi.org/10.4271/2014-01-1272]
-
M. Canakci, C. Sayin, A. N. Ozsezen, and A. Turkcan, “Effect of injection pressure on the combustion, performance, and emission characteristics of a diesel engine fueled with methanol-blended diesel fuel,” Energy & Fuels, vol. 23, no. 6, pp. 2908-2920, 2009.
[https://doi.org/10.1021/ef900060s]
-
C. Sayin, M. Gumus, and M. Canakci, “Effect of fuel injection pressure on the injection, combustion and performance characteristics of a DI diesel engine fueled with canola oil methyl esters-diesel fuel blends,” Biomass and Bioenergy, vol. 46, pp. 435-446, 2012.
[https://doi.org/10.1016/j.biombioe.2012.07.016]
-
A. K. Agarwal, D. K. Srivastava, A. Dhar, R. K. Maurya, P. C. Shukla, and A. P. Singh, “Effect of fuel injection timing and pressure on combustion, emission and performance characteristics of a single cylinder diesel engine,” Fuel, vol. 111, pp. 374-383, 2013.
[https://doi.org/10.1016/j.fuel.2013.03.016]
-
M. Gumus, C. Sayin, and M. Canakci, “The impact of fuel injection pressure on the exhaust emissions of direct injection diesel engine fueled with biodiesel-diesel fuel blends,” Fuel, vol. 95, pp. 486-494, 2012.
[https://doi.org/10.1016/j.fuel.2011.11.020]