Object detection for various types of vessels using the YOLO algorithm
Copyright © The Korean Society of Marine Engineering
This is an Open Access article distributed under the terms of the Creative Commons Attribution Non-Commercial License (http://creativecommons.org/licenses/by-nc/3.0), which permits unrestricted non-commercial use, distribution, and reproduction in any medium, provided the original work is properly cited.
Abstract
Owing to the development of computer vision technology, much effort is being conducted to apply it in the maritime field. In this study, we developed a model that can detect various types of ships using object detection. Nine types of ship images were downloaded, and bounding box processing of the ships in the images was performed. Among the You Only Look Once (YOLO) model versions for object detection, YOLO v3 and YOLO v5s were used to train the training set, and predictions were made on the validation and testing sets. For the validation and testing sets, both models made good predictions. However, as some mispredictions occurred in the testing set, recommendations for these are given in the last section.
Keywords:
Object detection, Ship type, YOLO v3, YOLO v5s1. Introduction
The fourth industrial revolution has arrived primarily owing to rapid advances in computer performance and artificial intelligence (AI) technology. As a result, efforts to introduce AI technology in existing industries have surged. The most brilliant technology in the large category of AI is deep learning. Deep learning is largely divided into natural language processing and computer vision.
Computer vision initially had lower performance than humans, but since the introduction of deep learning, it has surpassed human performance. Accordingly, computer vision is being applied to various industrial fields.
Computer vision technologies based on convolutional neural networks (CNNs) include optical character recognition, image recognition, pattern recognition, face recognition, object detection and classification, image segmentation, and edge detection. Among these technologies, object detection will be important for ship navigation and port safety. In place of humans, cameras in unmanned ships must recognize other ships; here, object detection can be used. For the safety of unmanned and automated ports, problems with unauthorized vessel access to the port are identified early using object detection technology. The following are studies in which object detection technology was used in the maritime field.
Dong et al. (2021) detected ships in remote sensing images using a brainlike visual attention mechanism and confirmed that the average intersection rate of the joint is 80.12% [1]. Wang et al. (2019) used RetinaNet to detect multi-scale ships from synthetic aperture radar (SAR) imagery with high accuracy [2]. Yang et al. (2021) performed ship detection from a public SAR ship-detection dataset using RetinaNet and rotatable bounding box [3]. Li et al. (2017) detected ships from SAR images using a method based on faster region-based CNN [4]. Chang et al. (2019) performed ship detection from SAR imagery using You Only Look Once version 2 (YOLO v2) [5]. Hong et al. (2021) detected ships from SAR and optical imagery using a method based on YOLO v3 [6].
The majority of previous studies conducted on object detection for ships involved remote sensing based on satellite images. In addition, research has been conducted on object detection to the extent that ships can recognize other ships, as follows.
Shao et al. (2022) detected ships in harsh maritime environments using a CNN [7]. Lee et al. (2018) performed ship classification with ten classes from the Singapore Maritime Dataset (SMD) using YOLO v2 [8]. Furthermore, object detection was performed under low visibility environments (rain, fog, night). However, vessel type was not classified. Shao et al. (2020) researched detecting ships by generating bounding boxes using YOLO v2 [9]. Li et al. (2021) performed the classification and positioning of six types of ships using a method based on the YOLO v3 tiny network [10]. However, Shao et al. (2020) and Li et al. (2021) conducted their studies with ships operating along the coast or rivers rather than large-scale merchant ships sailing in the ocean. Kim et al. (2022) performed detection and classification using the SMD with modified annotations using YOLO v5, which adopted the mix-up technique [11].
According to Kim et al. (2022), the SMD, frequently used in previous studies, contains noisy labels and imprecisely located bounding boxes. Therefore, we used images of several types of ships searched through Google Images. According to previous research, the YOLO algorithm has been widely used to detect and classify ships. However, previous studies focused on detecting ships at sea, and no studies were conducted on both detecting and classifying them. Therefore, we performed vessel detection and classification using YOLO v3 and YOLO v5. This ship-type detection technology may be applied to autonomous ships in the future. Furthermore, we used images of pirate ships as a dataset to enable the YOLO model to detect them and ensure safe navigation of ships.
The remainder of the paper is organized as follows: Section 2 discusses the data collection process for training the YOLO model. Section 3 explains the concept of the YOLO algorithm and the differences between YOLO v3 and YOLO v5s. Section 4 explains the modeling process of YOLO models. Section 5 discusses the prediction results for validation and testing sets of YOLO models. Finally, Section 6 summarizes the results of this study.
2. Data Acquisition
2.1 Selection of Ship Types
In this study, the types of ships that large-scale merchant ships sailing in the ocean can encounter were determined as follows: (i) boat, (ii) bulk carrier, (iii) container ship, (iv) cruise ship, (v) liquified natural gas (LNG) carrier, (vi) navy vessel, (vii) supply vessel, (viii) oil tanker, and (ix) car carrier.
2.2 Acquisition of Data
Images were downloaded through Google image searches for each ship type. The downloaded image files were in the formats of JPG, JPEG, PNG, WebP, and AVIF, and all image formats were converted to JPG to train the YOLO model.
Images of a tugboat, wood boat, leisure boat, and fishing boat were downloaded for the boat category. For the bulk carrier category, images of ships with and without cranes were downloaded evenly. For the container ship category, images of ships with deck houses located at the front and back of the ship were downloaded. For the LNG carrier category, both membrane and Moss LNG tanks were downloaded. For the navy vessel category, images of destroyers were downloaded. No significant differences were observed in the images of the cruise ship, supply vessel, oil tanker, and car carrier categories.
Each image had various characteristics, including (i) a single vessel in the image, (ii) several vessels in the image, (iii) ships and port facilities simultaneously in the image, and (iv) ships with surrounding scenery.
In addition, the following aspects could cause limitations in computer vision training: (i) The colors of the sea and sky in the image were all different, (ii) the ships in the images were all different sizes, (iii) ships of the same type had different colors and shapes, (iv) the quality and pixels of the images were all different, (v) the directions of the ships in the images were all different, (vi) the number and shape of the white waves that appeared around the ship in the image were all different, and (vii) multiple ships might exist within the bounding box due to the attachment of ships each other.
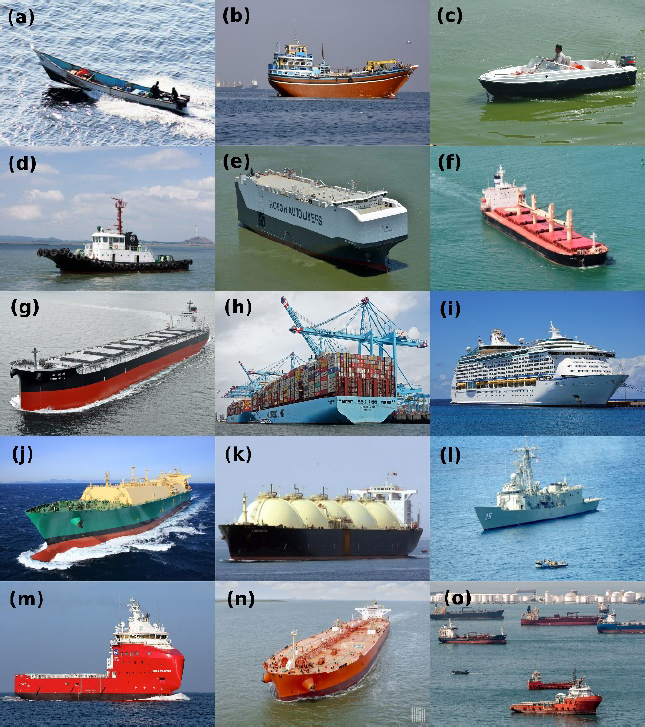
As Table 1 shows, 116 images for training, 17 images for validation, and 22 images for testing were prepared. Samples of images for each category are shown in Figure 1.
Figure 1(a), (b), (c), and (d) represent a pirate boat, fishing boat, leisure boat, and tugboat among the boat categories, respectively. Figure 1(e) is a car carrier, and (f) and (g) are bulk carriers with and without a crane, respectively. Figure 1(h) is a container ship, (i) is a cruise ship, (j) is a membrane type LNG carrier, (k) is a Moss type LNG carrier, (l) is a navy vessel, (m) is a supply vessel, and (n) is an oil tanker. Figure 1(o) represents various types of ships in the anchorage of the Singapore Strait. Figure 1(h) shows an image of a container ship and a port facility and was used for the YOLO model to better detect the container ship from the port facility during training.
2.3 Bounding Box of Images
A label for the object to be detected in an image was required to train the YOLO model. Hence, labeling for object detection was performed using a website called “Make Sense” [12]. Images of the training and validation sets were uploaded to Make Sense, and nine labels representing categories were determined. A rectangular bounding box was designated only in the part representing the ship in each image, and then the label of the ship was selected. After the bounding box was labeled, text files were extracted in YOLO format. The name of the text files was automatically set to be the same as the names of the image files. Five values were used in the labeling text files. The first value was an integer with numbers starting from 0 for each category, and the remaining four were values that indicate the center point (x, y) of the bounding box and the width and height of the bounding box. The remaining four values were between 0 and 1.
2.4 Creating a YAML file
YAML is a human-readable data serialization language. It is commonly used for configuration files and in applications where data is being stored or transmitted [13].
The YOLO model learned by referring to the YAML file, and the YAML file contained the following information: (i) In “train” and “val,” the paths of the training and validation images were written, respectively. (ii) “nc” is an abbreviation for the number of classes, and 9 was entered as nine categories were used in this study. (iii) “name” contains the names of nine categories.
3. YOLO Algorithm
3.1 Basic Description of the YOLO Algorithm
The YOLO algorithm enables a deep learning model to check the image only once and detect an object, saving time compared with previous deep learning models that check an image multiple times. Therefore, the YOLO algorithm enables real-time object detection.
The YOLO model uses a regression technique that predicts the location of an object in an image through a bounding box and classifies the class of object.
YOLO resizes the input image and passes it through a single CNN to predict multiple bounding boxes and class probabilities based on the threshold [14].
The input image is divided into S × S grid areas. Each grid cell predicts B bounding boxes and confidence scores for those boxes. The confidence score is obtained by multiplying the probability that an object exists within the grid cell by the intersection over union (IOU). Each bounding box is a rectangle of various shapes centered on a random point within the grid cell. Each bounding box has information about the center point (x, y) of the bounding box, width, height, and confidence. The more confident an object is likely to be inside the bounding box, the bolder the box is drawn. Each grid cell predicts C conditional class probabilities, and class-specific confidence scores are obtained by multiplying the conditional class probabilities by the individual box confidence predictions. Based on the threshold, thin bounding boxes are removed and only thick bounding boxes remain. Among the remaining candidate bounding boxes, the final boxes are selected using the non-max suppression (NMS) algorithm.
The CNN architecture of YOLO is composed of 24 convolutional layers followed by two fully connected layers.
3.2 Difference between YOLO v3 and YOLO v5
The YOLO v3 and YOLO v5 have been used in many object detection studies, and the differences between them are as follows [15]–[17].
YOLO v3 was developed by the creator of YOLO as an improved version of the existing YOLO [18]. It uses Darknet-53 as its backbone. An image passes through Darknet-53, which consists of convolution layers, and features are extracted. Subsequently, it passes through a feature pyramid network (FPN) for feature fusion; finally, the vector of bounding box coordinates, width, height, a class label, and its probability are predicted by the YOLO layer.
YOLO v5 was developed by Ultralytics LLC [19]. It uses CSPDarknet-53 as its backbone. An image passes through CSPDark-net53, which integrates gradient change into the feature map, and features are extracted. Subsequently, feature fusion occurs through the path aggregation network (PANet), and finally, the YOLO layer generates the results. YOLO v3 uses cross-entropy as a loss function, but YOLO v5 uses binary cross-entropy with logits loss function [17].
4. Modeling
The modeling process was conducted in Google Colab. Folders for training, validation, and testing were created in Google Drive, and the images were added. Labeling text files were added to the training and validation folders.
The YAML file was also mounted on Google Drive, and the training and validation image folder paths in Google Drive were written in YAML file.
YOLO v3 and YOLO v5 data from Ultralytics' Git repository were imported into Google Colab. The image size was set to 416 × 416, the batch size was set to 16, and the epochs were set to 200. Default values were used for optimizer and hyperparameters.
The model of YOLO v3 has v3, spp, and tiny versions depending on the number of parameters; YOLO v3 with 61.9M parameters was used. The model of YOLO v5 has n, s, m, l, and x versions depending on the number of parameters. YOLO v5s with 7.2M parameters was used. The YOLO v3 model consisted of 262 layers with 61,566,814 parameters, and the YOLO v5s model consisted of 214 layers with 7,043,902 parameters. Accordingly, the training time for YOLO v3 was 0.523 h, which was approximately five times the training time for YOLO v5s, which was 0.11 h.
5. Results and Discussion
5.1 Comparison of Prediction Results for the Validation Set between YOLO v3 and YOLO v5s
Using the best weights saved during the training period of the YOLO model, we performed object detection on the validation set with an image size of 416 × 416 and a confidence threshold of 0.1.
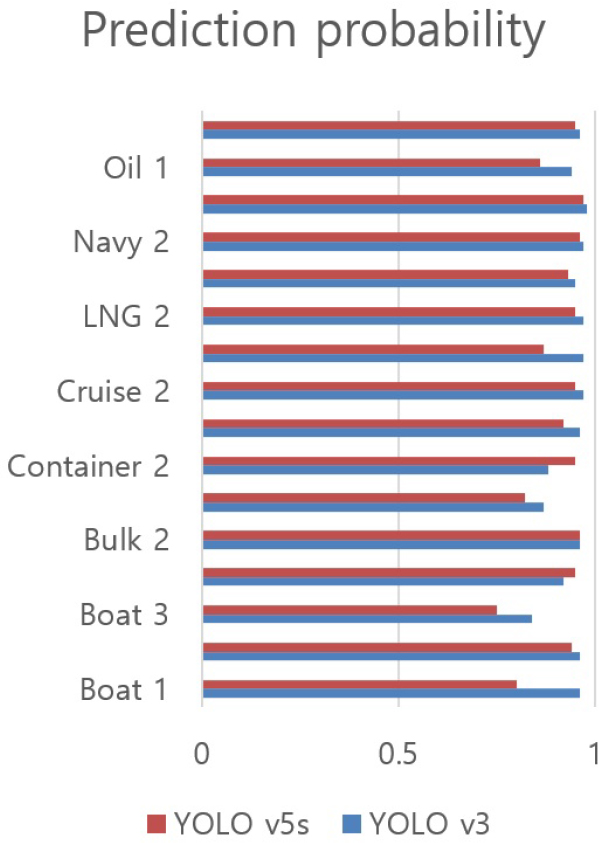
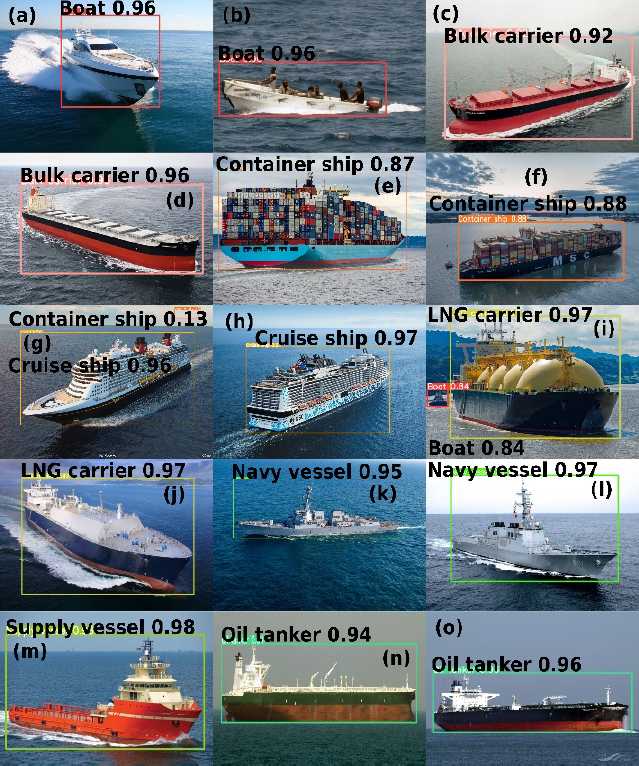
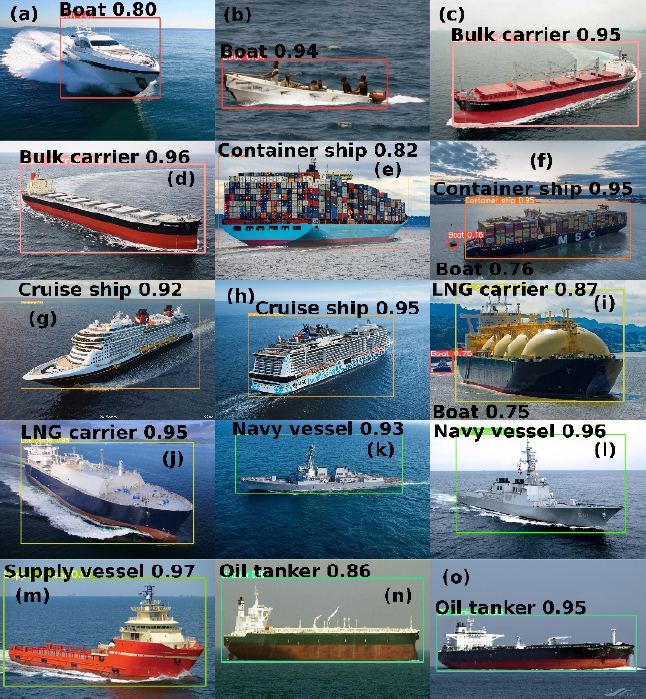
Figure 3 and Figure 4 show the object detection results performed by the trained YOLO v3 and YOLO v5s models on the validation set, respectively. The font size of the label of the bounding box and the probability was small and difficult to read in figures. Therefore, prediction results were summarized as shown in Table 2 and Figure 2.
According to Table 2, the probability value of YOLO v3 was generally higher than that of YOLO v5s. However, YOLO v3 missed the detection of the small boat in Figure (f) and incorrectly predicted the cloud in the sky as a container ship in Figure (g). For all images, YOLO v5s correctly classified the bounding box and classification of the ship's position.
5.2 Comparison of Prediction Results for the Testing Set between YOLO v3 and YOLO v5s
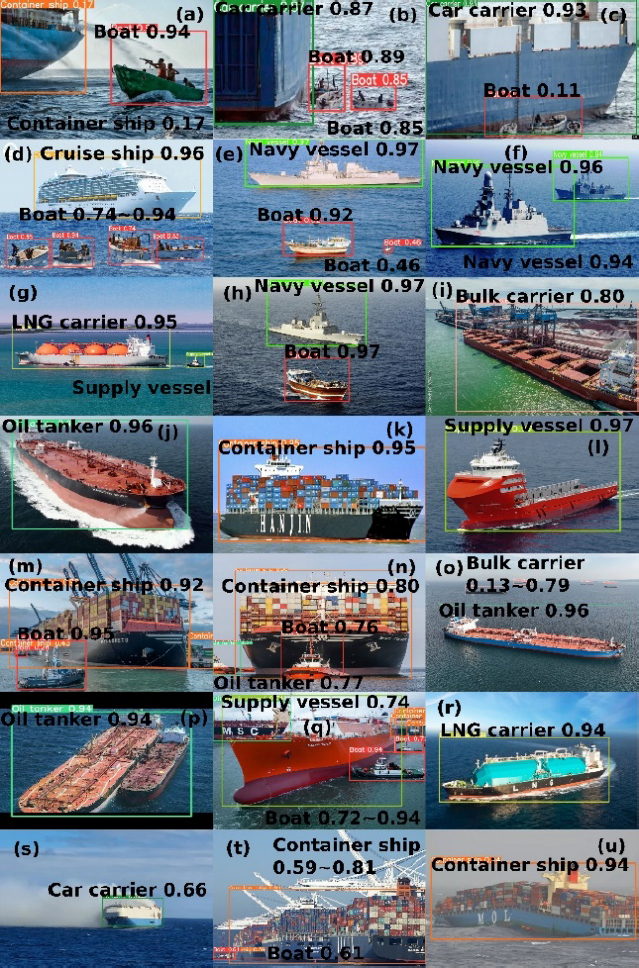
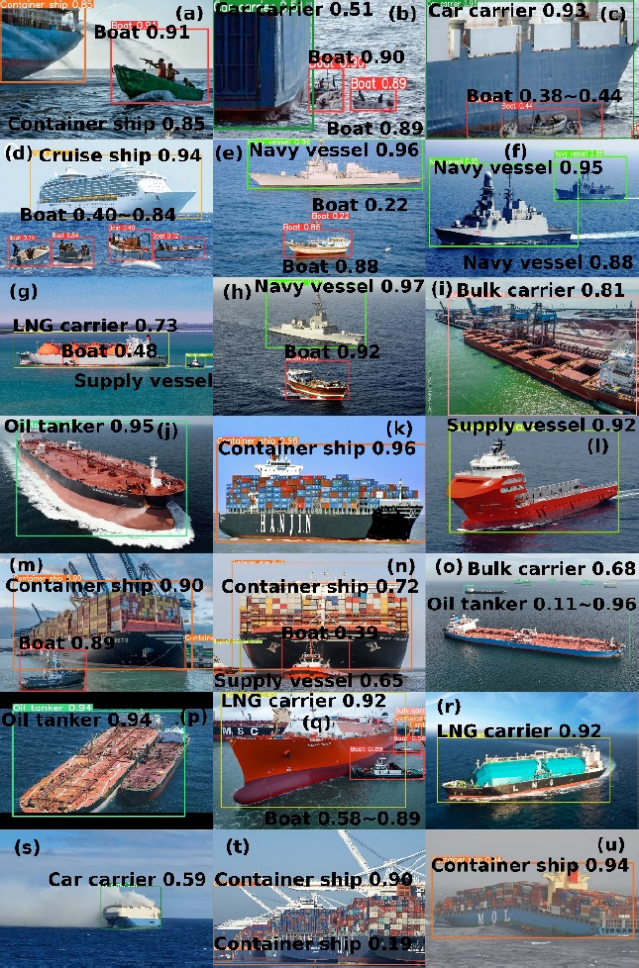
Figure 5 and Figure 6 show the prediction results of YOLO models on the testing set. These figures show that some of the images in the testing set were not only of single ships but also of various types of ships and port facilities.
Figures (a)–(e) show pirate ships that approached the main ship. Figures (i, m, and t) represent ships docked at port facilities. Figures (n and p) show images of ships attached, and Figure (o) shows several ships in the anchorage area. Figure (q) represents the ships in the shipyard, Figure (s) represents the ship on fire, and Figure (u) represents the ship with the hull broken in two.
Referring to Figures (a and b), the trained YOLO models clearly distinguished between merchant ships and pirate ships. However, the YOLO v3 model predicted container ships with a probability of 0.17%. Even with the human eye, confirming whether this ship is a container ship is difficult, but as the training set contained many container ships with light blue hulls, we assumed that YOLO v5s predicted this as a container ship with a probability of 0.85%. The car carrier in Figure (b) was presumed to have been accurately detected because many images showed the rear of the ship in the training set.
Referring to Figure (c), both models distinguished between car carriers and pirate ships but could not individually distinguish the three pirate ships. YOLO v5s had some errors in detecting pirate ships. As the car carrier occupied a large portion of the entire image, the bounding box appeared to fill the image.
Figure (d) clearly distinguished between the cruise ship, three pirate ships, and one navy boat but did not detect the small ship attached to the cruise ship.
Figure (e) appears to have one navy vessel and three boats. YOLO v3 and YOLO v5s accurately predicted the large boat. However, they detected different boats for the two small boats.
In Figure (f), both models accurately predicted two navy vessels.
Referring to Figure (g), both models accurately predicted one LNG carrier, but for the two tugboats, one was predicted as a supply vessel, and only YOLO v5s accurately predicted another tugboat attached to an LNG carrier.
For Figures (h-l), both models made accurate predictions.
For Figure (m), both models accurately predicted the container ship but were unable to distinguish between the two container ships. The YOLO v3 model clearly predicted two tugboats but mispredicted the port facility on the left in the image as a container ship. The YOLO v5s model predicted only one of the two tugboats as a tugboat. Both models mispredicted the container boxes on the right in the image as a container ship, indicating that the YOLO model extracted the container box as a feature when training container ship images.
For Figure (n), both models accurately predicted the container ship and one out of three tugboats. For the tugboat on the left, the YOLO v3 model mispredicted it as an oil tanker, and the YOLO v5s model incorrectly predicted it as a supply vessel.
For Figure (o), both models accurately predicted the front oil tanker. However, YOLO v3 mispredicted the second largest oil tanker. Ships in the distance were observed to be bulk carriers when the image was enlarged, and the YOLO v3 model accurately predicted this.
For Figure (p), both models had correct predictions. However, they were unable to distinguish the two oil tankers.
Figure (q) shows that the YOLO model had difficulty in predicting accurately because various types and sizes of ships were located at different angles. Only the YOLO v5s model accurately predicted the LNG carrier, and the YOLO v3 model predicted it as a supply vessel. This was considered to be because most of the supply vessels in the training set were orange. YOLO v5s could not detect the container ship behind, and YOLO v3 incorrectly predicted it to be an oil tanker. This is considered to be because all container ship images in the training set had containers piled up. Both models made incorrect predictions about the ships in the upper right corner of the image. This was even difficult for humans to judge with the naked eye; therefore, for such images in the training set for real-time detection, a recommendation is to simply set the category of these ships to simply “ship.”
Figure (r) shows a membrane LNG carrier, and the upper part of the membrane tank protrudes significantly. Although the membrane tank did not protrude thus in the training set, the trained YOLO models captured the characteristics of the membrane LNG carrier well.
Figure (s) shows a car carrier that caught fire, and there were no such images in the training set. The YOLO v3 model made an accurate bounding box for the car carrier. However, YOLO v5s made a bounding box even for the fire smoke.
Figure (t) shows four container ships; however, neither model could distinguish between the four ships. The lower left part of the image was mispredicted.
The container ship in Figure (u) was a ship that had an accident in which the hull was split in two, and the training set contained no such images, but both models accurately predicted it to be a container ship.
6. Conclusion
Computer vision technology has been applied to various industries, and the maritime field is no exception. In this study, we investigated the detection of various types of ships using object detection technology.
Hence, nine ship types were selected and appropriate images were downloaded from Google. The downloaded images were converted to the JPG file format. 116, 15, and 21 images were classified into training, validation, and testing sets, respectively. The bounding box labeling of the training and validation sets were saved as text files in a format suitable for the YOLO model. Additionally, a YAML file was created for training the YOLO model.
Among various YOLO model versions, YOLO v3 and YOLO v5s were used, and the model was used by cloning a Git repository into Colab. YOLO v3, which has many parameters, required approximately five times the training time that of YOLO v5s.
Both models generally had excellent prediction performance on the validation set. However, when considering mispredictions, model size, and training time, YOLO v5s was better than YOLO v3.
Although good predictions were made for the testing set in general, some ships were incorrectly predicted or could not be distinguished. This result was considered to be because the model was trained with a small number of images. However, considering that good performance was achieved even with a small number of images, we consider that a model with higher prediction performance is possible, and it can be applied to future autonomous ships by reflecting the following recommendations: (i) A larger amount of images should be used, (ii) images of various angles, sizes, and colors should be evenly collected, (iii) images with multiple ships with different shapes should be used for training, (iv) images of various sea and sky colors should be collected, (v) images of various quality should be used, (vi) images of ships docked at various port facilities should be used, and (vii) images under various conditions (accidents, maritime environment) should be used.
Acknowledgments
This research was supported by the Autonomous Ship Technology Development Program [20016140] funded by the Ministry of Trade, Industry, & Energy (MOTIE, Korea); and the National Research Foundation of Korea (NRF) grant funded by the Korea government (MSIT) [NRF-2022R1F1A1073764].
Author Contributions
Conceptualization, Formal Analysis, Investigation, Methodology, Visualization, Writing – Original Draft, Writing - Review & Editing, M. H. Park; Supervision, Project Administration, J. H. Choi; Conceptualization, Supervision, Project Administration, Funding Acquisition, Writing - Review & Editing, W. J. Lee.
References
-
Y. Dong, F. Chen, S. Han, and H. Liu, “Ship object detection of remote sensing image based on visual attention,” Remote Sensing, vol. 13, no. 16, p. 3192, 2021. .
[https://doi.org/10.3390/rs13163192]

-
Y. Wang, C. Wang, H. Zhang, Y. Dong, and S. Wei, “Automatic ship detection based on RetinaNet using multi-resolution Gaofen-3 imagery,” Remote Sensing, vol. 11, no. 5, 2019. .
[https://doi.org/10.3390/rs11050531]

-
R. Yang, Z. Pan, X. Jia, L. Zhang, and Y. Deng, “A novel CNN-based detector for ship detection based on rotatable bounding box in SAR images,” IEEE Journal of Selected Topics in Applied Earth Observations and Remote Sensing, vol. 14, pp. 1938-1958, 2021. .
[https://doi.org/10.1109/JSTARS.2021.3049851]

- J. Li, C. Qu, and J. Shao, “Ship detection in SAR images based on an improved faster R-CNN,” 2017 SAR in Big Data Era: Models, Methods and Applications, BIGSARDATA, pp. 1-6, 2017. .
-
Y. L. Chang, A. Anagaw, L. Chang, Y. C. Wang, C. Y. Hsiao, and W. H. Lee, “Ship detection based on YOLOv2 for SAR imagery,” Remote Sensing, vol. 11, no. 7, 2019. .
[https://doi.org/10.3390/rs11070786]

-
Z. Hong, T. Yang, X. Tong, et al., “Multi-scale ship detection from SAR and optical imagery via a more accurate YOLOv3,” IEEE Journal of Selected Topics in Applied Earth Observations and Remote Sensing, vol. 14, pp. 6083-6101, 2021. .
[https://doi.org/10.1109/JSTARS.2021.3087555]

-
Z. Shao, H. Lyu, Y. Yin, et al., “Multi-scale object detection model for autonomous ship navigation in maritime environment,” Journal of Marine Science and Engineering, vol. 10, no. 11, p. 1783, 2022. .
[https://doi.org/10.3390/jmse10111783]

- S. J. Lee, M. I. Roh, H. W. Lee, J. S. Ha, and I. G. Woo, “Image-based ship detection and classification for unmanned surface vehicle using real-time object detection neural networks,” International Offshore and Polar Engineering Conference, p. ISOPE-I-18-411, 2018.
-
Z. Shao, L. Wang, Z. Wang, W. Du, and W. Wu, “Saliencyaware convolution neural network for ship detection in surveillance video,” IEEE Transactions on Circuits and Systems for Video Technology, vol. 30, no. 3, pp. 781-794, 2020. .
[https://doi.org/10.1109/TCSVT.2019.2897980]

-
H. Li, L. Deng, C. Yang, J. Liu, and Z. Gu, “Enhanced YOLO v3 tiny network for real-time ship detection from visual image,” IEEE Access, vol. 9, pp. 16692-16706, 2021. .
[https://doi.org/10.1109/ACCESS.2021.3053956]

-
J. H. Kim, N. Kim, Y. W. Park, and C. S. Won, “Object detection and classification based on YOLO-V5 with improved maritime dataset,” Journal of Marine Science and Engineering, vol. 10, no. 3, p. 377, 2022. .
[https://doi.org/10.3390/jmse10030377]

- Make Sense, Make Sense AI, https://www.makesense.ai/, , Published 2024.
- WIKIPEDIA, YAML, https://en.wikipedia.org/wiki/YAML, , Published 2024.
-
J. Redmon, S. Divvala, R. Girshick, and A. Farhadi, “You only look once: Unified, real-time object detection,” Proceedings of the IEEE Computer Society Conference on Computer Vision and Pattern Recognition, pp. 779-788, 2016. .
[https://doi.org/10.1109/CVPR.2016.91]

-
A. Kuznetsova, T. Maleva, V. Soloviev, “Detecting apples in orchards using YOLOv3 and YOLOv5 in general and close-up images,” Lecture Notes in Computer Science (Including Subseries Lecture Notes in Artificial Intelligence and Lecture Notes in Bioinformatics), vol. 12557, 2020. .
[https://doi.org/10.1007/978-3-030-64221-1_20]

-
A. Kuznetsova, T. Maleva, and V. Soloviev, “YOLOv5 versus YOLOv3 for apple detection, Cyber-Physical Systems: Modelling and Intelligent Control. Studies in Systems, Decision and Control, vol. 338, 2021. .
[https://doi.org/10.1007/978-3-030-66077-2_28]

-
A. Khalfaoui, A. Badri, and I. EL Mourabit, “Comparative study of YOLOv3 and YOLOv5’s performances for realtime person detection,” 2022 2nd International Conference on Innovative Research in Applied Science, Engineering and Technology, pp. 1-5, 2022. .
[https://doi.org/10.1109/IRASET52964.2022.9737924]

- J. Redmon and A. Farhadi, Yolov3: An incremental improvement. arXiv Prepr arXiv180402767, 2018.
-
Y. Dai, W. Liu, H. Li, and L. Liu, “Efficient foreign object detection between PSDs and metro doors via deep neural networks. IEEE Access, vol. 8, pp. 46723-46734, 2020. .
[https://doi.org/10.1109/ACCESS.2020.2978912]

- Ultralytics, YOLO v5, https://github.com/ultralytics/yolov5, , Published 2020.
-
D. Dlužnevskij, P. Stefanovč, and S. Ramanauskaite, Investigation of YOLOv5 efficiency in IPhone supported systems, Baltic Journal of Modern Computing, vol. 9, no. 3, pp. 333-344, 2021. .
[https://doi.org/10.22364/bjmc.2021.9.3.07]


