Influence of nonlinear DC electric fields on premixed flame characteristics
Copyright © The Korean Society of Marine Engineering
This is an Open Access article distributed under the terms of the Creative Commons Attribution Non-Commercial License (http://creativecommons.org/licenses/by-nc/3.0), which permits unrestricted non-commercial use, distribution, and reproduction in any medium, provided the original work is properly cited.
Abstract
This study analyzed the dynamic behavior of premixed flames propagating through a finite channel under the influence of an external electric field. A spatially varying nonlinear electric field was employed, examining changes in displacement flame velocity and flame curvature at points where the field strength increased abruptly. The experimental results revealed that as the flame approached the space with the applied electric field, the flame surface area expanded. Subsequently, when a positive voltage was applied, the flame surface area experienced negative stretch upon entering the electric field, leading to a rapid decrease in both the flame surface area and the displacement flame velocity. Conversely, when a negative voltage was applied, the flame surface area underwent positive stretch upon entering the electric field, resulting in a rapid increase in both the flame surface area and the displacement flame velocity. Ultimately, the derived flame curvature and the displacement flame velocity were found to be directly proportional in a linear relationship.
Keywords:
Nonlinear electric field, Flame curvature, Flame stretch, Unsteady electrically-assisted combustion, ITO1. Introduction
Combustion typically represents a complex physical and chemical process that generates intense light and thermal energy. The vast majority of energy resources consumed across industries, including the marine and shipbuilding, have been supplied through the combustion of fossil fuels, a method expected to continue for decades to come [1][2]. In the case of engines providing thrust for ships, stricter regulations for combustion devices are demanded due to various exhaust gas regulations by the International Maritime Organization (IMO) [3]-[5]. For instance, in terms of NOx, harmful substance emission regulations (Tier III) limit emissions to 7.7 g/kWh when the perminute rotation rate is over 2000 [3][4]. For CO2, which is a major contributor to greenhouse gases, a goal has been set to reduce emissions by 50% compared to 2008 [5].
From this perspective, electrically assisted combustion is gaining attention as an environmentally friendlier combustion technique compared to conventional methods, with benefits such as extending flammability limits [6]-[8], reducing NOX and CO emissions [7][8], and minimizing soot [9][10]. However, despite the various advantages of electrically assisted combustion, the basic physical and chemical operating mechanisms remain to be elucidated, implying that the reliability of simulations for electrically assisted combustion is still low [11].
Typically, when an external electric field is applied to a hydrocarbon flame, the charges generated by chemical ionization move along the applied electric field according to their respective polarity. Due to the mobility difference between the mostly density-rich electrons among the negative charges, and positive ions, the applied electric field within the flame induces a relatively strong electric field towards the cathode side [12]-[14]. In particular, the profile of the electric field depends on ion chemistry, the density of charges, and their electrohydrodynamic transport in the surrounding gas [15]. However, the majority of studies have focused on analyzing combustion in a steady state [11][13][16][17] and DC electric field in a linear state [11][13] [16]-[19], Consequently, there is a significant lack of literature related to unsteady combustion with applied nonlinear DC electric field.
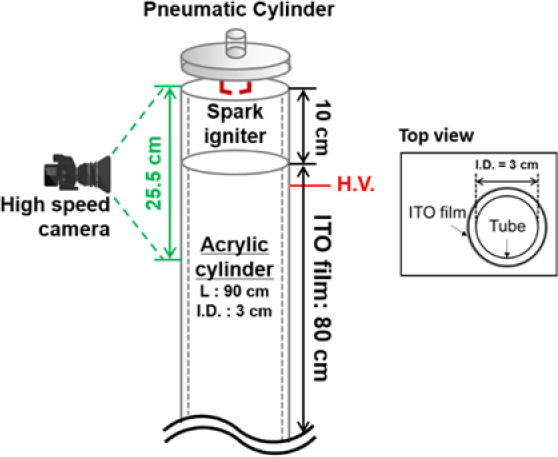
In this study, as depicted in the conceptual diagram shown in Figure 1, we adopted a method that applies a dielectric barrier discharge (DBD) electric field to only part of the space through which a premixed flame propagates within a finite area. A nonlinear electric field was introduced by adopting external electrodes only in parts of the combustion field, where the flame propagates in an unsteady state. In particular, the dynamic behavior of the flame was intensively analyzed and interpreted based on the polarity of the external electric field, which was configured with a single electrode.
2. Experimental Method
Figure 2 illustrates the schematic of the experimental setup utilized in this study. The apparatus consisted of a combustor, a flow controller, an electrical power unit, and visualization equipment. The combustor is an acrylic cylinder with one closed end and the other open, featuring an inner diameter of 3 cm and a length of 90 cm.
To apply an electric field, a single electrode was installed wrapping around the outer surface of the tube. When high voltage was applied to the inner wall of the tube, irregular streamers occurred due to direct contact between the flame and the electrode. To prevent this issue, the electric field was configured in a DBD (Dielectric Barrier Discharge) form, and the electrode was attached starting 10 cm from the top of the acrylic tube to form a DC nonlinear electric field. The electrode utilized an ITO (Indium Tin Oxide) film, which is composed of indium tin oxide, offering moderate strength along with high electrical conductivity and optical properties. Particularly, ITO is transparent, allowing for the capture of images of the flame propagating inside the tube. The DC (Direct Current) voltage range adopted was 0, ± 3, ± 5, ± 7, and ± 10 kV. The voltages were generated using a function generator (Keysight 33400B series) and a high-voltage amplifier (Trek 10/10B-Hs).
Regulation of the premixed gas composition was achieved using a mass flow controller (MFC), with the gas uniformly distributed through a ceramic honeycomb positioned at the bottom. Specific compositions of the premixed gas utilized in these experiments are detailed in Table 1. Propane (C3H8) served as the fuel, with carbon dioxide (CO2) added as a diluent in the basic gas mixture. Flame characteristics such as laminar burning velocities (SL) and adiabatic flame temperatures (Tb) were computed using CHEMKIN (Premix code) based on the USC II reaction mechanism [20].
The experimental procedure commenced with the introduction of the selected premixed gas into the combustion chamber, initially with the pneumatic cylinder cover in the open position. Subsequently, the cover was closed to allow the system to stabilize for 90 seconds. An automated system, incorporating a pneumatic device and function generator, was employed. Activation of the button initiated the opening of the cylinder cover via the function generator, simultaneously igniting the spark. Concurrently, a high-speed camera (Photron Fastcam, SA3) captured the flame's progression, commencing from the top of the acrylic tube and spanning a total length of 25.5 cm. The high-speed camera operated at a resolution of 256 × 1024 pixels with a frame rate of 1000 frames per second (fps).
3. Results and Discussion
3.1 Dynamic Flame Behavior Under Nonlinear DC Electric Fields
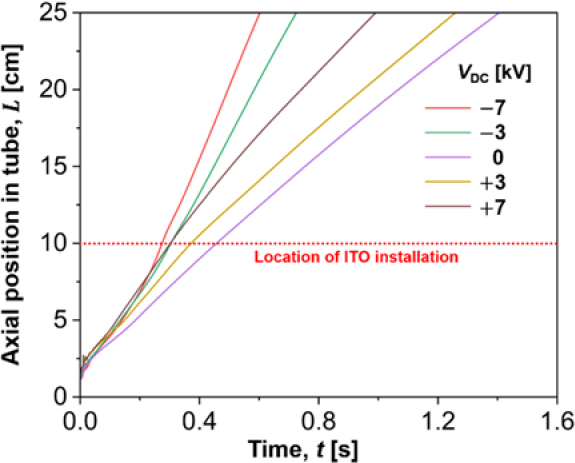
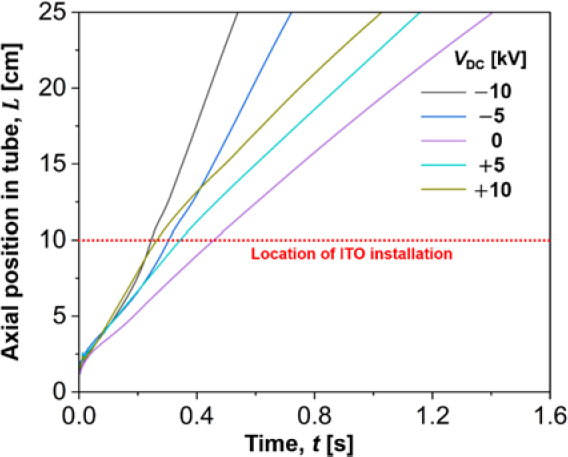
This section exclusively examines the dynamic flame behavior with various DC electric fields. Specifically, we aim to analyze the displacement flame velocity and changes in flame surface area before and after the attachment point of the electrode. Figure 3 and 4 illustrate the temporal evolution of flame propagation distance under various applied voltages. Figure 3 represents cases corresponding to VDC = 0 kV, ± 3 kV, and ± 7kV, while Figure 4 corresponds to VDC = 0 kV, ± 5 kV, and ± 10 kV. Here, L = 0 cm represents the top of the tube, and a single electrode is installed around the outer surface of the tube, starting 10 cm below the top and extending to the bottom. The red dotted line in the figures indicates the position within the tube where the ITO electrode is installed. Note that the baseline flame, where no electric field is applied (VDC = 0 kV), is designated as the baseline flame.
Upon initial observation of the baseline flame, variations in displacement flame velocity arise due to the generation of ignition kernel. Subsequently, the flame demonstrates downward propagation. Initially, except for the ignition onset, the baseline flame exhibits a constant displacement flame velocity, indicating steady propagation. At this case, the flame displacement velocity corresponds to 17.6 cm/s.
When applying VDC = ± 3 kV and ± 7 kV, the initial displacement flame velocity is similar to that of the baseline flame. However, as the flame approaches the installed ITO, the slope increases rapidly. The displacement flame velocity before reaching the ITO electrode is 36.3 cm/s, 28.9 cm/s, 27.8 cm/s, and 22.6 cm/s for VDC = - 7 kV, - 3 kV, + 7 kV, and + 3 kV, respectively. Subsequently, as the flame enters the area where the ITO electrode with relatively strong electric field is installed, changes in flame displacement velocity occur depending on the polarity. In the case of negative voltage applied, VDC = - 7 kV, - 3 kV, the displacement flame velocity increases to 42.4 cm/s and 34.4 cm/s, respectively. On the other hand, for positive voltage applied, VDC = + 7 kV, + 3 kV, the displacement flame velocity decreases to 24.5 cm/s and 17.5 cm/s, respectively. Despite the decrease in displacement flame velocity at negative voltage, it remains comparable to or faster than the baseline displacement flame velocity.
Figure 4 illustrates the temporal flame propagation characteristics for VDC = ± 5 kV, and ± 10 kV. As expected, the propagation characteristics in Figure 4 align with those in Figure 3. That is, the flames with applied electric fields propagate faster than the baseline flame before reaching the location of the installed ITO. Subsequently, when the flame enters the area with the installed ITO, the flame displacement velocity increases further when the polarity of the electric field is negative. However, when the polarity of the electric field is positive, the displacement flame velocity decreases but still remains similar to or faster than the baseline displacement flame velocity. The displacement flame velocity before reaching the ITO electrode is 39.7 cm/s, 28.6 cm/s, 33.5 cm/s, and 23.4 cm/s for VDC = - 10 kV, - 5 kV, + 10 kV, and + 5 kV, respectively. The flame displacement velocity after entering the ITO is also determined as 45.9 cm/s, 32.1 cm/s, 22.5 cm/s, and 19.1 cm/s for VDC = - 10 kV, - 5 kV, + 10 kV, and + 5 kV, respectively.
Figure 5 visually represents the flame propagation behavior according to the applied voltage. Following ignition, an ignition kernel occurs, and the flame surface area sharply increases until the flame reaches the inner wall of the tube. At this stage, the effect of the electric field is not prominently observed. As evident from the figure, regardless of the presence of the electric field, the time for initial flame formation remains almost the same, ranging from 0.03 to 0.06 seconds, and the growth rate of the flame surface area is also nearly identical. It is presumed that this growth rate determines the initial flame displacement velocity.
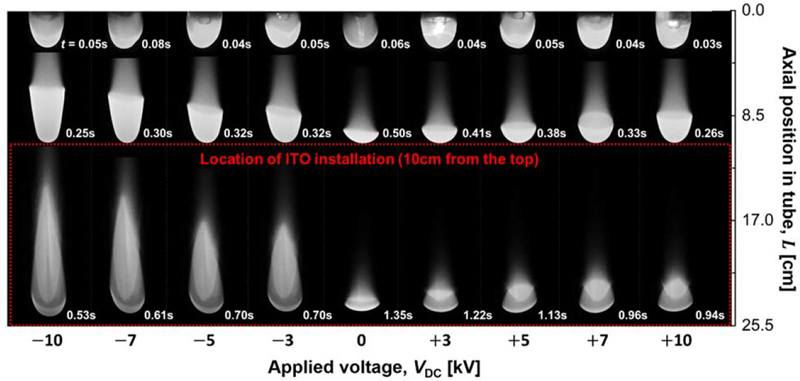
Sequential flame images demonstrating the propagation distance over time with various applied voltages
However, due to the relatively large distance of 10 cm between the ignition location and the ITO, the influence of the electric field is considered negligible. As the flame progresses toward the location where the ITO electrode is installed, variations in flame surface area occur depending on the presence of the electric field. In the case of the baseline flame where the electric field is not applied, the flame reaches the ITO within 0.5 seconds. The flame surface area decreases slightly compared to when the ignition kernel occurs, approaching almost the cross-sectional area of the tube. Considering that the laminar flame propagation velocity is 13 cm/s, it is presumed that the diminished flame surface area is due to volumetric flow induced by buoyancy.
For downward propagating flames, the critical velocity due to buoyancy can be defined as follows based on the results of Krivulin et al.'s high-g centrifuge experiments [21]:
| (1) |
Here, g represents the gravitational acceleration, and α denotes the thermal diffusivity. The critical velocity due to buoyancy is determined by the preheating effect of the flame front independent of the Lewis number. By utilizing Equation (1) to derive the critical velocity due to buoyancy under the experimental conditions, it is found to be 45.7 cm/s, which is higher than the adopted flame propagation velocity of 13.0 cm/s in this experiment. Therefore, the flame propagation characteristics are predominantly governed by the hydrodynamic effects induced by buoyancy. It is inferred that the suppression effect of buoyancy-induced flame surface growth outweighs the growth rate of flame surface area due to the gas expansion effect of incoming reactants [22].
In the case of a flame with an applied electric field, as shown in Figure 5, it can be observed that the flame surface area propagates in an expanded state relative to the baseline flame up to the ITO installation position. Examining the cases where a positive voltage was applied first, the arrival time at the ITO was faster than the baseline flame in all instances, and showed a trend of increasing speed with increasing applied voltage. Regarding the changes in flame surface area, in all cases, the flame maintained a relatively expanded surface area compared to the baseline flame, although it was smaller than the flame surface area shown by the growth of the ignition kernel, except for the + 10 kV case. For the + 10 kV case, the surface area right after ignition was similar to that of the grown flame, and among the flames with applied positive voltage, it showed the largest flame surface area.
Next, examining the cases where a negative voltage was applied, similar to those with positive voltage, the arrival time at the ITO was faster than the baseline flame in all instances, with a tendency to increase speed as the applied voltage increased. Regarding changes in the flame surface area, in all cases, the flame maintained a relatively expanded surface area compared to the baseline flame. Moreover, a more expanded flame surface area was observed compared to that shown by the growth of the ignition kernel.
To evaluate changes in flame behavior due to polarity changes, Figure 5 is revisited. As can be seen in the figure, the flame surface area for the case where a negative voltage was applied was relatively larger compared to when a positive voltage was applied, and the displacement flame velocity was also relatively faster. The sizes of the two-dimensional flame surface areas at VDC = + 10 kV and - 10 kV were 3.71 cm² and 12.9 cm² respectively, showing a difference of 3.5 times. These results can be understood in terms of the differences in mobility of the charge carriers that induce ionic wind.
Combustion based on hydrocarbon fuels typically involve the presence of both positive charges (CHO+,H3O+, etc.) and negative charges (electrons, O2-, OH- due to chemical ionization. When an electric field is applied, charged particles experience a force known as the Lorentz force, which accelerates them towards the electrodes based on their polarity. This motion of charged particles transfers momentum to the neutral particles, which constitute the majority of the number density, resulting in a large-scale bulk flow known as "ionic wind" [16]-[19]. Electrons, which constitute about 90% of the negative charge density, are known to have a mobility 1000 times higher than that of positive ions, resulting in a field intensity between the flame and the anode that is negligibly small compared to that at the cathode. However, the ionic wind towards the cathode cannot be ignored due to the phenomenon of O2 attachment, which results in a significant conversion of electrons into negative ions [16]-[19]. Therefore, even when a positive voltage is applied as shown in Figure 5, it can be understood why the flame surface area is relatively elongated compared to the baseline flame, and the flame displacement velocity also increases as the area consuming the reactants increases. Nevertheless, it is important that the effect of flame surface area expansion is not as significant when the positive voltage is applied compared to when the negative voltage is applied.
The flames entering the ITO electrodes, as depicted in Figures 3 to 5, exhibit variations in flame surface area and displacement flame velocity depending on the polarity, influenced by the electric field. This can be understood as an effect of flame stretching caused by the ionic wind, and a detailed explanation will be provided in Section 3.2.
3.2 Effects of Flame Stretch on Polarity Changes
In this section, we aim to discuss the changes in flame behavior when a propagating premixed flame enters a dielectric barrier with an installed ITO electrode where high voltage is applied. Alongside Figure 5, discussed in the previous section, we intend to selectively analyze the cases where the effects of the electric field were most pronounced at VDC = ± 10 kV.
Figure 6 illustrates the changes in displacement flame velocity and flame surface area along the flame propagation distance, accompanied by images of the flame at specific locations. For qualitative analysis, the baseline flame and the cases with VDC = ± 10 kV were selected. Initially, as mentioned in the previous section, the baseline flame experiences a reduction in flame surface area due to natural convection driven by buoyancy after the ignition kernel, maintaining a constant surface area in steady motion.
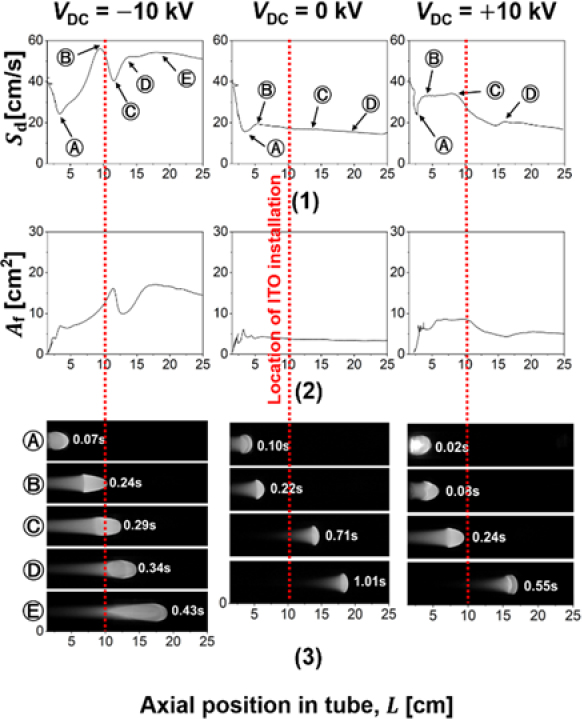
Correlation between flame displacement velocity and flame surface area as a function of flame propagation distance for VDC = 0 kV and ± 10 kV
In the case of VDC = - 10 kV, it can be observed that the flame displacement velocity increases up to 56.1 cm/s near the ITO before entering the dielectric barrier, where it temporarily decreases. This is evident from the flame image in Figure 6, where the flame briefly anchors due to the strong electric field near the edge where the ITO is installed, then increases its surface area before propagating further. Typically, in electromagnetism, the curvature radius of the surface decreases near the edges of electrodes, leading to a concentration of charge and an intensified electric field [23]. This sharp increase in electric field intensity likely causes the temporary anchoring of the flame. Once the flame surface area sufficiently extends and thermal diffusion to the reactants is adequate, there is a temporary increase in the flame propagation velocity, causing the flame to move away from the electrode edge. This increase in flame surface area can be attributed to positive stretch effects on the flame.
In the context of flame dynamics, the flame stretch, κ, is defined as the fractional rate of change of a Lagrangian surface element, A, and is expressed by Equation (2) [24]:
| (2) |
This relationship can be elaborated further, as derived in previous studies [25][26]:
| (3) |
This formulation provides a quantitative measure of the dynamic stretching behavior of the flame front. The first term on the right-hand side consists of the tangential velocity vector, the second term represents the unsteady term, and finally, the third term pertains to the flame curvature.
Considering the flame stretch relationship in Equation (3), applying a negative voltage to the ITO electrode results in the flame experiencing strong positive radial stretch, leading to an expansion of the flame surface area. Particularly, as mentioned in the previous section, since the mobility of positive ions is about 1000 times lower than that of electrons, the quantity of charge in the space at any given moment will be predominantly negative. This leads to relatively strong stretching and a rapid expansion of the flame surface area. This analysis explains why the flame within the dielectric barrier experiences greater elongation when a negative voltage is applied compared to when a positive voltage is applied.
In contrast, for VDC = + 10kV, the flame displacement velocity increases up to 34 cm/s near the ITO before entering the dielectric barrier, where it then temporarily decreases sharply and eventually converges to a velocity similar to the baseline flame. This phenomenon can also be observed in the flame images in Figure 6, where the flame briefly anchors due to the strong electric field near the corner where the ITO is installed, and then propagates after a reduction in surface area. While this temporary flame behavior can be understood as an effect of the edge of the electric field, the decrease in flame surface area, contrary to the increase observed when a negative voltage is applied, is highly unusual.
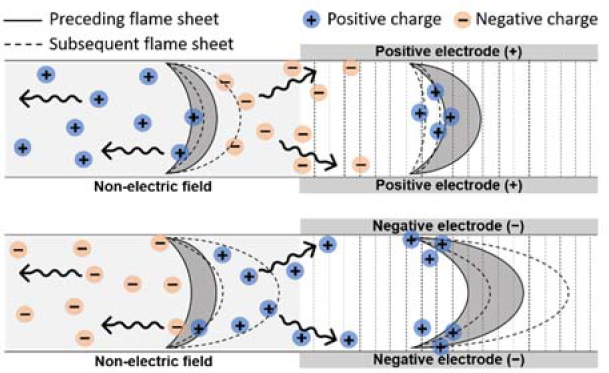
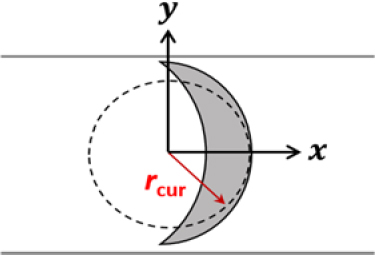
To further understand this mechanism, Figure 7 illustrates a conceptual image of the changes in ionic wind around the dielectric barrier due to polarity changes. The top image represents the case where a positive voltage is applied, and the bottom image represents the case with a negative voltage applied. From left to right, the flame propagates, and the area where the ITO electrode is installed is on the right. The gray crescent shape indicates the preceding flame sheet over time, while the dashed crescent shape shows subsequent changes in flame behavior.
When examining the case with a positive voltage applied, it can be hypothesized that before entering the ITO, electrons at the flame front adsorb onto oxygen contained in the reactants, converting into negative ions and generating ionic wind. This ionic wind at the flame front could lead to a relative decrease in the convective flow induced by buoyancy, thereby extending the flame surface area. Particularly, the ionic wind caused by positive ions in the downstream is unlikely to significantly affect flame behavior due to the rapid velocity of the exhaust gases caused by gas expansion. Considering an adiabatic flame temperature of 1913 K, the expansion ratio of the exhaust gases is estimated to be approximately sixfold based on the ideal gas law. However, as the flame enters the dielectric barrier installed with ITO, the movement of negative charges can be considered negligible. This is because the direction of the ionic wind shifts radially relative to the flame surface area, and the collision frequency of electrons with oxygen along their path significantly reduces, diminishing the scale of the ionic wind. Nevertheless, as positive ions move toward the tube's central axis due to repulsion, radial convective flow occurs, and the flame surface area contracts (i.e., negative flame stretch). This mechanism explains why the flame surface area decreases as it enters the dielectric barrier.
Next, examining the case where a negative voltage is applied, it is inferred that prior to entering the ITO, the relatively high density of positive charges at the flame front induces strong ionic wind, causing the flame surface area to extend more than when a positive voltage is applied. Once the flame enters the dielectric barrier where the ITO is installed, the movement of positive charges shifts radially relative to the flame surface, and the flame experiences strong positive stretching. Consequently, the flame surface area dramatically increases, and the flame displacement velocity is understood to rise sharply.
Figure 8 illustrates the variation in average displacement flame velocity 5 cm before and after the ITO electrode according to the applied voltage. Given that the installed range of the ITO spans 10 cm along the tube length, the red symbols represent the average displacement flame velocity within the 5 - 10 cm range from the top of the tube. Conversely, the green symbols indicate the average displacement flame velocity in the 10 - 15 cm range from the tube top. As shown in the figure, cases with a negative voltage applied exhibit faster displacement velocities than the baseline flame across both before- and after-ITO regions, with velocities being relatively faster upon entering the ITO. In contrast, with a positive voltage, the displacement velocities before and after the ITO are similar to or faster than those of the baseline flame. Unlike the negative voltage cases, the displacement velocities before entering the ITO are faster than those within the ITO. These experimental results are consistent with the inferences previously discussed.
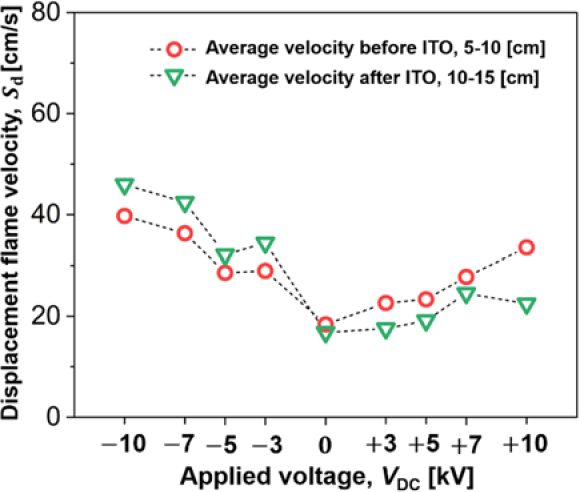
Variation in average displacement flame velocity 5 cm before and after the ITO electrode according to the applied voltage
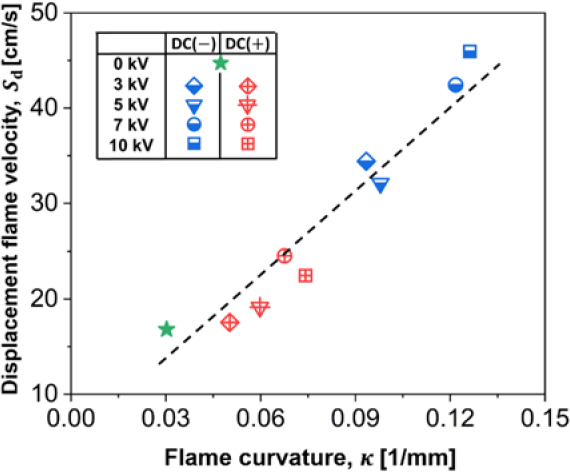
To measure the radius of flame curvature as shown in Figure 9, the image captured by the high-speed camera was used to obtain the x, y coordinates using MATLAB, and points were obtained using triple points. Then, the radius of flame curvature was calculated using Equation (4) below.
| (4) |
Figure 10 shows correlation of frame curvature and displacement flame velocity with various applied voltages. As shown in the Figure 10, flame curvature and displacement flame velocity increase when the electric field is applied based on VDC = 0 kV (baseline flame), and the flame curvature and velocity increase especially when the electric field is applied. As indicated by the flame stretch relationship in Equation (3), applying a negativevoltage results in increased displacement flame velocity due to the strong positive stretch on the flame surface caused by ionic wind within the electric field. Conversely, despite negative stretching of the flame surface when a positive voltage is applied, the displacement flame velocity is observed to be faster than the baseline flame. This can be attributed to the extended flame surface at the ITO forefront, which likely leads to an overestimation due to the transition time during which the displacement flame velocity decrease. Such overestimation indicates the need for future studies to expand the observation area of the flame to derive more quantitative values.
4. Conclusion
This study explored the complex interaction between combustion and electric fields by applying a dielectric barrier discharge (DBD) electric field to a confined space in which a premixed flame propagates. This study differs from previous studies by applying a spatially nonlinear electric field.
First, significant changes in flame behavior were observed when the voltage around the electrode was varied. The displacement flame velocity varied with the polarity and magnitude of the applied voltage; in general, the higher the applied voltage, the faster the flame velocity, with distinct trends before and after entering the electrode region.
Furthermore, the effects of positive and negative electrodes on the flame behavior were closely investigated to elucidate the role of the ionic wind in driving the flame dynamics. Although the bulk flow before entering the electrode affected the increase in flame velocity, inside the electrode, the flame velocity tended to decrease with the application of positive electrodes, while it tended to increase with the application of negative electrodes. This variation is mainly due to the differing number densities between positive and negative charges, with and without electron impact attachment.
In particular, a strong correlation was observed between flame curvature and displacement flame velocity as a function of the applied electric field. The flame curvature increased with the strength of the electric field, suggesting a complex interaction between the flame dynamics and the external electric force.
Acknowledgments
This research was supported by Basic Science Research Program through the National Research Foundation of Korea (NRF) funded by the Ministry of Education (No. 2021R1I1A3061305).
Author Contributions
Conceptualization, D. W. IM and S.H.YOON; Methodology, D. W. IM; Software, D. W. IM; Validation, D. W. IM and S.H.YOON; Formal Analysis, D. W. IM; Investigation, D. W. IM; Resources, S.H.YOON; Data Curation, D. W. IM; Writing—Original Draft Preparation, D. W. IM; Writing—Review & Editing, S.H.YOON; Visualization, D. W. IM; Supervision, S.H.YOON; Project Administration, S.H.YOON; Funding Acquisition, S.H.YOON.
References
- P. Chefurka, World Energy and Population, http://paulchefurka.ca, , 2007.
-
W. Cai and C. F. Kaminski, “Tomographic absorption spectroscopy for the study of gas dynamics and reactive flows,” Progress in Energy and Combustion Science, vol. 59, pp. 1-31, 2017.
[https://doi.org/10.1016/j.pecs.2016.11.002]

- IMO, “Amendments to the technical code on control of emission of nitrogen oxides from marine diesel engines,” MEPC. 177(58), International Maritime Organization: London, Oct 10, 2008.
- IMO, “Amendments to the annex of the protocol of 1997 to amend the international convention for the prevention of pollution from ships, 1973, as modified by the protocol of 1978 relating thereto,” MEPC. 251(66), International Maritime Organization: London, Apr 4, 2014.
- IMO, “2023 IMO strategy on reduction of GHG emissions from ships,” MEPC. 377(80/WP.12). Annex 1, pp. 1, International Maritime Organization: London, July 7, 2023.
-
D. Galley, et al., “Plasma-enhanced combustion of a lean premixed air-propane turbulent flame using a nanosecond repetitively pulsed plasma,” 43rd AIAA Aerospace Sciences Meeting and Exhibit, p. 1193, 2005.
[https://doi.org/10.2514/6.2005-1193]

-
G. T. Kim, B. H. Seo, W. J. Lee, J. Park, M. K. Kim, S. M. Lee, “Effects of applying non-thermal plasma on combustion stability and emissions of NOx and CO in a model gas turbine combustor,” Fuel, vol. 194, pp. 321-328, 2017.
[https://doi.org/10.1016/j.fuel.2017.01.033]

-
G. T. Kim, C. S. Yoo, S. H. Chung, and J. Park, “Effects of non-thermal plasma on the lean blowout limits and CO/NOx emissions in swirl-stabilized turbulent lean-premixed flames of methane/air,” Combustion and Flame, vol. 212, pp. 403-414, 2020.
[https://doi.org/10.1016/j.combustflame.2019.11.024]

-
M. S. Cha, S. Lee, K. Kim, and S. Chung, “Soot suppression by nonthermal plasma in coflow jet diffusion flames using a dielectric barrier discharge,” Combustion and Flame, vol. 141, no. 4, pp. 438-447, 2005.
[https://doi.org/10.1016/j.combustflame.2005.02.002]

-
D. G. Park, B. C. Choi, M. S. Cha, and S. H. Chung, “Soot reduction under DC electric fields in counterflow non-premixed laminar ethylene flames,” Combustion Science and Technology, vol. 186, pp. 644-656, 2014.
[https://doi.org/10.1080/00102202.2014.883794]

-
M. Belhi, B. J. Lee, M. S. Cha, and H. G. Im, “Three-dimensional simulation of ionic wind in a laminar premixed Bunsen flame subjected to a transverse DC electric field,” Combustion and Flame, vol. 202, pp. 90-106, 2019.
[https://doi.org/10.1016/j.combustflame.2019.01.005]

-
K. Xu, “Plasma sheath behavior and ionic wind effect in electric field modified flames,” Combustion and Flame, vol. 161, no. 6, pp. 1678-1686, 2014.
[https://doi.org/10.1016/j.combustflame.2013.12.008]

-
Y. Xiong, et al., “DC field response of one-dimensional flames using an ionized layer model,” Combustion and Flame, vol. 163, pp. 317-325, 2016.
[https://doi.org/10.1016/j.combustflame.2015.10.007]

-
J. M. Goodings, et al., “Current–voltage characteristics in a flame plasma: analysis for positive and negative ions, with applications,” International Journal of Mass Spectrometry, vol. 206, no. 1-2, pp. 137-151, 2001.
[https://doi.org/10.1016/S1387-3806(00)00398-5]

-
T. D. Butterworth and M. S. Cha, “Electric field measurement in electricfield modified flames,” Proceedings of the Combustion Institute, vol. 38, no. 4, pp. 6651-6660, 2021.
[https://doi.org/10.1016/j.proci.2020.08.019]

-
D. G. Park, S. H. Chung, and M. S. Cha, “Bidirectional ionic wind in nonpremixed counterflow flames with DC electric fields,” Combustion and Flame, vol. 168, pp. 138-146, 2016.
[https://doi.org/10.1016/j.combustflame.2016.03.025]

-
D. G. Park, S. H. Chung, and M. S. Cha, “Visualization of ionic wind in laminar jet flames,” Combustion and Flame, vol. 184, pp. 246-248, 2017.
[https://doi.org/10.1016/j.combustflame.2017.06.011]

-
S. H. Won, S. K. Ryu, M. K. Kim, M. S. Cha, and S. H. Chung, “Effect of electric fields on the propagation speed of tribrachial flames in coflow jets,” Combustion and Flame, vol. 152, no. 4, pp. 496-506, 2008.
[https://doi.org/10.1016/j.combustflame.2007.11.008]

-
S. H. Yoon, B. Seo, J. Park, S. H. Chung, and M. S. Cha, “Edge flame propagation via parallel electric fields in non-premixed coflow jets,” Proceedings of Combustion Institute, vol. 37, no. 4, pp. 5537-5544, 2019.
[https://doi.org/10.1016/j.proci.2018.06.026]

- R. J. Kee, R. M. Rupley, J. A. Miller, Sandia National Laboratories: Albuquerque, NM, SAND 89-8009B, 1989.
-
V. N. Krivulin, et al., “Effect of acceleration on the limits of propagation of homogeneous gas flames,” Combustion, Explosion and Shock Waves, vol. 17, no. 1, pp. 37-41, 1981.
[https://doi.org/10.1007/BF00772781]

-
G. I. Sivashinsky, “Nonlinear analysis of hydrodynamic instability in laminar flames,” Acta Astronautica, vol. 4, no. 11-12, pp. 1177-1206, 1977.
[https://doi.org/10.1016/0094-5765(77)90096-0]

-
A. Schuster, “Experiments on the discharge of electricity through gases (Second Paper),” Proceedings of the Royal Society of London, vol. 42, pp. 371-379, 1887.
[https://doi.org/10.1098/rspl.1887.0082]

- F. A. Williams, “Combustion theory Benjamin,” Cummings, Menlo Park 808, 1985.
-
S. H. Chung and C. K. Law, “An invariant derivation of flame stretch,” Combustion and Flame, vol. 55, no. 1, pp. 123-125, 1984.
[https://doi.org/10.1016/0010-2180(84)90156-1]

-
M. Matalon, “On flame stretch,” Combustion Science and Technology, vol. 31, pp. 169-181, 1983.
[https://doi.org/10.1080/00102208308923638]


