Precise solving procedure of modal eigenvalues at a subwavelength metal-insulator-metal slit at terahertz frequencies
Copyright © The Korean Society of Marine Engineering
This is an Open Access article distributed under the terms of the Creative Commons Attribution Non-Commercial License (http://creativecommons.org/licenses/by-nc/3.0), which permits unrestricted non-commercial use, distribution, and reproduction in any medium, provided the original work is properly cited.
Abstract
This study proposed a method for obtaining the transverse propagation constant, which is the basis for the mode-matching technique in a periodic metal-insulator-metal (MIM) waveguide and is an eigenvalue of the waveguide mode. When considering the relative permittivity of the metal in the terahertz region, the solving process becomes complicated, and accurate roots are difficult to determine. Therefore, a specific procedure was explained considering Ag at 10 terahertz as an example. Owing to the complex permittivity of the metal, the Müller’s method, which is a process of finding complex roots from the dispersion equation in MIM waveguides, was applied. The calculation of the eigenvalues can aid in the determination of the resonant power transmission in a single metallic slit.
Keywords:
Metal-insulator-metal waveguide, Mode matching, Müller’s method, Transverse propagation constant, Terahertz frequency1. Introduction
Resonant power transmission through apertures or slits has been investigated in several studies. In initial research, primarily, the resonant transmission phenomena made by perfect electric conductors (PECs) were studied [1]; however, in recent years, many resonant transmissions have been presented in the case of real metals at high frequencies, such as in the terahertz (THz) regime, which deviates from the PECs [2]-[5]. These studies have presented various practical resonant transmission results by considering the complex permittivities of metals at higher fre-quencies.
There are various methods to numerically calculate the reso-nant transmission through a slit. Traditional numerical techniques include the finite-difference time domain or finite element meth-ods [6]. However, these are classified as “brute-forced” simula-tions. Consequently, methods that can aid in better understanding the physical meaning have been proposed. One such method is the mode-matching technique (MMT) [7][8]. By applying the MMT, the physical meaning can be easily understood, and the analysis time can be reduced. Hence, the analysis becomes rela-tively simple if only the material properties of the metal are ap-propriately entered based on the THz frequency [2].
This study specifically introduced the process of obtaining ei-genvalues in a metallic slit composed of a metal-insulator-metal (MIM) waveguide, which is a constituent mode when applying the MMT to a slit structure. Point and discretized continuous spectra (DCS) are composed of modes in the MIM waveguide, rendering it possible to easily understand the principles of reso-nant wave propagation. Attaining a good understanding of how to obtain each mode in a specific MIM waveguide structure fa-cilitates easy application even if the slit structure (e.g., slit width and period) changes. It can be applied in a simple manner despite a change in the relative permittivity of the metal. Once the modes are completely calculated, the resonant transmission characteris-tics can be solved easily.
The fundamentals of MIM slits can be applied in areas such as near-field microscopy [9], optical data storage [10], and solar power generation. Therefore, this study serves as a foundation for various research fields. In addition, MMT is meaningful be-cause MMT-related research has been conducted for a long time and applied to research fields such as periodic structures [11], discontinuity analysis of waveguides [7], and electromagnetic wave scattering characteristics in resonators.
2. Solving Process of Propagation Constants
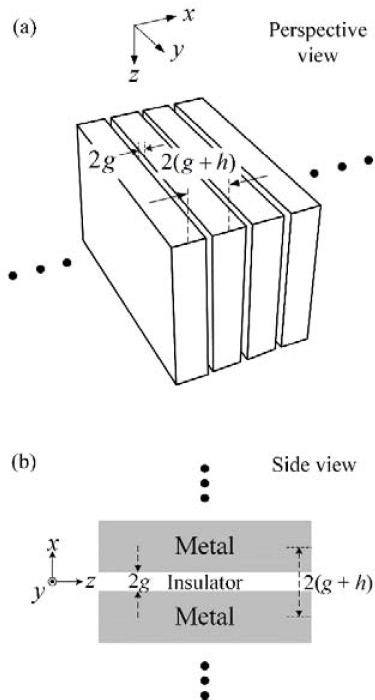
The geometry of the MIM waveguide is shown in Figure 1. The thicknesses of the metal and insulator were assumed to be 2h and 2g, respectively; therefore, the period was 2(g + h). The structure extended infinitely along the y-axis. We assumed that a transverse magnetic (TM) wave travelled along the positive z-direction. The insulator was assumed to be air in this study; therefore, the relative permittivity of the insulator was fixed at 1. In this case, the dispersion equation is expressed as follows [12]:
| (1) |
| (2) |

Geometry of the periodic MIM waveguide with gap and period of 2g and 2(g+h), respectively. The structure is uniform along the y-axis
where εr,m and εr,i are the relative permittivities of the metal and insulator, respectively, κm,n and κi,n represent the associated trans-verse propagation constants in the metal and insulator sections of the MIM waveguides, respectively, kz,n is the propagation con-stant in the z-direction, and the second subscript, n, indicates the modal index. Further, κm,n, κi,n, and kz,n are related to one another as expressed in Equation (2). Upon determining κm,n, the other propagation constants κi,n, and kz,n can be obtained. Consequently, the slit resonant transmission can be analyzed. In the THz region, the relative permittivity of metals varies depending on frequency, for example, the εr,m of silver at 10 THz is -37489 - j21694 [13]-[15].
As mentioned in the introduction, solutions in MIM wave-guides can be divided into a point spectrum and a DCS. The point spectrum can describe various sinusoidal field patterns, mainly in insulators. Whereas, the DCS describes sinusoidal field patterns, mainly in metals. All solutions must be determined be-cause both spectra contribute to field decomposition. If we un-derstand the process of solving the point spectrum, the process for DCS is similar and not difficult; therefore, we skipped the procedure for solving the eigenvalues for DCS [3].
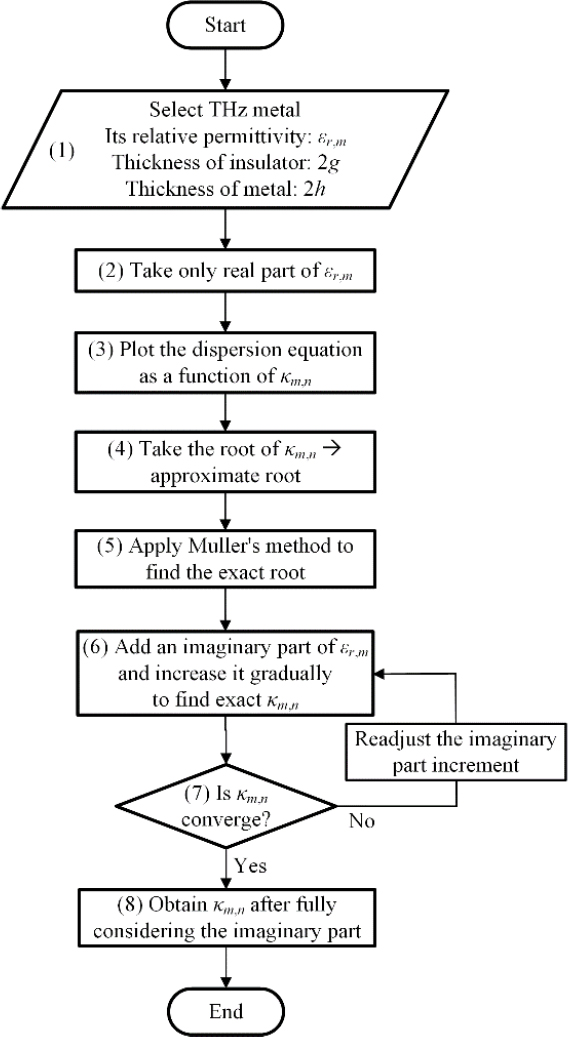
The process of calculating the point spectrum is described in the flowchart shown in Figure 2. First, we determined a solution for the TM0 mode, which is the fundamental mode of the MIM waveguide.
(1) - To find a solution (eigenvalue) for the point spectrum, we input the thickness of the insulator, period of the geometry, and relative permittivities of the metal and insulator of the MIM waveguide. The relative permittivity of a metal varied depending on the type of metal or the frequency changes.
(2) The relative permittivity of the metal is usually expressed in real and imaginary parts; however, if both parts are considered simultaneously in the calculation, it is difficult to directly obtain the eigenvalue. This is because Müller’s method [16] obtains a solution when the initial approximation of the eigenvalue is close to the exact root. If the first trial solution deviates slightly from the exact solution, the solution may diverge to infinity and cannot be solved. Therefore, only the real part was considered first. The solution was obtained, and then the imaginary part was added and slightly increased to converge to the exact solution.
(3) An initial approximate solution must be set. How can this approximation be established? We set the purely real and imaginary parts of κm,0 at tight intervals within 0–10 (for example), and then substituted it into Equation (1) to determine the exact solu-tion for the purely real part of εr,m using any root finding method for real number.
(4) - Among the solutions obtained by the process presented in (3), the greatest root was the eigenvalue (κm,0) of the TM0 mode.
(5) Müller’s method was applied to obtain a more accurate so-lution. Subsequently, the exact root of κm,0 was obtained. How-ever, only the real part of the relative permittivity in the metal region was considered.
(6), (7), and (8) - A small amount of the imaginary part of the relative permittivity εr,m for the metal was added and it was in-creased slightly to find an eigenvalue using the Müller’s method. If the imaginary part increases rapidly, the root will not converge; therefore, it is better for the imaginary part to increase gradually. Eventually, the solution of the transverse propagation constant κm,0 for the TM0 mode was obtained, when the imaginary part was entirely considered. To verify this solution, we substituted it into Equation (1). Alternatively, the field pattern for the mode can be described [2] and then verified when the field pattern in the insulator is almost constant for the TM0 mode, which is very similar to the pattern of the fundamental mode of the parallel-plate waveguide.
Alternatively. we can confirm that the transverse propagation constant κm,0 is correctly obtained from properly-derived kz,0 (See Equation (2)). It has already been shown that the propagation constant kz,0 exactly corresponds to the “periodic resonance” of transmission resonance phenomena through a THz metal slit [2].
Once the solving process of the eigenvalue for the TM0 mode is complete, the eigenvalues for higher modes such as TM2 and TM4 can be found in the same manner by going back to step (3) and considering the next greatest root.
3. Numerical Results and Modal Field Patterns
Considering the discussion of the root-finding process for the point spectrum in the previous section, changes in the point spec-trum can be examined as the imaginary part of the permittivity of the metal increases.
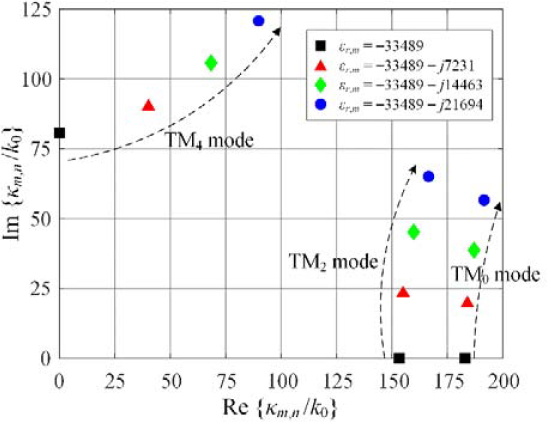
As shown in Figure 3, the solutions for the TM0, TM2, and TM4 modes were obtained for Ag at 10 THz. Because solving a root directly by considering both the real and imaginary parts from the beginning is challenging, the imaginary part was initially excluded. As it is relatively easy to find the point spectrum when only the real part is considered, the roots were calculated as de-picted in the black square by substituting the real part of εr,m into Equation (1). Obviously, there were three roots along with higher-order modes. However, it is sufficient to mention only the first three roots because we aimed to focus on the process of finding the roots. The imaginary part of the permittivity increased slightly. For example, we added -j1000 from the purely real part of εr,m, determined a changed root for each mode, and then again increased the imaginary part by the same amount to obtain a more correct root. In this process, if a root was not directly obtained when increasing by -j1000, the root could be obtained by increas-ing by -j500 (for example). This procedure is explained in conditional statement (7) of Figure 2. When the imaginary part was in-creased to -j7231, the first three solutions obtained are indicated by red triangles in Figure 3. When the imaginary part was in-creased by -j14463 in the same manner, the obtained roots are displayed as green diamonds. For the final increase to -j21694, the final normalized transverse propagation constant κm/k0 was computed by indicating them as blue circles.

First three point spectrum roots κm/k0 for considering only real part (black), increasing imaginary parts (red and green), and both entire real and imaginary parts (blue) of relative permittivity of Ag at 10 THz.
By using the solved roots (blue circles) κm, the corresponding κi and kz can also be obtained using the relation in Equation (2). The y-component magnetic field [2] is described in Figure 4. In accordance with the first, second, and third roots, the Hy-fields for the three modes corresponded to Figures 4 (a), (b), and (c), respectively. The obtained roots in Figure 3 were confirmed by checking the sinusoidal patterns formed inside the insulator (white centers).

Field patterns for (a) TM0, (b) TM2, and (c) TM4 modes. The central white region is a part of the insulator and the green regions outside the insulator indicate Ag. The relative permittivity of the Ag is -33489 - j21694
If both the point spectrum and DCS are obtained (although solving DCS [3] is not introduced in this work), the resonant transmitted power through the metallic slit in THz can be system-atically solved using the MMT. Transmittances can be calculated according to changes in the metal, frequency, and width of the insulator, as confirmed in [2][4].
4. Conclusion
This study proposed a method to obtain the eigenvalues (transverse propagation constants) of the first three modes for the MIM waveguide geometry in the THz regime. Based on the ge-ometric period, insulator width, and relative permittivity of the metal, a dispersion equation was formed, and the modal eigen-values was solved. However, as it was difficult to obtain the eigenvalues directly from the dispersion equation, we obtained a trial root by excluding the imaginary part from the relative permit-tivity of the metal. Subsequently, the imaginary part was gradual-ly increased to obtain an exact root. By gradually adding an imag-inary part, it was possible to confirm that the complex-numbered eigenvalues deviated from the purely real or imaginary numbers. After examining the magnetic fields formed in the MIM wave-guide, it was possible to verify whether the solved roots were valid or not. These results are useful because the roots provide the basis for analyzing the resonant slit transmission by MMT.
Acknowledgments
This work was supported by the National Research Foundation of Korea(NRF) grant funded by the Korea government(MSIT) (No. 2020R1G1A1102288).
Author Contributions
Conceptualization, J. -E. Park; Methodology, J. -E. Park; Software, J. -E. Park; Formal Analysis, J. -E. Park; Investigation, J. -E. Park; Resources, J. -E. Park; Data Curation J. -E. Park; Writing-Original Draft Preparation, J. -E. Park; Writing-Review & Editing, J. -E. Park; Visualization, J. -E. Park; Funding Acquisition, J. -E. Park.
References
-
R. F. Harrington and D. T. Auckland, “Electromagnetic transmission through narrow slots in thick conducting screens,” IEEE Transactions on Antennas and Propagation, vol. 28, no. 5, pp. 616-622, 1980.
[https://doi.org/10.1109/TAP.1980.1142382]

-
J. -E. Park, F. L. Teixeira, and B. -H. V. Borges, “Analysis of deep-subwavelength Au and Ag slit transmittances at terahertz frequencies,” Journal of the Optical Society of America B, vol. 33, no. 7, pp. 1355-1364, 2016.
[https://doi.org/10.1364/JOSAB.33.001355]

- J. Hur, H. Choo, and J.-E. Park, “Modal analysis of point and discretized continuous spectra for metal-insulator-metal waveguides in the terahertz region,” Journal of Electrical Engineering & Technology, vol. 13, no. 4, pp. 1644-1654, 2018.
-
J. -E. Park, H. Choo, and Y. -K. Cho, “Resonant transmission through a single subwavelength slit for varied metallic permittivities and its modal orthogonality,” Applied Sciences, vol. 10, no. 2, p. 660, 2020.
[https://doi.org/10.3390/app10020660]

-
S. Yoo, J. -E. Park, and H. Choo, “Resonant transmission through periodic subwavelength terahertz metallic slits based on a quartz plate,” Results in Physics, vol. 16, p. 102881, 2020.
[https://doi.org/10.1016/j.rinp.2019.102881]

-
F. L. Teixeira, “Time-domain finite-difference and finiteelement methods for Maxwell equations in complex media,” IEEE Transactions on Antennas and Propagation, vol. 56, no. 8, pp. 2150-2166, 2008.
[https://doi.org/10.1109/TAP.2008.926767]

-
A. Wexler, “Solution of waveguide discontinuities by modal analysis,” IEEE Transactions on Microwave Theory and Techniques, vol. 15, no. 9, pp. 508-517, 1967.
[https://doi.org/10.1109/TMTT.1967.1126521]

- W. C. Chew, Waves and Fields in Inhomogeneous Media, Wiley-IEEE, 1995.
-
H. M. Oh, G. H. Han, H. Kim, J. J. Bae, M. S. Jeong, and Y. H. Lee, “Photochemical reaction in monolayer MoS2 via correlated photoluminescence, Raman spectroscopy, and atomic force microscopy,” ACS Nano, vol. 10, no. 5, pp. 5230-5236, 2016.
[https://doi.org/10.1021/acsnano.6b00895]

-
X. Yuan, M. Zhao, X. Guo, Y. Li, Z. Gan, and H. Ruan, “Zn2+ responsive fluorescence enhancement for optical data storage,” Applied optics, vol. 59, no. 4, pp. 1249-1252, 2020.
[https://doi.org/10.1364/AO.378204]

-
R. -B. Hwang, Periodic Structures: Mode-matching Approach and Applications in Electromagnetic Engineering, John Wiley & Sons Singapore, 2012.
[https://doi.org/10.1002/9781118188040]

-
S. E. Kocabas, G. Veronis, D. A. B. Miller, and S. Fan, “Modal analysis and coupling in metal-insulator-metal waveguides,” Physical Review B, vol. 79, p. 035120, 2009.
[https://doi.org/10.1103/PhysRevB.79.035120]

-
A. D. Rakic, A. B. Djurisic, J. M. Elazar, and M. L. Majewski, “Optical properties of metallic films for vertical-cavity optoelectronic devices,” Applied Optics, vol. 37, no. 22, pp. 5271-5283, 1998.
[https://doi.org/10.1364/AO.37.005271]

-
M. A. Ordal, R. J. Bell, R. W. Alexander, L. L. Long, and M. R. Querry, “Optical properties of Au, Ni, and Pb at submillimeter wavelengths,” Applied Optics, vol. 26, no. 4, pp. 744-752, 1987.
[https://doi.org/10.1364/AO.26.000744]

-
H. -J. Hagemann, W. Gudat, and C. Kunz, “Optical constants from the far infrared to the x-ray region: Mg, Al, Cu, Ag, Cu, Bi, C, and Al2O3,” Journal of the Optical Society of America, vol. 65, no. 6, pp. 742-744, 1975.
[https://doi.org/10.1364/JOSA.65.000742]

- K. E. Atkinson, An Introduction to Numerical Analysis, Wiley, 1989.

