Exhaust Gas Recirculation (EGR) effect on two-stroke diesel engines under sailing condition
Copyright © The Korean Society of Marine Engineering
This is an Open Access article distributed under the terms of the Creative Commons Attribution Non-Commercial License (http://creativecommons.org/licenses/by-nc/3.0), which permits unrestricted non-commercial use, distribution, and reproduction in any medium, provided the original work is properly cited.
Abstract
Selective catalytic reduction (SCR) is commonly employed to reduce NOx emissions and meet Tier III regulations for marine diesel engines. However, challenges arise when applying SCR to two-stroke diesel engines because the catalyst may not function effectively at lower exhaust gas temperatures. To address this issue, exhaust gas recirculation (EGR) has been introduced in two-stroke diesel engines, such as the T/S Baek-kyung, a Pukyong National University training ship. There are ecoEGR to improve fuel consumption. The T/S Baek-kyung is equipped with a controllable pitch propeller and uses a combinator mode for normal sailing, which differs from the operating conditions in the NOx technical files; therefore, data from actual operations are rare. Sailing data under various conditions (loads and EGR rates) were obtained and analyzed. A comparison of the Tier II and ecoEGR modes showed no significant difference in engine performance; however, there was a reduction in NOx and particulate matter with an increase in CO2. There was a significant difference in the performance at approximately 50% load owing to the influence of the combinator mode.
Keywords:
Nitrogen Oxides, Exhaust gas recirculation, Two-stroke, Diesel engine, Particulate matter1. Introduction
On January 1, 2016, Tier III regulations for NOx emissions were strengthened in emission control areas (ECAs), achieving an 80% reduction compared with Tier I regulations. Many ships have implemented selective catalytic reduction (SCR) devices to meet Tier III requirements. For the efficient functioning of the catalyst during SCR operation, a stable exhaust gas temperature in the range of approximately 280–540 °C is required.
A four-stroke diesel engine can achieve high exhaust gas temperatures even if it uses a low-pressure (LP)-SCR, with the SCR located behind the turbocharger. Despite the simplicity and high efficiency of LP-SCR, the low exhaust gas temperature of two-stroke diesel engines (approximately 180–250 °C) makes it diffi-cult to hydrolyze urea water for SCR and activate the catalyst. A High-pressure (HP)-SCR, which is installed at the front of the turbocharger of a two-stroke diesel engine, has the advantage of being able to achieve higher temperatures (approximately 300–350 °C); however, it has the disadvantages of having a compli-cated structure and low efficiency due to differential pressure [1].
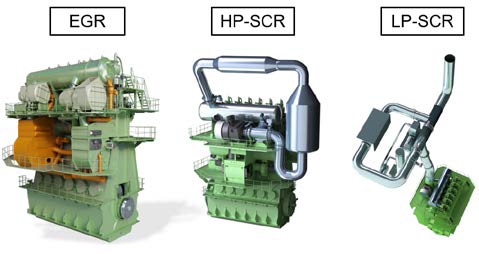
Exhaust gas recirculation (EGR) devices initially dealt with Ti-er II regulations and have emerged as an effective alternative for meeting Tier III regulations for two-stroke cycle diesel engines in response to the disadvantages of SCR devices. MAN Energy Solution has succeeded in commercializing EGR, a NOx-reduction device. Examples of NOx-reduction devices for two-stroke diesel engines that comply with Tier III regulations, in-cluding LP-SCR, HP-SCR, and EGR, are shown in Figure 1.
Due to global warming, abnormal climate phenomena such as rising temperatures and increased frequency of heavy rainfall have been reported worldwide [3]. Accordingly, regulations on greenhouse gases, which are the main cause of global warming, are becoming increasingly stringent. To reduce greenhouse gas emissions from the global maritime industry, the International Maritime Organization (IMO) has established a greenhouse gas reduction strategy and is implementing, reviewing, and revising the initial and mid- to long-term measures [4]. In addition to NOx regulations, interest in particulate matter (PM) is also increasing. The IMO defines soot as black carbon, and official discussions on this topic have been ongoing since 2014 because it was judged that black carbon emitted from ships could accelerate the melting of sea ice [5].
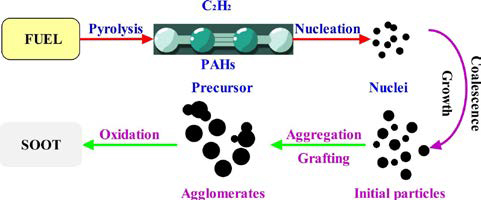
Diesel engines produce various byproducts from the combus-tion of hydrocarbon-based fuels. Figure 2 illustrates the PM formation process generated by the engine. Soot, a type of PM, initially consists of only carbon particles; however, during the exhaust process, it combines with unburned liquid hydrocarbons and sulfur oxides to form lumps.
Additionally, PM can also cause serious damage to the human body. A PM2.5-exposure-related respiratory disease study found that for every 10 μg/m3 increase in PM2.5 exposure, the risk of respiratory problems, including chronic bronchitis and asthma, increased by 18% to 36% [7]. PM generated by ships can be harmful to the human body, as concluded in the PM2.5-exposire study. It has also attracted attention as a risk factor for accelerat-ing global warming.
Therefore, this study aims to analyze and compare the combi-nator mode and high- and low-rpm operating state data during actual background operation based on NOx technical files. In addition, the operation modes of the T/S Bake-kyung main en-gine EGR system include Tier II, ecoEGR (Tier II), and Tier III modes, and the exhaust gas components and performance of the two-stroke diesel engine in Tier II and ecoEGR (Tier II) modes are analyzed and compared.
2. Experimental equipment and methods
2.1 Main Engine and EGR System
Table 1 provides the approximate specifications for the T/S Baek-kyung vessel. The T/S Baek-kyung is a trawl fishing train-ing vessel with a length of 97 m, width of 15.4 m, and gross tonnage of 3,998 tons. The normal continuous rating (NCR) is 15.27 knots. The vessel is equipped with controllable pitch pro-pellers.
Table 2 lists the approximate specifications of the main engine installed on the T/S Baek-kyung. The main engine has a bore of 350 mm, a stroke of 1,550 mm, and a five-cylinder design. It has a rated rotational speed of 167 rpm and a maximum output of 3,475 kW. Additionally, an EGR system is installed as an NOx-reduction device.
The T/S Baek-kyung vessel of Pukyong National University has an EGR system mounted on its main engine. It is worth studying the EGR effect of a two-stroke diesel engine during operation because such data are rare. The T/S Baek-kyung has three operating modes. Among them, it operates mainly in com-binator mode. In this study, we compared the combinator mode and constant-speed modes.
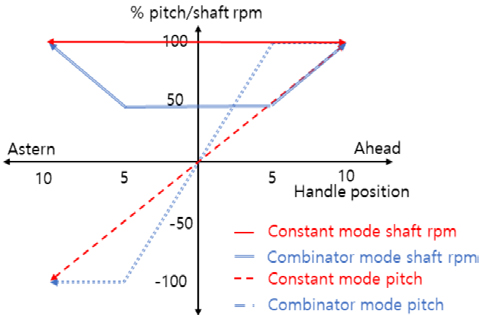
The T/S Baek-kyung is operated in combinator mode, as shown in Figure 3. In fixed-rotation-speed mode, shown in red in the figure, the rotation speed maintains the rated speed regard-less of the load.
The load was controlled by adjusting the pitch according to the handle position. This mode is the E3 mode used when collecting data from the NOx technical files. In combinator mode (shown in blue), 84 rpm is maintained, which is half the rated rotational speed of 167 rpm, up to position 5 of the front and rear handles. The load is then adjusted by manipulating the pitch, and then the pitch is maintained at 100% until the rated rotational speed is reached. This mode is primarily used during sailing.
Data analysis is a process that needs to be carefully handled because the sailing control mode differs from the specified con-trol mode in the NOx technical files. This comparison is crucial for the development of an optimized main engine.
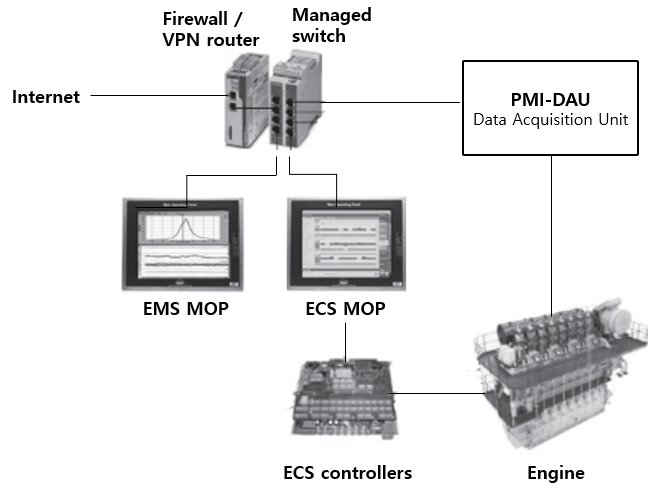
Figure 4 shows an Engine Management System (EMS) de-signed to facilitate engine commissioning and maintenance through the PMI and CoCoS-EDS programs. PMI Autotune performs online cylinder pressure monitoring, fine-tuning of inputs to the closed-loop engine control system, and engine pow-er estimation. The computer-controlled supervisory engine diag-nostic system monitors engine status by recording the data re-ceived from the engine. This device plays an important role in obtaining data required for engine performance experiments.
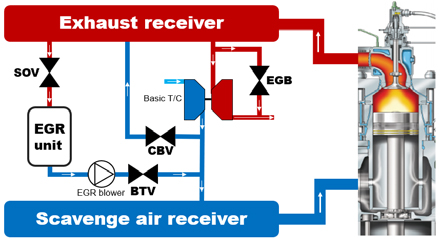
Figure 5 illustrates the concept of an EGR system. The ex-haust gases escaping through the exhaust valve are collected by the exhaust gas receiver. Once the EGR system is in operation, the water recirculation system of the EGR unit is operated, the EGR shut-off valve (SOV) and blower throttle valve (BTV) on the EGR line are opened sequentially, and the EGR blower is started. The exhaust gas flowing into the EGR system is purified and cooled as it passes through the pre-spray and EGR units.
After the purification and cooling process, the exhaust gas is sent to the scavenge receiver, where it is mixed with the scav-enged air generated from the turbocharger and supplied to each cylinder. The EGR supply forms a flow from the exhaust gas receiver to the scavenge air receiver, and eventually, the pro-cessed exhaust gas is supplied via the frequency converter-controlled EGR blower and BTV, depending on the engine's operating conditions, maintaining the EGR system.
The system can operate in two modes (ecoEGR and Tier II) even when the vessel is sailing outside the ECA. In ecoEGR mode, the system typically operates at an EGR rate of 10%–15%. The exhaust gas bypass valve (EGB) is fully open at high loads and partially open at low loads. This configuration reduces NOx emissions and affects fuel consumption.
2.2 Exhaust Gas Measuring Device
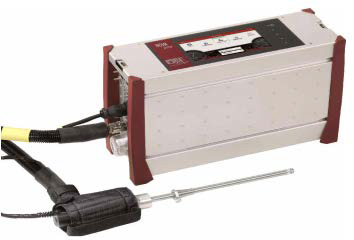
Table 3 lists the specifications of the exhaust gas measurement device used in this study. The CO measurement range is 3.000 ppm, with a resolution of 1 ppm and an accuracy of ±15 ppm. For CO2, the measurement range is 5.00%, with a resolution of 0.01% and an accuracy of ±0.3%. The NOx measurement range is 1,000 ppm, with a resolution of 1 ppm and an accuracy of ±5 ppm. To verify the accuracy of the measurement equipment, a span gas test was conducted and the results are listed in Table 3. The measurements were confirmed to be within the accuracy range, and the experiment was conducted.
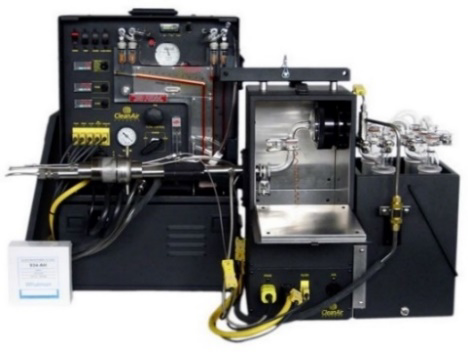
The engine exhaust gas flows through the exhaust pipe to the funnel, and the sample probe with a cylindrical filter inserted is inserted into the sampling hole of the exhaust pipe to collect the exhaust gas particles.
This process is carried out using the vacuum pump of the sampling equipment, and the hot gas is cooled and dried in an impinger; thus, the exhaust gas can be collected continuously.
Selecting a sampling location that avoids points or curves where the exhaust gas flow changes rapidly is important. Con-sidering the sampling stability and reliability, a straight section corresponding to eight times the internal diameter was selected from the starting point of the exhaust gas pipe.
Table 4 lists the specifications of the PM sampler. The maxi-mum suction flow rate is 113 L, the capacity of the dry gas meter is 999.999 ft3, and the power source uses 220 V. Figure 7 shows the EPA-Method 5 PM sampling device, which uses a PM sam-pling device designed according to the air pollutant testing process specified by the U.S. Environmental Protection Agency (EPA). This system is designed to draw gas through an exhaust pipe at a constant speed.
The engine exhaust gas flows through the exhaust pipe to the funnel, and the sample probe with the cylindrical filter is inserted into the sampling hole of the exhaust pipe to collect the exhaust gas particles.
2.3 Experimental Method
Table 5 lists the percentage pitch and shaft rpm conditions for each experimental mode. In the sea trials, the conditions were 25/41.75 at 25% load, 49/81.83 at 49% load, 50/83.5 at 50% load, and 75/125.25 at 75% load. In sea ecoEGR mode, it was 52/86.84 at 52% load. In the shop experiment, the conditions were 25/167 at 25% load, 50/167 at 50%, and 75/167 at 75% load. Measurements were performed 10 min after the experi-mental load was changed. When driving the EGR, data were collected for 10 min during the section where the EGR BTV position was kept constant.
3. Experimental Results and Considerations
3.1 Impact of Driving Mode and EGR on Engine Performance
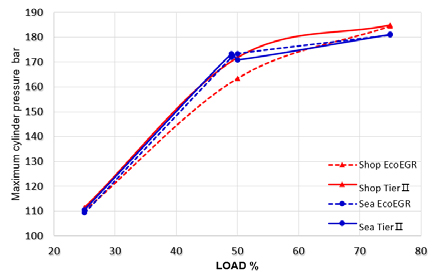
Figures 8-10 show the exhaust gas temperature, maximum combustion chamber pressure, and NOx emissions, respectively, at the exhaust port during the specified operating performance, as described in the NOx technical files, and sailing in combinator mode.
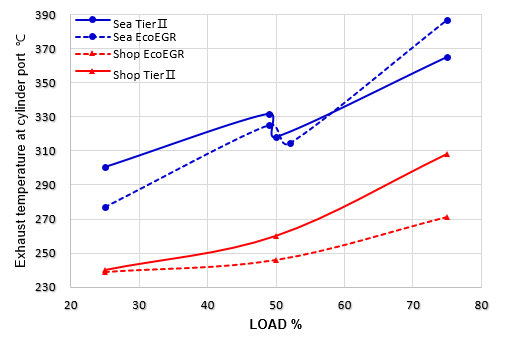
Figure 8 shows the change in exhaust gas temperature accord-ing to the NTF, Tier II, and ecoEGR modes during operation. The solid and dotted lines represent the Tier II and ecoEGR modes, respectively.
The circular and triangular symbols indicate the combinator and constant modes. The exhaust gas temperature increases with increasing load, regardless of the mode. The NTF data indicate that the ecoEGR mode is lower. This is thought to be due to the influence of exhaust gas with a high specific heat. The sailing data varies based on a 50% load. At low loads, the eco-EGR mode exhibits lower temperatures; however, at high loads, the temperatures increase. This is believed to be due to the operation mode described in Section 2.3. In other words, this phenomenon occurs at low loads because, unlike in NTF, the engine speed and propeller pitch are different. However, because the conditions are the same as the NTF at 75% load, further combustion pressure investigations are needed to determine whether the ecoEGR mode exhibits higher temperatures.
Figure 9 shows the maximum combustion chamber pressure change according to the NTF, Tier II, and ecoEGR modes during sailing. The two modes show a rapidly increasing trend from a low load to 50% load, and then show a relatively gradual pres-sure increase from 50% to 75% load. The NTF data show almost the same pressure values at 25% and 75% load and a difference of approximately 10 bar at 50% load. It can be seen that the ecoEGR mode has a significant impact at 50% load compared to low and high loads. The sailing data also change at 50% load. At low and high loads, the ecoEGR mode exhibits lower pressures, such as the Tier II mode but reaches higher pressures at 50% load. A difference of 1.2 bar at 25% load, 1.5 bar at 49% load, and 0.2 bar at 75% load is observed; at 50% load, ecoEGR was 2.6 bar higher than Tier II. This trend is consistent with the fuel index trend. When changing the load from 49% to 50%, a 5% decrease in the fuel index is observed, and it is believed that the maximum pressure in the combustion chamber decreases as a result. Comparing the shop and sea test results, the two modes show similar values at 25% and 75% loads. However, different characteristics are observed at 50% load.
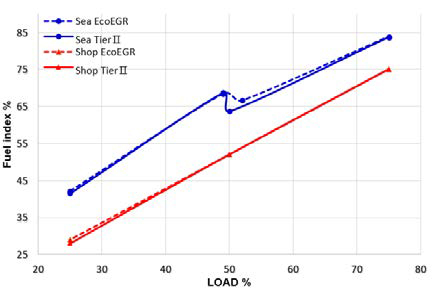
Figure 10 shows the fuel index according to the NTF, Tier II, and ecoEGR modes during sailing. Regardless of the mode, the fuel index increases as the load increases. The NTF data exhibits a 1% difference at 25% load, and are the same at 52% and 75% at 50% and 75% load, respectively. This can be considered to have little effect on ecoEGR. The sailing data decreased by 5% when the load increased from 49% to 50% in Tier II at 50% load and decreased by 1.81% when the load changed from 49% to 52% in ecoEGR.
Comparing the shop and sea test results, in Tier II mode, the difference is 13.5% at 25% load, 16.68% at 50% load, and 8.72% at 75% load. In ecoEGR mode, the difference is 13.19% at 25% load, 16.42% at 50% load, and 8.83% at 75% load. Based on these results, it is believed that the fixed rotational speed mode provides a better fuel efficiency under low-to-medium loads than the combinator mode. The reason for the difference in the average values of the shop and sea test results is that the engine used in the shop test was the same as that used in the sea test; however, the detailed specifications were different.
3.2 Effect of Driving Mode and EGR on Emission Performance
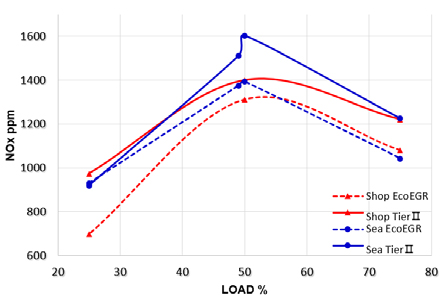
Figure 11 shows the NOx emissions according to the NTF, Tier II, and ecoEGR modes during sailing. In both test modes, the NOx generation increases from 25% to 50% load and de-creases from 50% to 75% load.
The NTF data show a difference of 276 ppm at 25% load, 89 ppm at 50% load, and 141 ppm at 75% load. This can be seen as a decrease in NOx emissions owing to the EGR effect. The dat shows that ecoEGR is 10 ppm higher at a 25% NOx load, 136 ppm lower at a 49% load, 210 ppm lower at a 50% load, and 183 ppm lower at a 75% load. In Tier II mode, the NOx increases by 92 ppm when the load increases from 49% to 50%. This can be seen as a change in shaft rpm from 50% load, which has a posi-tive effect on combustion. Comparing the shop and sea test re-sults, operating in fixed-speed mode at low load is advantageous in terms of NOx emissions reduction, whereas operating in com-binator mode at medium load or higher is effective for NOx emissions reduction.
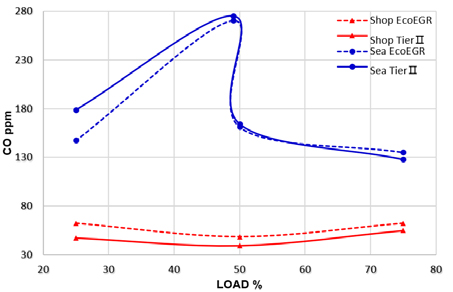
Figure 12 shows the CO production according to the NTF, Tier II, and ecoEGR modes during sailing. The NTF data show lower Tier II mode values at full load. A difference of 15.2 ppm at 25% load, 9 ppm at 50% load, and 7.7 ppm at 75% load is observed. This can be explained by the fact that fuel combustion does not occur as easily as in Tier II because low exhaust gas temperatures are generated under ecoEGR operation. The CO emissions are low when EGR is operated from low to medium load, and after 50% load, the CO emissions are lower; however, they are still higher than those of Tier II. The difference was 31.32 ppm at 25% load, 3.12 ppm at 50% load, and 7.41 ppm at 75% load. The CO emissions are determined by the production rate and oxidation [11]. Therefore, to determine the amount of CO produced by ecoEGR, it is necessary to investigate the tem-perature of the combustion area and the conversion of recycled CO2.
Comparing the shop and sea test results, the CO generation rate in the low-load area was found to increase rapidly as the load increased under combinator mode and decreases rapidly at 50% load, with stable CO emissions are observed toward the high-load area. Comparing the CO emissions at 75% load, the shop test results show that CO emissions increase from a medium load, whereas the sea test results decrease.
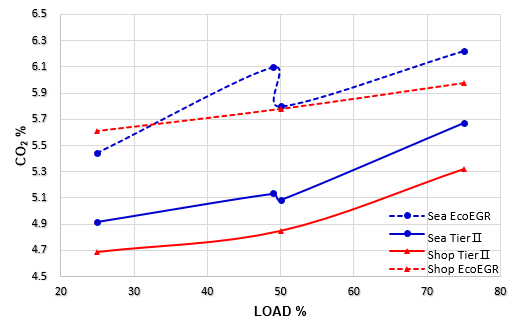
Figure 13 shows the amount of CO2 according to the NTF, Tier II, and ecoEGR modes during operation. Regardless of the mode, the CO2 emissions are high under ecoEGR operation. Additionally, as the load increases, CO2 emissions also increase. The CO2 emissions and growth rate increase as the load increases because the amount of fuel supplied and the maximum combus-tion pressure increase.
The NTF data exhibit differences of 0.92% at 25% load, 0.93% at 50% load, and 0.66% at 75% load. It can be seen that when ecoEGR is at 75% load, the impact on CO2 production is less compared to that for low and medium loads.
The sailing data exhibit differences of 0.53% at 25% load, 0.97% at 49% load, 0.71% at 50% load, and 0.55% at 75% load. These results show that ecoEGR during operation has the greatest im-pact on CO2 production at 49% load, and that there is a signifi-cant change in CO2 production from 50% load when the shaft rpm and pitch begin to increase simultaneously. By comparing the shop and sea test results, it can be seen that the effect on CO2 production in the section where the sea test increases from 49% to 50% load is significant when operating in ecoEGR mode. Thus, it is believed that the exhaust gas dilution effect of the EGR is significant until just before the 50% load.
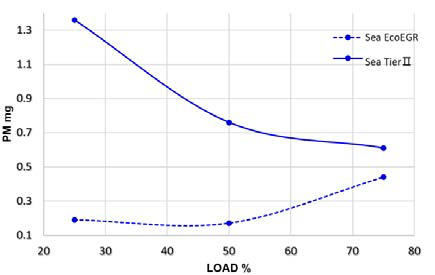
Figure 14 shows the PM emissions according to mode during operation. The ecoEGR mode exhibit lower PM emissions at all loads than the Tier II mode. The two modes exhibit significant differences in their tendencies from medium to high loads. For ecoEGR mode, the PM emissions were 0.19 mg at 25% load, 0.17 mg at 50% load, and 0.44 mg at 75% load. It is believed that the rapid increase in the amount of PM at high loads is due to the decrease in the oxygen ratio in the intake air as the EGR rate increases, contributing to PM generation. The Tier II mode yield-ed 1.36 mg at 25% load, 0.76 mg at 50% load, and 0.61 mg at 75% load. This can be explained by the fact that as the load increases, the combustion state becomes stable and the amount of unburned material decreases. Comparing the two modes, it can be seen that the ecoEGR mode does not have a significant effect on reducing the PM generation from EGR at loads above 50%.
4. Conclusion
By comparing the shop and sea test results from a fuel effi-ciency perspective, it is believed that the constant-speed mode is advantageous for low to medium load ranges. In terms of NOx reduction, it is advantageous to operate under constant-speed mode at low loads, while operating under combinator mode at medium or higher loads is effective for NOx emissions reduction. To determine the amount of CO produced by ecoEGR, it is nec-essary to investigate the temperature of the combustion area and the conversion of recycled CO2. The ecoEGR mode was found to generate lower PM emissions at all loads compared to the Tier II mode; however, it does not have a significant effect on reducing PM generation by EGR from loads above 50%.
Nomenclature
| NOx : | nitrogen oxides |
| ECAs : | emission control areas |
| SCR : | selective catalytic reduction |
| EGR : | exhaust gas recirculation |
| NCR : | normal continuous rating |
| SOV : | EGR shut-off valve |
| CBV : | cylinder bypass valve |
| BTV : | blower throttle valve |
| EGB : | exhaust gas bypass valve |
| EMS : | engine management system |
| CoCoS-EDS : | computer controlled supervisory engine diagnostic system |
| NTF : | NOx technical files |
| MLD : | moulded |
Acknowledgments
This research was supported by the Korea Institute of Marine Science and Technology Promotion (KIMST), funded by the Ministry of Oceans and Fisheries, Korea (20220568).
Author Contributions
Conceptualization, Methodology, T. Jeong; Software, Formal Analysis, J. -S. Moon; Investigation, Resources, S. Hwang; Data Curation, Writing-Original Draft Preparation, M. -A Je; Writing-Review & Editing, Visualization, Supervision, S. -H. Jung; Project Administration, J. -S. Moon.
References
- J. M. Won and S. C. Hong, Selective Catalytic Reduction (SCR) Technology Trend for the Removal of Nitrogen Oxide from Ship Flue Gas, KIC News, vol. 22, no. 5, 2019 (in Korean).
- MAN Energy Solution, Innovative Utilisation of Emission Technologies, Niels Kjemtrup Process Development 21 May KYOTO, 2019.
-
M. R. Allen, et al., Summary for Policymakers, “SPECIAL REPORT: Understanding Global Warming of 1.5°C,” p. 7, 2022. Available: https://www.ipcc.ch/site/assets/uploads/sites/2/2022/06/SPM_version_report_LR.pdf, .
[https://doi.org/10.1017/9781009157940.001]

- K. Aabo, IMO Tier Ⅲ strategies under the light of changes in the oil market, CIMAC Circle at SMM, 2016.
- IMO International Maritime Policy Trends May 2023, vol. 99 (Reference: ISWG-GHG15/2/3), IMO PPR 1: Sub-Committee on Pollution Prevention and Response 1st Session, 2014.
-
Z. Yin, S. Liu, D. Tan, Z. Zhang, Z. Wang, and B. Wang, “A review of the development and application of soot modelling for modern diesel engines and the soot modelling for different fuels,” Process Safety and Environmental Protec-tion, vol. 178, pp. 836-859, 2023.
[https://doi.org/10.1016/j.psep.2023.08.075]

-
C. A. Pope, et al., “Particulate air pollution as a predictor of mortality in a prospective study of U.S. adults, American Journal of Respiratory and Critical Care Medicine, vol. 151, no. 3, pp. 669-674, 1995.
[https://doi.org/10.1164/ajrccm.151.3.7881654]

-
J. S. Moon, M. Je, and S. -H. Jung, “Effect of EGR on performance of two-stroke cycle diesel engine on sailing,” Journal of Power System Engineering, vol. 27, no. 5, pp. 43-49, 2023.
[https://doi.org/10.9726/kspse.2023.27.5.043]

- MAN B&W S35ME-B9.5-TII Project Guide Electronically Controlled Two-stroke Engines with Camshaft Controlled Exhaust Valves. Available: https://www.manualslib.com/manual/1572750/Man-BAndw-S50me-B9-3-Tii.html, , Page 1 of 2 Edition 1.0 July 2018.
- Emission project guide, MAN B&W Two-stroke marine engines. Available: https://pdfslide.net/documents/emission-project-guide-marine-engines-systems-diesel-turbo-emission-project-guide.html?page=1, .
-
Z. Chen, Z. Wu, J. Liu, and C. Lee, “Combustion and emissions characteristics of high n-butanol/diesel ratio blend in a heavy-duty diesel engine and EGR impact,” Energy Conversion and Management, vol. 78, pp. 787-795, 2014.
[https://doi.org/10.1016/j.enconman.2013.11.037]


