Enhancing fault ride through capability via diesel generator control in dynamic positioning vessels
Copyright © The Korean Society of Marine Engineering
This is an Open Access article distributed under the terms of the Creative Commons Attribution Non-Commercial License (http://creativecommons.org/licenses/by-nc/3.0), which permits unrestricted non-commercial use, distribution, and reproduction in any medium, provided the original work is properly cited.
Abstract
The current trend in dynamic positioning vessels involves using closed-bus tie systems, which aim to be more efficient by using fewer generators. However, this new setup brings challenges due to the potential for a single fault to disrupt the entire power systems. To address these challenges, the paper presents a strategy to control diesel generators and meet strict requirements for handling faults. Using extensive factory test data, simulation models are developed for individual governor and exciter systems. These models have an error margin of about 2.1%, showing their good alignment with real-world situations. With these simulation models, a thorough analysis of system stability is conducted. This analysis checks if the governor and automatic voltage regulator settings, validated by factory tests, can restore the system to normal operation. The investigation reveals that the frequency response remains stable even with short-circuit faults. However, the voltage response does not meet the ship's requirements. The paper investigates the reason behind this voltage problem due to an excessive integral controller gain value and implements changes to rectify it by adjusting controller parameters. By explaining the critical aspects of the voltage issue, the paper contributes to our understanding of strengthening closed-bus tie systems on dynamic positioning ships. The findings emphasize the importance of careful generator control to maintain a reliable power system, especially during faults.
Keywords:
Dynamic positioning vessels, Exciter systems, Fault ride through, Governor systems, Synchronous generator1. Introduction
Dynamic positioning (DP) vessels are generally used for transporting offshore oil and gas. These specialized ships use dynamically controlled thrusters to maintain position and heading, enabling tasks like offshore wind turbine installation and oil transport [1]. However, losing position-keeping ability by electrical blackout can have catastrophic consequences like personal injury, environmental pollution, or vessel damage [2]-[4].
To ensure reliability, DP vessels have traditionally used open bus ties, providing redundancy in the power system as shown in Figure 1(a). If one bus fails, the vessel can still operate on the remaining two buses [5],[6]. However, this approach requires more generators and can result in lower efficiency due to lighter load conditions. A recent trend is the closed-bus tie system during DP operation (see Figure 1(b)), which allows for fewer generators and higher efficiency [7],[8]. Nevertheless, this system presents challenges in terms of system protection and restoration due to the impact of a single fault on the entire power system [9].
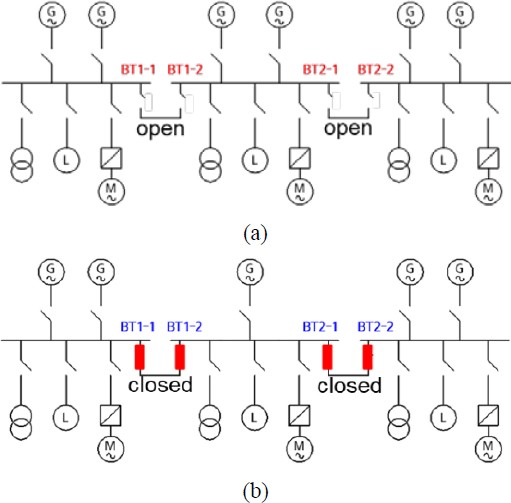
Bus configurations of DP vessels: (a) operating with open bus ties and (b) operating with closed bus ties
There are three technical challenges in the closed-bus tie systems. Firstly, when a fault occurs, it is important to quickly separate the healthy parts from the fault, requiring intelligent protection. Secondly, the generator systems in the healthy parts need to restore normal system frequency and voltage [10],[11]. This is the primary focus on this study. Lastly, the critical devices, particularly the thruster systems, must remain connected until the generator systems stabilize, requiring fault-ride through capability.
In [12] and [13], the occurrence of accidents in actual ship power systems is described, outlining the recovery capabilities of the generation system following accident removal. However, these systems pertain to DC ships and employ high-speed breakers using solid-state technologies. The investigation presented in [14] and [15] offers a comprehensive review of existing testing methodologies. It delves into the reasons behind conducting fault ride-through testing, explores diverse testing approaches to showcase fault ride-through capability in closed bus operation, and suggests a set of testing practices for consideration. Notably, it does not specifically cover aspects related to generator control. A study in [16] explored dynamic positioning system effects on vessel electrical systems, emphasizing transient interferences. Laboratory experiments show that the generator thruster stabilizes at 50% loading but experiences instability at 60%, suggesting potential improvement with capacitors. Notably, the study does not delve into aspects related to generator control despite the improvement in response characteristics achieved using capacitors.
To address the challenge regarding to the restoration of normal system frequency and voltage in the healthy parts, the paper presents a strategy to control diesel generators. Using extensive factory test data, simulation models are developed for individual governor and exciter systems. With these simulation models, a thorough analysis of system stability is conducted to meet strict ship regulations on DP vessels.
The structure of the paper unfolds as follows. Sections 2 and 3 present a fault-tolerant strategy for diesel generator control, introducing simulation models for governors and exciters. These models, validated with factory test data, demonstrate a 2.1% error margin. Section 4 conducts a transient stability study, revealing stable frequency but insufficient voltage during short-circuit faults. In this section, implemented changes effectively address the voltage issue, contributing to the improvement of closed-bus tie systems. The conclusion in Section 5 underscores the significance of precise generator control for maintaining a stable power system, particularly in fault scenarios.
2. Modeling of Governor Systems
The time constant of excitation systems is significantly shorter than that of the prime mover. Its rapid decline during transients does not impact the governor control. As a result, the interaction between the exciter and governor controls can be considered minimal [17]. Consequently, separate simulation models are created for frequency and voltage controls. This section outlines the process of modeling the governor systems.
2.1 UG-25+ Governor
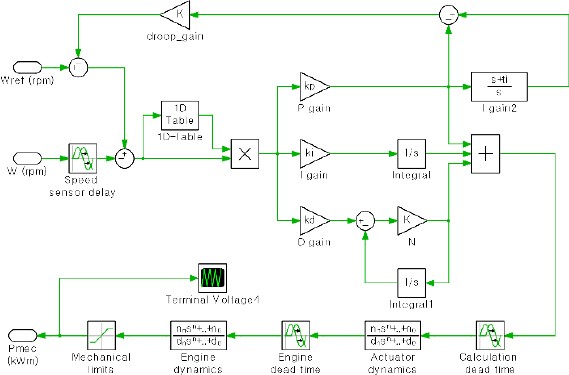
A governor is responsible for regulating the quantity of fuel injected into a mechanical engine to manage its rotational speed. One of the most commonly employed governors in diesel engines is the UG-25+ governor, produced by Woodward [18]. The transfer function of this UG-25+ governor is illustrated in Figure 2 and comprises six distinct components: speed demand, speed sensing (engine speed) with associated sensing dead time, a comparator, droop, a PID (proportional-integral-derivative) controller with control dead time, and actuator dynamics. In cases where there exists a deviation in speed between the desired speed and the sensed speed, the governor adjusts the fuel flow to minimize this deviation.
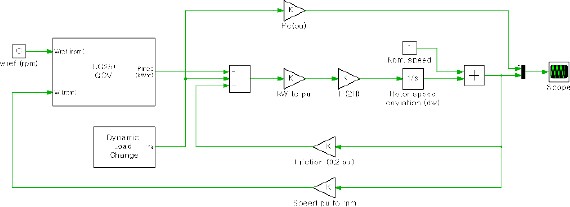
Variations in fuel flow directly impact the mechanical power of the diesel engine, characterized by its time constant. Consequently, the simulation model for the engine-governor systems, developed within this study, encompasses engine dynamics and dead time, as illustrated in Figure 3. Note that the simulation model relies on PLECS and the specific parameters used in this model are not provided due to a non-disclosure agreement with the engine manufacturer.
2.2 Frequency Control Performance
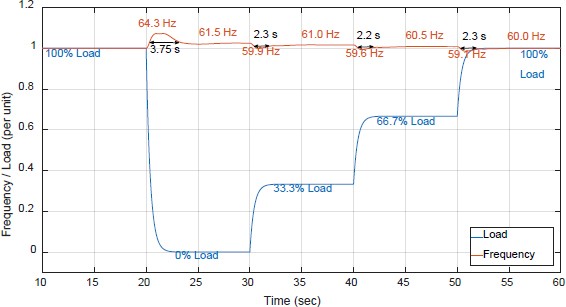
According to [19], it is crucial to maintain the frequency variation within a ±10% margin of the rated frequency during transient load conditions. In order to assess the effectiveness of frequency control, engine manufacturers have undertaken a series of load change tests. These tests include a variety of load scenarios, ranging from transitioning between 100% to 0% load, progressively adding load in thirds, and ultimately applying a full load.
In cases where an imbalance exists between electric power consumption and mechanical power generation, this imbalance leads to either acceleration or deceleration of the system. The combined inertia constant of generator-engine systems, denoted as "H", serves as a pivotal factor in resisting changes in system frequency, which is described by the swing equation as outlined in [20].
| (1) |
where, Δωpu is the deviation of revolutions per minute in per unit. pm_pu is the mechanical power in per unit. Pe_pu is the electric power in per unit. And t is the time in seconds.
The dynamic load change, designed to simulate load change tests, is integrated with the engine-governor systems, as illustrated in Figure 4. The mechanical power generated is then subtracted by the consumed electric power (depicted as the dynamic load change block in Fig. 4), along with frictional losses. This resultant imbalance is then applied to the system's inertia, resulting in changes in speed.
Figure 5 presents the dynamic performance of the engine-governor systems. In Fig. 5, the maximum frequency variation reaches 64.3 Hz (107.2%) when the full load is disconnected at 20 s. This observation suggests that the engine-governor systems effectively maintain system frequency within the acceptable limits (±10%). Furthermore, during steady-state conditions, the frequencies are actively regulated through the implementation of droop control, which adjusts in response to changes in the loading rate.
The dynamic performance of the simulation model described above has been compared to the load change tests conducted at engine testing facilities, with a summary of the results provided in Table 1. During the full load disconnection scenario (100% load out in Table 1), the maximum deviation observed is 0.8 Hz, corresponding to an error rate of 2.0%. Additionally, when analyzing the longest recovery time required for the system frequency to stabilize, there is a minor deviation of 0.6 s under the condition of a 33% load addition at 30 s in Figure 5. These performance comparisons confirm that the simulation model developed in this study serves as a reasonably accurate representation of real-world engine-governor systems.
3. Modeling of Excitation Systems
Excitation systems are closely linked to generator systems, serving as an integral component. In this study, the simulation model for excitation systems is merged with that of the synchronous machine. The generator under examination features these essential specifications: capacity – 1,825 kVA, voltage rating – 6,600 V, and operating frequency – 60 Hz.
3.1 HDEC 2000 AVR
Excitation systems are vital for generating electrical power as they create the essential magnetic field within the generator's rotor. These systems comprise critical components such as the exciter— a compact generator or alternator directly linked to the main generator shaft—and an automatic voltage regulator (AVR). The AVR plays a pivotal role in continuously adjusting the excitation current to uphold a consistent voltage level.
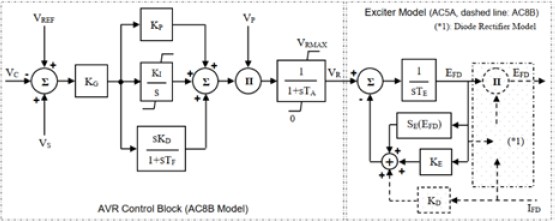
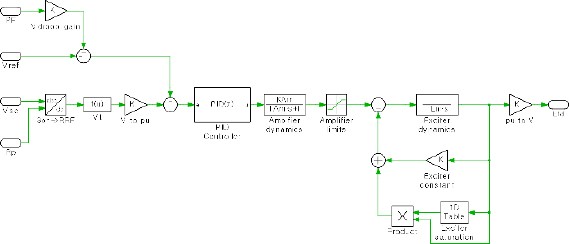
In this study, the HDEC 2000 AVR produced by HD Hyundai Electric is employed. This AVR is based on the AC8B model and is specifically applied to simplified brushless excitation systems (the AC5A) [21], as illustrated in Figure 6. The AVR controller comprises a PID controller, voltage regulator gain (KG) with associated time constant (TA), and voltage regulator output limits (VRMIN and VRMAX). Moreover, the exciter model includes parameters such as exciter gain (KE) and time constant (TE), saturation values (SEMAX and SE.75), and maximum exciter output voltage (EFDMAX). For a visual representation of the simulation model for the excitation systems developed in this study (see Figure 7). Additionally, a summary of these parameters can be found in Table 2.
3.2 Voltage Control Performance
As outlined in [19], it is imperative for marine applications to adhere to stringent voltage fluctuation criteria, which are specified as follows:
- - Under steady-state conditions, voltage variations should be limited to within ±2.5% of the nominal AC system voltage.
- - During transient states, voltage fluctuations are permissible within the range of -15% to +20% of the nominal AC voltage.
Furthermore, following the initiation of a transient event, the generator's voltage must be swiftly restored to within ±3% of the rated voltage, accomplishing this task within a 1.5 s.
To evaluate the performance of voltage control measures, generator manufacturers have undertaken a series of sudden load change tests. In these tests, a generator, operating at no load and nominal voltage, is subjected to a sudden load that is switched on and subsequently switched off. The magnitude of this sudden load is set at 60% of the rated current, featuring a power factor ranging from 0.4 lagging to zero [19].
To simulate these voltage control tests effectively, the sudden load change is integrated into the complete engine-generator system, as depicted in Figure 8. This integration involves the activation and deactivation of an inductive load by means of a specially designed inductive machine. This rapid change in load conditions induces voltage variations that are closely monitored and analyzed.
The voltage control performance of the simulation model described above is compared to the sudden load change tests conducted at generator testing facilities, with a summary of the results provided in Figure 9 and Table 3. Note that voltage variations are calculated as follows:
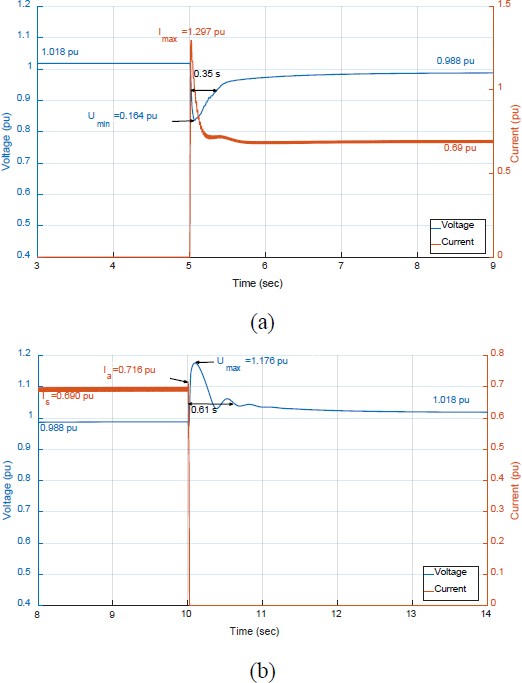
Dynamic performance of the excitation systems under the sudden load change tests: (a) inductive load connection and (b) inductive load disconnection
| (2) |
where, Umin is the voltage drop during the test. Imax is the maximum current during the test. And Xe is the impedance of the inductive load.
| (3) |
where, Umax is the maximum voltage during the test. Is is the inductive load current. And Ia is the transient current during the test.
As previously detailed, to simulate real-world testing conditions, the model incorporates a specially designed induction machine. During motor startup, this machine consumes 1.297 pu, and in steady-state, it draws 0.69 pu of current, as depicted in Figure 9(a). Upon connecting the inductive load, a voltage drop of 0.164 pu is observed. This drop primarily results from the initial inrush current of 1.297 pu and requires recalculation using Equation (2). Consequently, the actual voltage drop amounts to approximately 8%. When the load is disconnected, an instantaneous voltage rise occurs, well within the permissible limit of +20%. The maximum observed deviation is 2.4% in voltage (equivalent to 158.4 V in a 6,600 V system), representing an error rate of 2.1% (see Table 3). This demonstrates that the simulation model developed in this study delivers a high degree of accuracy in replicating the behavior of excitation systems in conjunction with the synchronous generator.
4. Transient Stability Study
As mentioned in the introduction section, the generator systems in the healthy parts need to restore normal system frequency and voltage after the fault clearing. By using the validated simulation model for the complete engine-generator systems, transient stability is analyzed with the PID parameter tuning.
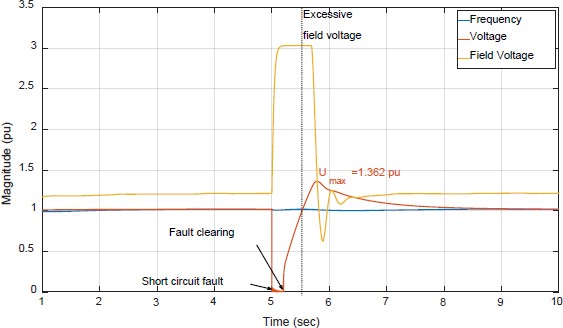
When a fault occurs in the onboard networks, it can be cleared within 200 ms by means of intelligent protection systems [23]. Therefore, a three-phase bolted fault is applied to the simulation model and it is cleared in 200 ms after the fault. The waveforms of frequency, voltage, and field voltage are depicted in Figure 10. The frequency response presents minimal fluctuations despite the occurrence of the bolted fault. The voltage profile explains this observation, as the voltage nearly reaches zero, indicating that the power required from the generator is relatively low, given that power is the product of current and voltage.
However, voltage presents a significant concern. The AVR parameters established during the factory test fail to meet the voltage requirement, as illustrated by the red line in Figure 10. This discrepancy arises because the parameters did not account for this extended fault duration. During the fault, the error between the reference voltage and the terminal voltage becomes very high, accumulating within the integral controller. Although the system voltage eventually returns to 1 pu, there remains integral controller action leads to an overvoltage issue in this specific scenario.
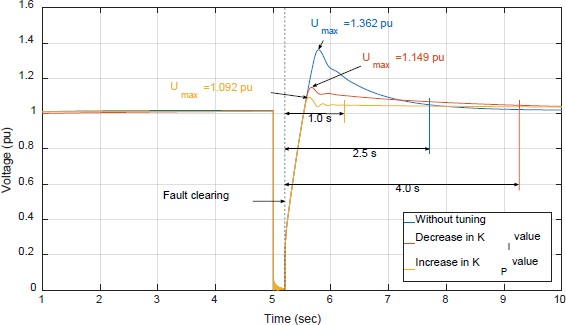
As the error accumulation in the integral controller is the primary cause of the overvoltage issue (1.362 pu) depicted in Figure 11, the integral controller gain (KI) is decreased from 9.7 to 2.9. The dynamic performance with these parameters is illustrated by the red line in Figure 11. Clearly, this reduction in KI significantly mitigates the overvoltage problem, bringing it within compliance with the prescribed voltage variation limits. However, it's worth noting that the time required for the system to recover to within ±3% of the rated voltage has significantly increased. To address this extended recovery time, the proportional gain (KP) is increased from 8.2 to 24.6. The results demonstrate that these parameter adjustments enable compliance with both limits while maintaining safe margins, as summarized in Table 4.
5. Conclusion
This paper has introduced a robust strategy for controlling diesel generators, meticulously designed to comply with stringent fault-handling requirements for adopting closed-bus tie systems in dynamic positioning vessels to enhance efficiency with fewer generators. The comprehensive strategy presented for controlling diesel generators addresses challenges associated with potential single faults that could disrupt the entire power system. The developed simulation models for individual governor and exciter systems, aligned with real-world scenarios with an error margin of approximately 2.1%, contribute to the overall understanding of system stability. The analysis conducted has demonstrated that, even in the presence of short-circuit faults, the frequency response of the system remains steadfast. However, it has become evident that the voltage response does not align with the ship's requirements, despite the verification of voltage control performance through factory testing. To rectify this voltage discrepancy and bring the system voltage within the prescribed limits, a meticulous adjustment of PID parameters within the AVR is imperative. Specifically, a reduction in the integral gain is necessary, while an increase in the proportional gain is equally vital.
Author Contributions
Conceptualization, Methodology, Validation, Resources, Writing— Original Draft Preparation, Visualization, S. Kim; Formal Analysis, Investigation, Writing—Review & Editing, B. C. Sung and D. S. Lee.
References
- H. Fay, Dynamic Positioning Systems, USA: Technip, 1990.
- US Coast Guard, Recent Failures of Dynamic Positioning (DP) Systems on Mobile Offshore Drilling Units, 2013.
- Dynamic positioning (DP) vessel blackout, https://www.imca-int.com/safety-events/dynamic-positioning-dp-vessel-blackout/, , Accessed September 1, 2023.
- Vessel rotation leads to loss of position – DP incident, https://www.imca-int.com/dp-events/vessel-rotation-leads-to-loss-of-position-dp-incident/, , Accessed September 1, 2023.
- ABS, Guide for Dynamic Positioning Systems, DPS Guide, 2013.
- DNV, Dynamic Positioning Vessel Design Philosophy Guidelines, DNV-RP-E306, 2012.
- ABB, Generations: Safety and availability, 2013.
-
S. Kim, Protection Coordination in Marine DC Power Distribution Networks, Ph. D. Dissertation, Institute of Electrical and Micro Engineering, EPFL, Switzerland, 2020.
[https://doi.org/10.1109/ACCESS.2020.3043515]

- Marine Technology Society, A Method for Proving the Fault Ride-Through Capability of DP Vessels with HV Power Plant, TECHOP (D-07 – Rev1 – Jan21), 2021.
-
H. -M. Kim, H. Jeon, K. Yoon, and J. -S. Kim, “Study on the simulation of the dynamic characteristics of a marine diesel generator,” Journal of Advanced Marine Engineering and Technology (JAMET), vol. 45, no. 6, pp. 392-397, 2021.
[https://doi.org/10.5916/jamet.2021.45.6.392]

-
Y. -C. Lee and B. -G. Jung, “Improved transient characteristics of output voltage of marine synchronous generator,” Advanced Marine Engineering and Technology (JAMET), vol. 42, no. 2, pp. 114-120, 2018.
[https://doi.org/10.5916/jkosme.2018.42.2.114]

- S. O. Settemsdal, L. Barstad, and K. Tjong, “Fault ride-through testing of a LV power solution bluedrive plusC,” Proceeding of Dynamic Positioning Conference, pp. 1-15, 2016.
-
S. Kim, G. Ulissi, S. -N. Kim, and D. Dujic, “Protection coordination for reliable marine DC power distribution networks,” IEEE Access, vol. 8, pp. 222813-222823, 2020.
[https://doi.org/10.1109/ACCESS.2020.3043515]

-
M. Roa, “Demonstration of fault ride through capability for closed bus operation on dynamic positioning vessels,” 2016 Petroleum and Chemical Industry Technical Conference (PCIC), pp. 1-10, 2016.
[https://doi.org/10.1109/PCICON.2016.7589234]

-
M. Roa, “Alternative Approaches for Demonstration of Fault Ride-through Capabilities on DP Vessels with Closed Bus Operation,” Proceeding of Dynamic Positioning Conference, 2016, pp. 1-8.
[https://doi.org/10.1109/PCICON.2016.7589234]

-
S. Sarwito, E. S. Koenhardono, A. A. Masroeri, I. R. Kusuma, and M. N. Ichwan, “Transient voltage analysis for dynamic positioning closed bus electrical system on ship in laboratory scale” International Journal of Marine Engineering Innovation and Research, vol. 4, no. 3, pp. 208-215, 2019.
[https://doi.org/10.12962/j25481479.v4i3.5608]

- H. Saadat, Power System Analysis, New York, USA: McGraw-Hill, 1999.
- UG-25+ Governor – Installation and Operation Manual, Product Manual 26579, Woodward, USA, 2013.
- DNV GL, Rules for Classification: Ships – Part 4 Systems and components, Chapter 8 Electrical installations, DNVGL-RU-SHIP-Pt4Ch8, 2016.
- P. Kundur, Power System Stability and Control, New York, USA: McGraw-Hill, 1994.
- Digital Excitation Systems – HDEC 2000 User’s Manual Rev. H, HD Hyundai Electric, South Korea, 2020.
- IEEE, IEEE Recommended Practice for Excitation System Models for Power System Stability Studies,” IEEE Std 421.5-2016, 2016.
- J. Kim, S. Kim, J. Heo, and D. Lee, “Intelligent Protection Scheme for Dynamic Positioning Vessels with Closed Bus-Tie Operation,” The International Conference on Electrical Engineering 2022 (ICEE 2022), 2022.


