Numerical validation of a hydrogen leakage and dispersion experiment considering ship kinetic characteristics
Copyright © The Korean Society of Marine Engineering
This is an Open Access article distributed under the terms of the Creative Commons Attribution Non-Commercial License (http://creativecommons.org/licenses/by-nc/3.0), which permits unrestricted non-commercial use, distribution, and reproduction in any medium, provided the original work is properly cited.
Abstract
Hydrogen leaks in enclosed areas, such as hydrogen fuel storage rooms, can lead to fire and explosion accidents. Recognizing these potential hazards, the Ministry of Oceans and Fisheries introduced the "Provisional Standards for Hydrogen Fuel Cell Facilities on Ships,” which requires the number and location of gas detectors inside the fuel cell area of a ship to be determined through computer analysis or physical diffusion tests. However, the application of hydrogen leakage tests in actual ships has economic and safety limitations. Moreover, previous studies have faced challenges in validating numerical simulations that consider ship motion. Therefore, this study aims to develop and validate a computational fluid dynamics (CFD) model based on previous experiments regarding the effects of ship motion on hydrogen dispersion. After comparing the experimental and numerical results for all scenarios, the hydrogen concentration predictions were found to be similar, with a difference within 15%. The significance of this study lies in offering a more practical and economical method for determining the optimal location of hydrogen gas detectors in a real ship environment.
Keywords:
Hydrogen leakage, Hydrogen fuel storage room, Computational fluid dynamics (CFD), Validation1. Introduction
The International Maritime Organization, through the 80th Marine Environment Protection Committee, has recently raised the carbon emission goals of the international shipping sector from 50% to 100% of the 2008 target by 2050, effectively aiming net-zero carbon emissions [1].With the strengthening of international environmental regulations, the need for environmentally friendly alternative fuels has become increasingly important. Accordingly, hydrogen, with its environmentally friendly characteristics and high energy efficiency, is attracting attention as an alternative marine fuel to achieve low-carbon transportation [2][3].
According to multiple-criteria decision analysis, fossil fuels and electric hydrogen are deemed superior to other alternative fuels such as methanol, ethanol, and liquid natural gas (LNG) in terms of durability, compatibility with existing infrastructure, and adaptability to existing ships [4]. However, from a safety perspective, hydrogen has the following characteristics compared to other alternative marine fuels: First, the minimum ignition energy of gaseous hydrogen in air is 0.02 mJ, which is quite low compared to that of LNG (0.29mJ). Additionally, hydrogen forms a flammable gas over a wide concentration range (4%–75%) when mixed with air or oxygen, which is approximately five times wider than that of LNG (5.3–15%) [5][6].
Owing to the unique properties of hydrogen, unique precautions are required to ensure its safe use aboard ships. If hydrogen leaks from a ship's hydrogen fuel cell facility, it is important to prevent potential accidents through rapid detection [7][8]. Thus far, the Ministry of Oceans and Fisheries has established the "Provisional Standards for Hydrogen Fuel Cell Facilities on Ships,” which state that the determination of the number and placement of gas detectors in the fuel cell area of ships should be based on computer analysis or physical diffusion tests, considering the size, shape, and ventilation of the area [9].
However, considering the size of an actual ship and its complex environmental characteristics, there are limitations in terms of economic feasibility and safety in handling hydrogen and performing tests. Consequently, there is a lack of experimental data on hydrogen leakage applicable to ships. Most hydrogen experiments, where computational fluid dynamics (CFD) models are currently validated, do not consider motion and are limited to small-scale experiments in simple enclosed geometries. In addition, although numerical simulation studies have been conducted for the direct comparison of ship stationary and kinetic states in previous studies, obtaining a numerical simulation verification of experiments that reflects ship motion conditions proves challenging [10].
Therefore, it is necessary to build and validate a numerical hydrogen diffusion model for determining the optimal locations of hydrogen gas detectors in a ship environment. Therefore, to solve these problems, this study aimed to develop a CFD model based on experiments investigating the effect of ship motion on hydrogen dispersion, as conducted in a previous study [11]. The objective was to validate the experimental results and ensure the reliability of the analytical results.
2. Description of the Experiment
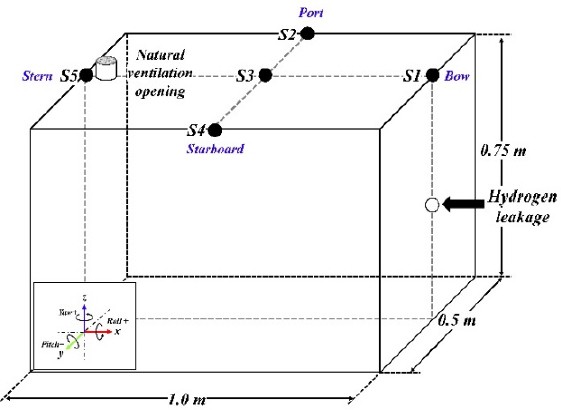
The main experimental system consisted of a device for hydrogen leakage and diffusion experiments and a simulator to implement ship motion. The hydrogen-leak space was rectangular in size: 1.0 m long × 0.5 m wide × 0.75 m high. The experimental space was equipped with natural ventilation to maintain a constant hydrogen concentration. Hydrogen gas was injected horizontally at a pressure of 14 bar and a flow rate of 0.965×10⁻⁵ kg/s. Additionally, the type (roll and pitch motions) and direction of movement (clockwise or counterclockwise) were implemented using a ship simulator. The exercise period was 58 s, and the maximum inclination angle was 10°. A schematic of the experimental setup and sensor position for measuring the hydrogen concentration is shown in Figure 1. The experimental scenarios are presented in Table 1.
The experimental procedure was divided into two parts: the initial concentration setting and concentration measurement experiments in the stationary and kinetic states.
Initial concentration settings were performed according to the following sequence:
- 1) Sensor monitoring was performed to adjust the zero point of the sensors inside the chamber with natural ventilation.
- 2) Hydrogen gas was injected, and a constant hydrogen concentration was maintained in the test chamber by manual rotary opening and closing of the natural vent.
- 3) Once the hydrogen concentration in the test chamber was confirmed to be homogeneous, the initial concentration setting was terminated.
After the initial concentration was set, hydrogen concentrations in the stationary and kinetic states were measured according to the following procedure. To continuously supply a certain amount of hydrogen measured with a flowmeter, the experiment was not stopped even after the termination of each scenario, and continuous experiments were conducted in the following order:
- 1) Hydrogen concentration was measured at SN1 (stationary state).
- 2) Scenario SN2 was applied, and scenario SN2 ended when the hydrogen concentration changed at the sensor location according to the exercise scenario.
- 3) After the end of Scenario SN2, the hydrogen concentration in the experimental space was monitored until it became homogeneous, and when it was equal to the initial concentration in step 1), another exercise scenario was applied. After each scenario, only the scenario in experimental sequence 2) was changed to SN3, SN4, and SN5 to perform the experiments under the same conditions.
In addition, all details regarding the conditions required for the numerical analysis were obtained from previous studies.
3. Mathematical Model and Numerical Procedure
In this study, a numerical analysis verification of the experiment was performed using the ANSYS Workbench platform, which was verified in previous research [12]-[17]. In the preprocessing stage, the Design Modeler and Meshing functions were used for modeling and grid design, and FLUENT (Ver 19.2) was used for model analysis [12]-[17].
3.1 Governing Equations
CFD is a numerical method for solving the Navier–Stokes equations, which are nonlinear partial differential equations. The governing equations employed to numerically simulate the flow in the experimental space due to hydrogen leakage are the continuity, momentum, and energy equations, which are expressed as Equations (1), (2), and (3) [18].
| (1) |
where ρ is the density, t is the time, and is the overall velocity vector.
| (2) |
where p is the pressure, is the stress tensor, is the gravitational acceleration, and is the force vector.
| (3) |
where E is the total energy, keff is the effective conductivity, T is the temperature, hjis the sensible enthalpy of species j, and is the diffusion flux of species j.
| (4) |
where Yi, Ri, and Si are the mass fraction of each species, the net rate of the product of species i by chemical reaction, and the rate of creation by addition from the dispersed phase plus any user-defined sources, respectively.
3.2 User-Defined Function
To reproduce the ship motion in the numerical analysis, mesh motion was applied to the cell zone conditions using the user-defined function (UDF) capability of FLUENT. Ship motion was expressed as a sine function according to the period and direction of rotation. Here, the period refers to the time required for the ship to tilt from the maximum inclination on one side to the opposite side and then return to its original position. Table 2 shows the definitions of the variables for applying the mesh motion, and Table 3 lists the UDF for applying the motion in the experimental space.
3.4 Numerical Details
For the entire analysis domain, the internal flow in the experimental space was assumed to be three-dimensional, unsteady, and turbulent. Realizable k-ε was applied to the turbulence model to consider diffusion behavior due to buoyancy during hydrogen leakage. The SIMPLEC algorithm was used to relate the speed and pressure [7]. The time according to the abnormal state analysis was calculated at 1-s intervals up to 1344 s after the leak. Table 4 summarizes the boundary conditions used in the numerical analysis.
3.5 Grid independence test
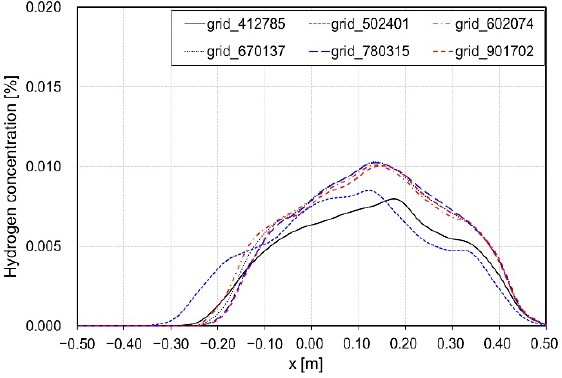
A tetrahedral grid was created in the experimental space using the ANSYS Meshing function. To ensure the accuracy of the numerical analysis and the efficiency of the calculation time, a locally dense grid was created in the hydrogen leak area and ventilation opening. A dependence test based on the number of grids was conducted to confirm the numerical validity of the generated grids. Under the analysis conditions, an abnormal analysis, based on the number of grids, was performed on six grid configurations, ranging from approximately 410,000 to 900,000 grids. To determine the effect of the number of grids, hydrogen concentrations at the ceiling height were compared after 180 s of leakage. Figure 2 shows the results of examining the grid dependence of the hydrogen concentration at the ceiling height after 180 s of leakage. The comparison confirmed that the hydrogen concentration value was accurately predicted at approximately 600,000 grids or higher. According to these results, the analysis was performed using the 600,000-grid configuration.
4. Experimental Validation Results
4.1 Verification Results in Stationary State
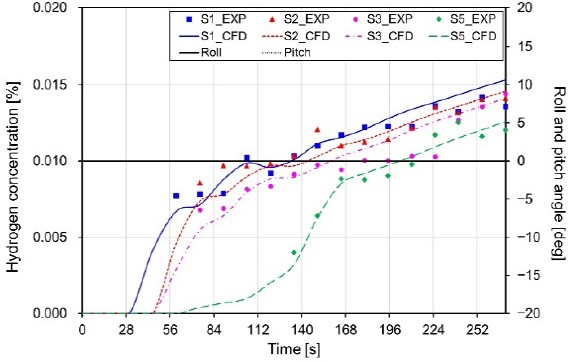
The hydrogen concentration results obtained from the experimental and numerical analysis in the stationary state were compared, as shown in Figure 3. The comparison demonstrates that the hydrogen concentration predictions for each sensor were similar, with a difference of less than 13%.
4.2 Verification Results in Roll Motion
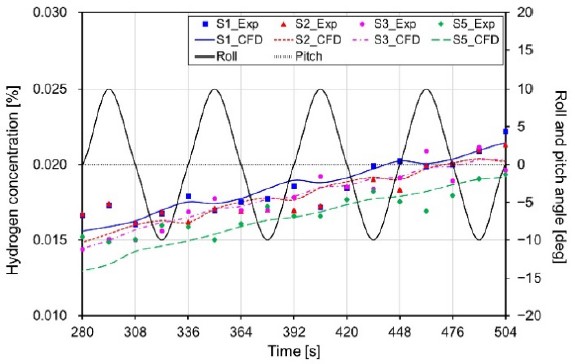
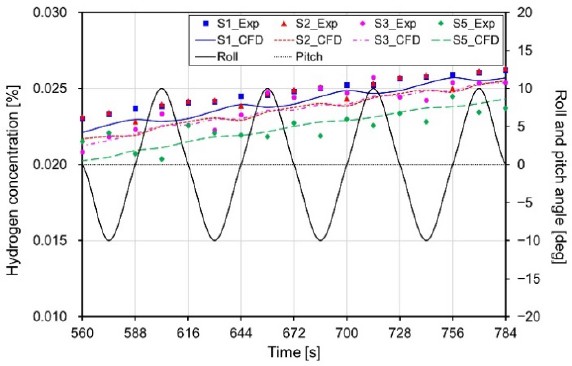
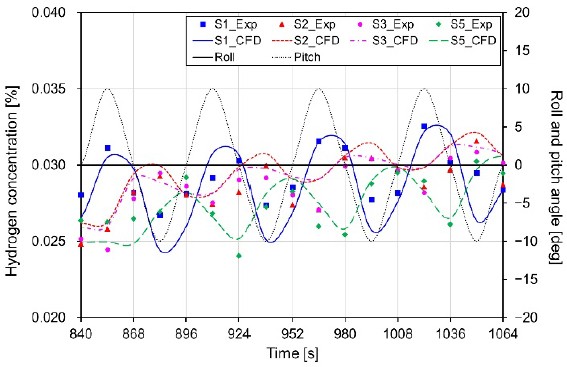
Figures 4 and 5 present a comparison of the experimental and numerical results for the roll motion scenario depending on the direction of motion (clockwise and counterclockwise). According to the results of the hydrogen concentration in SN3, which is a clockwise roll motion scenario, the cycle of motion affects the hydrogen concentration, displaying a tendency to rise and fall with a difference of approximately 3% to 14%, depending on the cycle. A similar trend was observed for SN4, which was a counterclockwise roll-motion scenario. The results from all sensors indicated that the concentration varied from a minimum of 2% to a maximum of 11%. Upon comparing the experimental and numerical results, the hydrogen concentration predictions were similar, within a 15% margin. These results confirm that the movement affected the change in hydrogen concentration in the experimental space, even though the hydrogen concentration layer had already formed in the stationary state.
4.3 Verification Results in Pitch Motion
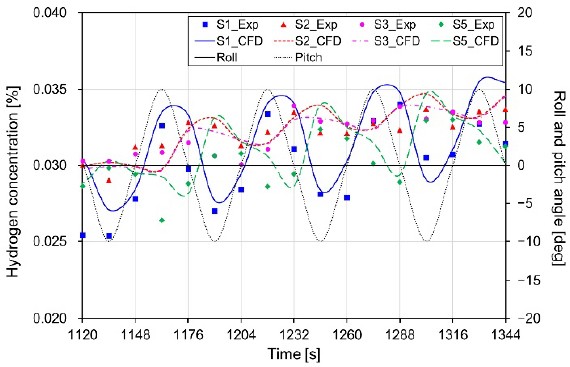
Figures 6 and 7 show a comparison of the experimental and numerical analysis results according to the direction of movement (clockwise and counterclockwise, respectively) in the pitch motion scenario. The comparison shows that the hydrogen concentration predictions were similar, with a difference of less than 15%. In addition, for the overall results in the case of scenario SN4, the hydrogen concentration changed by approximately a minimum of 18% to a maximum of 26%, depending on the pitching cycle; in the case of SN5, the concentration changed by approximately a minimum of 11% to a maximum of 24%.
4.4 Pressure by Buoyancy
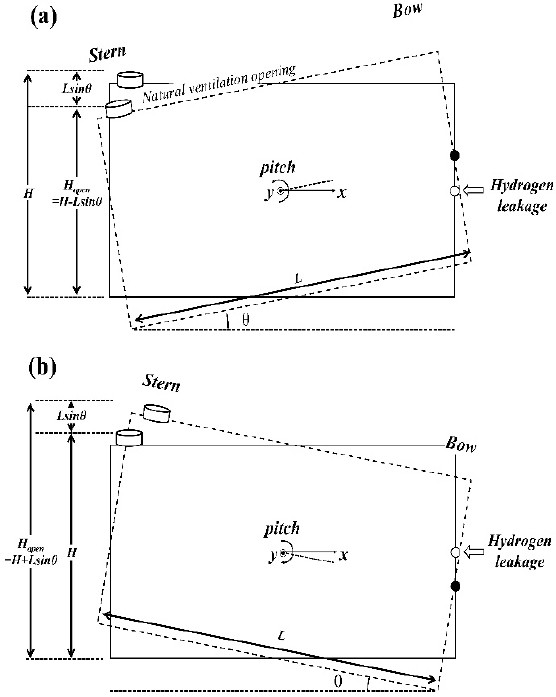
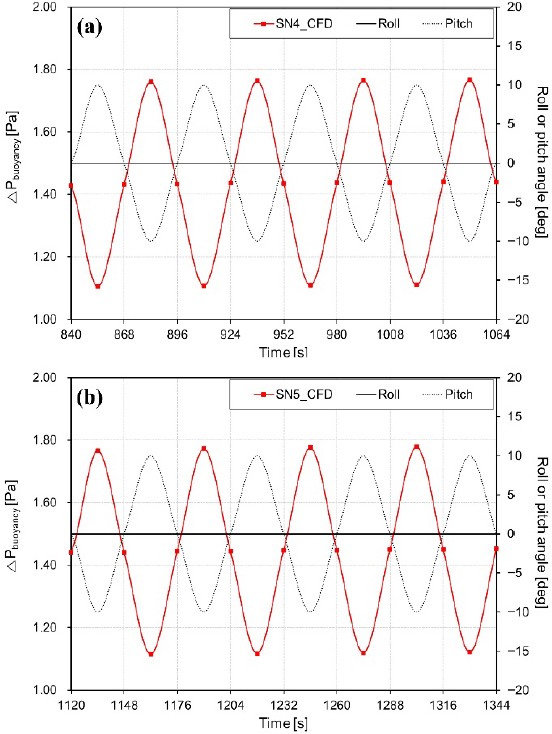
As previously explained, the results were obtained because of the variation in the size of the buoyancy force acting within the experimental space corresponding to the movement. To explain this phenomenon, the concept of the buoyancy-induced ventilation force is shown in Equation (5) [19]. In addition, a central longitudinal cross-section of the experimental space is depicted in Figure 8 to illustrate the difference in ventilation opening heights due to motion.
| (5) |
where ΔPbuoyancy, Δρ, g, and ΔHopen are the ventilation force by buoyancy, density difference between the external space and experimental space, acceleration of gravity, and ventilation opening height difference.
In Figure 8, as the bow moved upward, a density difference was observed between the external and experimental spaces due to hydrogen leakage. However, the magnitude of the buoyancy was more influenced by the height of the vent than by the density difference because the period of movement was long (56 s), and the experiment was performed continuously. When the bow was in an upward motion, i.e., tilted towards +10°, the height of the vent became smaller than the maximum, and when the bow was in a downward motion, i.e., tilted towards −10°, the height of the vent became larger than the maximum. The buoyant uplift force (ventilation force or resistance force) of scenarios SN4 and SN5 calculated using equation (5) is shown in Figure 9.
When the pitch angle was +10°, the resistive force acting through the vent resulted in a smaller amount of hydrogen discharged, causing a higher hydrogen concentration at sensor S1. Conversely, when the pitch angle was −10°, the discharge through the vent increased, resulting in a lower hydrogen concentration at sensor S1 and a higher concentration at sensor S5, located near the vent. The opposite is true for a longitudinal yaw angle of −10°.
5. Conclusions
The aim of this study was to develop a CFD model for determining the number and placement of gas detectors in the hydrogen fuel cell area of a ship. Hydrogen leakage and diffusion under ship motion conditions were simulated using ANSYS Fluent, and the simulation results were compared with existing experimental results. By comparing the experimental and numerical results for all scenarios, the hydrogen concentration predictions were found to be similar, with a difference of less than 15%.
The overall hydrogen concentration results indicate that the concentration varied by a minimum of 2% to a maximum of 11% in the roll motion scenario, and by a minimum of 11% to a maximum of 26% in the pitch motion scenario. These results are attributed to the difference in buoyant ventilation in the experimental space depending on the ship motion.
By determining the reliability of the analytical model, this validation study is expected to provide a more practical and economical method to determine the optimal locations for hydrogen gas detectors in real-world ship environments. In addition, the results demonstrate that the locations of the detectors and vents in a ship's hydrogen fuel cell compartment should consider the motion conditions.
However, this study was limited to a singular set of experimental space geometry, ventilation conditions, and hydrogen leakage scenarios. Therefore, in future research, we intend to apply the results to various ship, ventilation, and hydrogen leakage conditions.
Author Contributions
Conceptualization, B. Kim and K. I. Hwang; Methodology, B. Kim; Software, B. Kim; Formal Analysis, B. Kim and K. I. Hwang; Investigation, B. Kim; Resources, B. Kim; Data Curation, B. Kim; Writing—Original Draft Preparation, B. Kim; Writing— Review & Editing, B. Kim and K. I. Hwang; Visualization, B. Kim; Supervision, K. I. Hwang; Project Administration, K. I. Hwang; Funding Acquisition, K. I. Hwang.
References
- International Maritime Organization (IMO), 2023 IMO Strategy on Reduction of GHG Emissions from Ships, Resolution MEPC.369(80), 2023.
-
S. Atilhan, S. Park, M. El-Halwagi, M. Atilhan, M. Moore, and R. B. Nielsen, “Green hydrogen as an alternative fuel for the shipping industry,” Current Opinion in Chemical Engineering, vol. 31, 2021.
[https://doi.org/10.1016/j.coche.2020.100668]

-
O. B. Inal, B. Zincir, and C. Dere, “Hydrogen as maritime transportation fuel: A pathway for decarbonization,” Greener and Scalable E-fuels for Decarbonization of Transport, pp. 67-110, 2021.
[https://doi.org/10.1007/978-981-16-8344-2_4]

-
J. V. M. Lopes, A. E. Bresciani, K. M. Carvalho, L. A. Kulay, R. M. B. Alves, “Multi-criteria decision approach to select carbon dioxide and hydrogen sources as potential raw materials for the production of chemicals,” Renewable and Sustainable Energy Reviews, vol. 151, 2021.
[https://doi.org/10.1016/j.rser.2021.111542]

-
F. Rigas and P. Amyotte, Hydrogen Safety, 1st ed, Boca Raton, United States: CRC Press, 2012.
[https://doi.org/10.1201/b12267]

- I. Mun, E. -J. Kim, and K. -H. Lee, Introduction to Hydrogen Safety, 1st edition, Seoul, Korea: Chungsong Media, 2019 (in Korean).
-
F. Li, Y. Yuan, X. Yan, R. Malekian, and Z. Li, “A study on a numerical simulation of the leakage and diffusion of hydrogen in a fuel cell ship,” Renewable and Sustainable Energy Reviews, vol. 97, pp. 177-185, 2018.
[https://doi.org/10.1016/j.rser.2018.08.034]

-
X. Mao, R. Ying, Y. Yuan, F. Li, and B. Shen, “Simulation and analysis of hydrogen leakage and explosion behaviors in various compartments on a hydrogen fuel cell ship,” International Journal of Hydrogen Energy, vol. 46, no. 9, pp. 6857-6872, 2021.
[https://doi.org/10.1016/j.ijhydene.2020.11.158]

- Ministry of Oceans and Fisheries, Provisional Standards for Marine Hydrogen Fuel Cell Facilities, [Online]. Available: https://law.go.kr/LSW/admRulLsInfoP.do?admRulSeq=2100210000019, , 2023 (in Korean).
-
B. Kim and K. -I. Hwang, “Numerical analysis of the effects of ship motion on hydrogen release and dispersion in an enclosed area,” Applied Sciences, vol. 12, no. 3, p. 1259, 2022.
[https://doi.org/10.3390/app12031259]

-
B. Kim and K. -I. Hwang, “Experimental analysis of the effects of ship motion on hydrogen dispersion in an enclosed area,” International Journal of Hydrogen Energy, vol. 48, no. 81, pp. 31779-31789, 2023.
[https://doi.org/10.1016/j.ijhydene.2023.04.320]

-
J. W. Chung and G. S. Kim, “A study on temperature and humidity calibration for PIN photodiode radon detector,” Journal of the Institute of Electronics and Information Engineers, vol. 57, no. 6, pp. 97-104, 2020 (in Korean).
[https://doi.org/10.5573/ieie.2020.57.6.97]

-
T. Jin, M. Wu, Y. Liu, G. Lei, H. Chen, and Y. Lan, “CFD modeling and analysis of the influence factors of liquid hydrogen spills in open environment,” International Journal of Hydrogen Energy, vol. 42, no. 1, pp. 732-739, 2017.
[https://doi.org/10.1016/j.ijhydene.2016.10.162]

-
T. Jin, Y. Liu, J. Wei, M. Wu, G. Lei, H. Chen, and Y. Lan, “Modeling and analysis of the flammable vapor cloud formed by liquid hydrogen spills,” International Journal of Hydrogen Energy, vol. 42, no. 43, pp. 26762-26770, 2017.
[https://doi.org/10.1016/j.ijhydene.2017.09.042]

-
J. Choi, N. Hur, S. Kang, E. Lee, and K. B. Lee, “A CFD simulation of hydrogen dispersion for the hydrogen leakage from a fuel cell vehicle in an underground parking garage,” International Journal of Hydrogen Energy, vol. 38, no. 19, pp. 8084-8091, 2013.
[https://doi.org/10.1016/j.ijhydene.2013.02.018]

-
Y. Liu, J. Wei, G. Lei, H. Chen, Y. Lan, X. Gao, T. Wang, and T. Jin, “Spread of hydrogen vapor cloud during continuous liquid hydrogen spills,” vol. 103, p. 102975, 2019.
[https://doi.org/10.1016/j.cryogenics.2019.102975]

-
K. Wang, X. Zhang, Y. Miao, B. He, and C. Wang, “Dispersion and behavior of hydrogen for the safety design of hydrogen production plant attached with nuclear power plant,” International Journal of Hydrogen Energy, vol. 45, no. 39, pp. 20250-20255, 2020.
[https://doi.org/10.1016/j.ijhydene.2020.04.064]

- ANSYS, ANSYS Fluent Theory Guide, Release 19.2, Canonsburg, United States, 2019.
-
W. K. Chow, Y. Gao, J. H. Zhao, J. F. Dang, C. L. Chow, and L. Miao, “Smoke movement in tilted tunnel fires with longitudinal ventilation,” Fire Safety Journal, vol. 75, pp. 14-22, 2015.
[https://doi.org/10.1016/j.firesaf.2015.04.001]


