Preliminary study on the development of sailing modes for ships
Copyright © The Korean Society of Marine Engineering
This is an Open Access article distributed under the terms of the Creative Commons Attribution Non-Commercial License (http://creativecommons.org/licenses/by-nc/3.0), which permits unrestricted non-commercial use, distribution, and reproduction in any medium, provided the original work is properly cited.
Abstract
The shipbuilding and shipping industries have recently adopted regulations, such as the energy efficiency design index, existing energy efficiency index, and carbon intensity indicator, from international maritime organizations. However, these regulations do not reflect factors such as the country-specific sailing habits of captains, sailing patterns by route, port environments, and speed regulations in different waters. In this study, we analyze the general factors and profiles that affect the sailing modes of ships and driving modes of automobiles, identify the problems that occur when applying the concepts of automobiles to ships, and investigate their solutions. Based on this, a sailing mode generation algorithm was developed, and the sailing modes of the training ship were constructed from the sailing profile of one voyage. The results can serve as basic data for developing representative sailing mode methodologies generated based on the probability that derives various sailing profiles of different types of ships into one representative sailing mode. In addition, the representative sailing modes derived for specific waters and routes can be used to design optimization systems for new ships and measure the standardized fuel efficiency of ships with various sailing profiles.
Keywords:
Sailing mode generation, Sailing profile, Fuel efficiency measurement, Ship design1. Introduction
Owing to the increasing severity of global climate change, the maritime industry has proposed various measures to reduce greenhouse gas emissions according to the energy efficiency design index, existing energy efficiency index, and carbon intensity indicator of the International Maritime Organization. However, these regulations do not reflect factors such as the country-specific sailing habits of captains, sailing patterns by route, port environments, or speed regulations in different waters. An example of this discrepancy is the official fuel efficiency labeling system in the automotive industry. Similar to ships, the fuel efficiency and load of an automobile are influenced by various factors such as the characteristics and conditions of the vehicle, road conditions, traffic volume, traffic control systems, driving habits of the driver, and weather conditions. Therefore, several countries mandate fuel efficiency and emission measurements using standard driving modes (e.g., FTP-75 and NEDC) that match the driving patterns of each country. These measurements directly reflect the latest technological developments in energy management [1].
In the automotive industry, driving modes such as the FTP-75, NEDC, and Japan 10-15 mode and the US 06 and HWFET have been developed since the 1970s for cities and high-speed highways, respectively, essentially promoting vehicle development [2]. Consequently, driving mode technology has advanced significantly, and research on various development methods is ongoing. Korean and overseas studies related to this field have proposed various methods for creating driving modes, such as analyzing real-road driving patterns and reconstructing speed distribution [1]; defining stop, acceleration, and deceleration fragments; and using the Monte Carlo method based on the probability of each fragment [3], in addition to traditional methods that use microtrips [4].
Applying such driving modes to the energy efficiency standards of ships can yield a more objective and realistic indicator that can facilitate the design of systems based on representative sailing modes and an electrical load analysis (ELA) table. To date, the aforementioned system design has only been performed using an ELA table. This will enable more economical and optimal designs for electric propulsion ships. However, directly applying the driving modes of automobiles to ships is challenging because of the substantial difference between their operating environments.
In this study, we analyze the aspects and profiles that influence the modes of ships and automobiles, identify problems that occur when applying the concepts of automobiles to ships, and examine their solutions. Based on these results, a sailing-mode generation algorithm is developed, and the sailing modes for training the sailing profile of a ship for one voyage are derived.
2. Analysis of General Characteristics and Profiles of the Ship and Car
2.1 Selection of the Sailing Profile
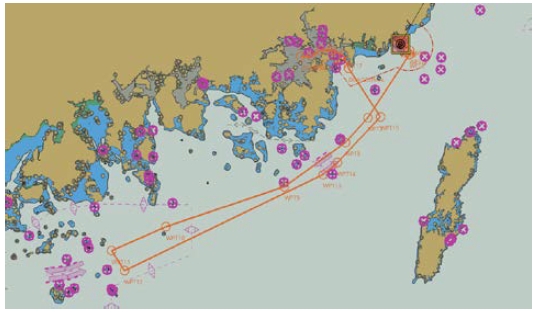
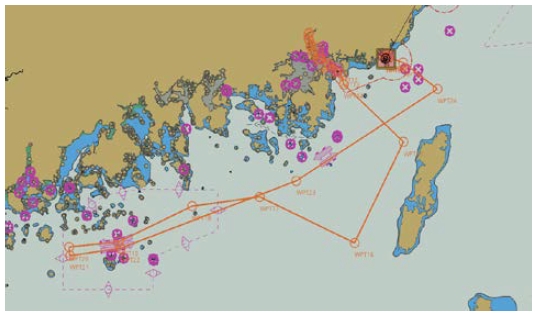
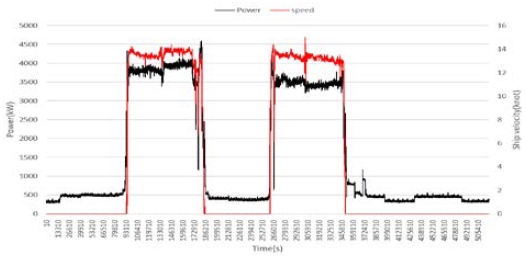
The target ship is the training ship Hannara of the Korea Maritime and Ocean University, and a voyage is selected randomly from its accumulated sailing profiles. The selected voyage was Busan–Masan–Busan, departing at 10:36 on November 1, 2021, and arriving at 10:36 on November 4, 2021, involving 4 days of sailing. Detailed information regarding the voyage is presented in Table 1. The route for the journey from KMOU to the Port of Masan is shown in Figure 1. The route departing from the Port of Masan on November 3, 2021 and arriving at the training ship pier of the Korea Maritime and Ocean University on November 4 is shown in Figure 2. Figure 3 shows the power and speed profiles of Hannara for the Busan–Masan–Busan voyage.
2.2 Selection of Automobile-driving Profile
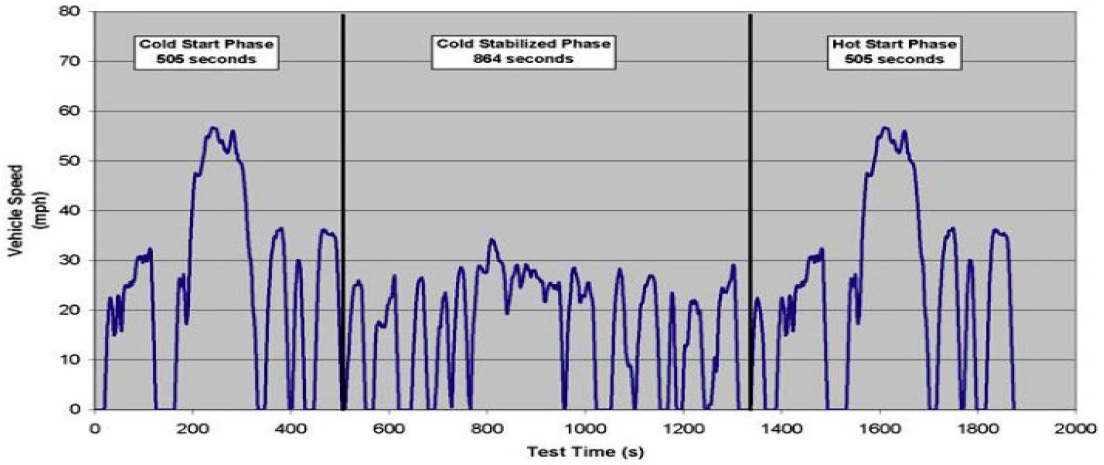
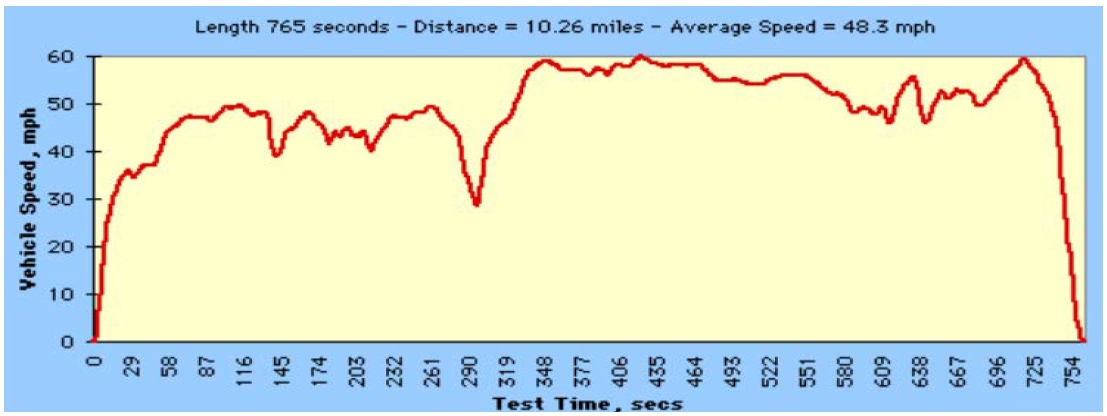
The Federal Test Procedure (FTP-75) and Highway Fuel Economy Test (HWFET), modified with a five-cycle calibration formula and applied to cars for fuel efficiency certification in South Korea, were selected for the automobile driving profile [5][6]. The speed profiles of the FTP-75 and HWFET modes are shown in Figures 4 and 5, respectively. FTP-75 is a transient cycle produced from real measurements in Los Angeles, and represents a specific region in the U.S. [7]. The FTP-75 cycle is a variant of the EPA urban dynamometer driving schedule. It simulates an 18 km trip in the Los Angeles Metropolitan Region with frequent stops and a short highway trip [8][9]. The HWFET represents highway driving conditions under 60 mph [10]. It is used to gauge the fuel consumption of light vehicles over a highway driving pattern [11]. The five-cycle calibration formula refers to the relational expressions for applying the energy consumption efficiency measured by FTP-75 and HWFET, similar to the energy consumption efficiency verified by the five test methods (five cycles): FTP-75, HWFET, US-06, SC-03, and Cold FTP-75. The US06 is a high acceleration aggressive driving schedule often identified as the "supplemental FTP" driving schedule. The SC03 is the air conditioning "supplemental FTP" driving schedule [5][6].
2.3 Analysis of the General Characteristics and Profiles of Ships and Automobiles
Table 2 compares the general factors affecting the driving and sailing modes of automobiles and ships. In automobiles, the two primary forces that slow cars are rolling resistance and air resistance. Rolling resistance arises from the friction between car tires and the road surface. Air resistance is the friction between the car body surface and air [12][13]. Ships experience more resistance factors than automobiles, such as air resistance, appendage resistance, frictional resistance, induced resistance, residuary resistance, total hull resistance, viscous resistance, and wave resistance [14]. Therefore, ships have more resistance components in their acquired sailing profiles than automobiles. Ships also differ from automobiles in that they are manufactured; shipbuilders typically adopt engineering-to-order (ETO) and are one-of-a-kind production (OKP) manufacturing [15], whereas automobile manufacturers mass-produce [16]. This manufacturing difference results in ships having more diverse propulsion outputs, weights, and shapes than automobiles. In addition, ships in water are not influenced by the potential energy owing to altitude difference. They have difficulty applying regenerative braking because ships accelerate by pushing water with a propeller. Ship sailing profiles do not exhibit altitude-related load differences as automobiles do. The total load experienced by Hannara is broadly divided into propulsion, deck machinery (mainly used for entering and exiting harbors), and auxiliary engine room loads. Non-propulsion loads account for approximately 14–30% of the total load, depending on the season and ship state [17][18]. However, according to the five-cycle calibration formula, which is widely used worldwide, the main power outputs of automobiles are propulsion and air conditioner power [6].

Comparison and analysis of the general characteristics of ships and cars that affect the driving and sailing modes
Therefore, unlike automobiles, ships have substantial loads that are not their primary source of propulsion power.
Although automobiles have speed limits on all types of roads [19], ships have speed limits in most ports. In South Korea, 19 harbors and 3 routes have designated speed limit zones, and in the US, regulations define speed limits in 11 main zones of the St. Mary’s River, which flows through Ohio and Indiana. In the UK, all ships in the port of Dover are limited to 8 knots, among other speed restrictions [20]. Nevertheless, various speed limits have been implemented in each country, port, and route.
For the driving cycle of automobiles, the ITI cycle is repeated several times. In the ITI cycle, the driving speed starts at 0 and ends at 0. For ships, this occurs twice. The development of a sailing mode that utilizes the ITI cycle is unsuitable for ships. To analyze each mode in the automobile and ship profiles, RPA and PKE were calculated. RPA (Equation (1)) is defined as the relative positive acceleration, and PKE (Equation (2)) is defined as the positive kinetic energy. RPA and PKE were used as parameters to analyze the driving dynamics [21][22]. The higher the RPA and PKE values, the greater the dynamic change. When determining the validity of the test data, RPA, a parameter that characterizes the load of a trip, is typically used [23]. PKE was used to solve the variation in fuel consumption, which is affected by driver behavior and traffic congestion levels [22][24], and the calculated values for each mode are presented in Table 3.
| (1) |
| (2) |
- a: acceleration, m/s2 or km/h2
- v: velocity, m/s or km/h
As presented in Table 3, for automobiles, RPA and PKE were larger for FTP-75 than for HWFET, implying that the load variability of FTP-75 was higher than that of HWFET. For ships, RPA and PKE were larger in the leaving-port (Busan) mode than Ocean-going-1 mode, indicating that the load variability of the leaving-port (Busan) mode was higher than that of Ocean-going-1. Notably, the Leaving-port (Busan) mode accelerated sharply up to 90% of the sailing speed and then accelerated gradually, whereas in the Ocean-going-1 mode, the power values moved up and down relative to the horizontal line, which is a constant power. This creates significant differences between the calculated RPA and PKE values.
Table 4 compares several items of the profiles of ships and automobiles. The total duration of the automobile was 1874 s in the FTP-75 mode and 765 s in the HWFET mode, totaling 43.98 min. For the ship, it was 51.1 h, based on the sample voyage of the training ship.
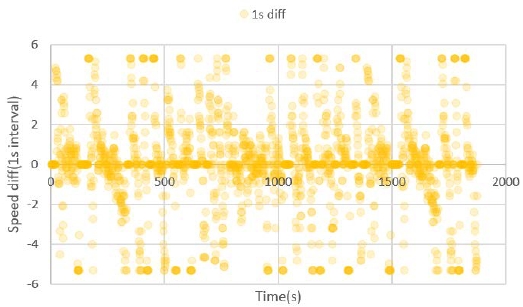
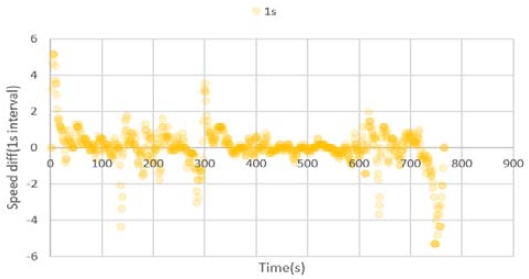
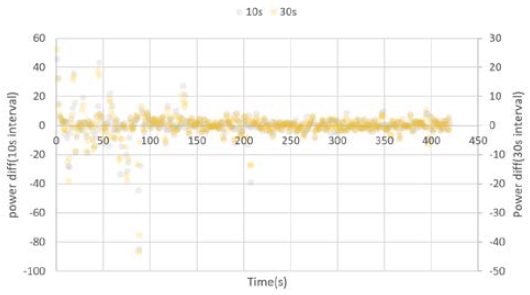
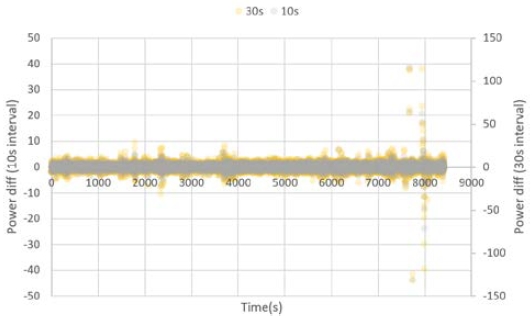
Figures 6 and 7 present scatter plots of the speed differential of an automobile in the FTP-75 mode (city driving mode) and HWFET mode (highway driving mode), with speed values measured in km/h and separated by 1 s intervals. The FTP-75 mode resulted in greater dispersion than the HWFET mode. This is evident from the number of sharp accelerations and decelerations related to the dynamics in the FTP-75 mode compared to those in the HWFET mode. Figures 8 and 9 show scatter plots of power differentials for the leaving-port (Busan) mode and Ocean-going-1 mode of the training ship at 10 and 30 s intervals. In the Leaving-port (Busan) mode, the points were scattered near y = 0, whereas in the Ocean-going-1 mode, the points were close to y = 0. This implies that the leaving-port (Busan) mode is more dynamic than the Ocean-going-1 mode.
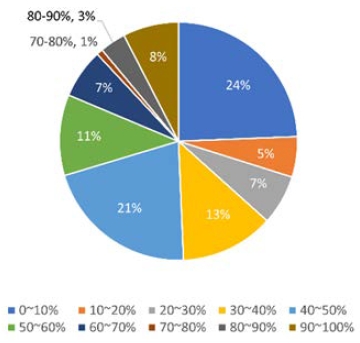
Figure 10 shows the load ratio for each part after the maximum speed of the FTP-75 mode, which was divided into ten equal parts. The ten sections were evenly distributed without bias. This indicates that the load proportion was distributed evenly because the FTP-75 mode had several ITI cycles.
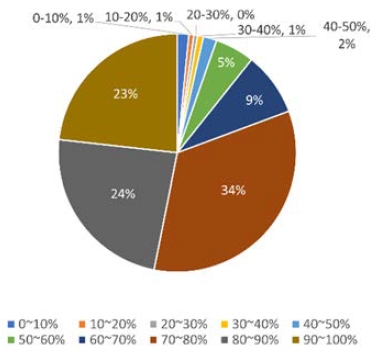
Figure 11 shows the load ratio for each part after the maximum speed of the HWFET mode was divided into ten equal parts. Evidently, the 70–100% load section occupies most of the load (81%) in the HWFET mode. This indicates that after the automobile accelerated sharply to the maximum speed in the HWFET mode, it maintained that speed.
Figure 12 shows the load ratio for each part after the maximum power of the leaving-port (Busan) mode was divided into ten equal parts. The 70–100% load section occupied most of the load (79%) in the leaving-port (Busan) mode. This implies that after the training ship accelerated sharply to the maximum power of the leaving-port (Busan) mode, it continued to accelerate gradually by the maximum power of the Leaving-port (Busan) mode.
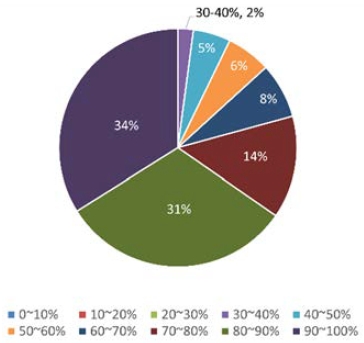
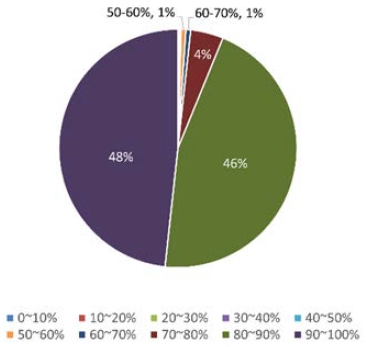
Figure 13 shows the load ratio after the maximum power of the Ocean-going-1 mode was divided into ten equal parts. The 80–100% load section occupied most of the load (94%) in the Ocean-going-1 mode. This implied that the training ship consistently maintained a pace near the maximum power of the Ocean-going-1 mode.
The analysis results of each mode in automobiles and ships show that each mode has different characteristics, such as load distribution and acceleration segments, and each mode must be defined to develop a representative mode.
3. Identifying Problems When Making the Sailing Modes and Exploring Solutions
This section derives problems and seeks solutions based on the results of the profile analysis and general matters affecting the operation modes of ships and automobiles conducted in Chapter 2 to develop an operation mode algorithm.
3.1 Case 1: y-axis Selection in Profile
Most loads on a ship consist of propulsion and non-propulsion loads (such as hotel loads). Therefore, a speed profile based on the propulsion load does not represent the entire load of the ship.
It is necessary to create a sailing mode based on the output profile rather than on the speed profile. However, a sailing mode based on the speed profile can be created for ships, where most of the total load comprises the propulsion load (e.g., watercraft).
3.2 Case 2: Criteria for Dividing the Sailing Profile
Automobiles are primarily used for moving small loads. The 5-cycle case consists of city and highway driving, aggressive high-acceleration driving, driving with the air conditioner on, and city driving with a cold engine [5]. Similarly, the ship function varies by ship type, as shown in Table 5 [25].
In ships, even when the speed is zero, a significant load appears in the power profile because of the operation of the generator.
Sailing modes must be developed according to the type of vessel and sailing route. The criteria for sailing routes are presented in Table 6. Sailing modes can be created based on criteria such as ship function; speed and ship function; ship function and output; ship function, speed, and output; or ship function, speed, out-put, and ELA.
3.3 Case 3: Various Total Powers with Propulsion Power and Generator Power in the Same Type of Ship and Similar Tonnage
Unlike automobiles, ships are customized according to the needs of the shipowner. Therefore, even if the type of ship is the same, the gross tonnage and total power vary with the propulsion power and generator power.
By applying the unit-gathered sailing profile concept, real sailing profiles can be derived by multiplying the total design power by the propulsion power, and the generator power by the unit-gathered sailing profiles for a specific ship, as shown in Equation 3. The unit-gathered sailing profiles are defined as the preprocessed sailing profiles divided by the total ship design power of the gathered sailing profiles. The tonnage of the ship, weather, waves, and similar factors are assumed to be subsumed in the sailing profile. In future studies, unit sailing profiles will be utilized to develop representative sailing modes based on probability.
| (3) |
- YR : Real gathered sailing profile of the specific ship
- YU :: Unit gathered Sailing profile of the specific ship
- Ptotal : Total design power of the specific ship
4. Ship Sailing Mode
4.1 Algorithm for Sailing Mode Generation
As there is no concept of sailing mode in the shipbuilding and shipping industry, we developed a sailing mode generation algorithm based on the concept of driving mode in the automobile industry. To develop a feasible methodology for the sailing mode development in future studies, we introduced concepts that do not exist in the driving mode. Based on the results of Chapters 2 and 3, we present an algorithm for creating the ship sailing mode, as shown in Figure 14. First, the purpose of each sailing mode was determined. After determining whether it is suitable for measuring the fuel efficiency or ship design, the sailing mode must be derived. The type of ship, sailing route (area), and y-axis values were selected, and the corresponding data were obtained from the ship and then preprocessed. Based on the preprocessed sailing profile, the sailing modes can be derived from the gathered sailing profile based on the previously mentioned criteria.
4.2 Types of Sailing Modes
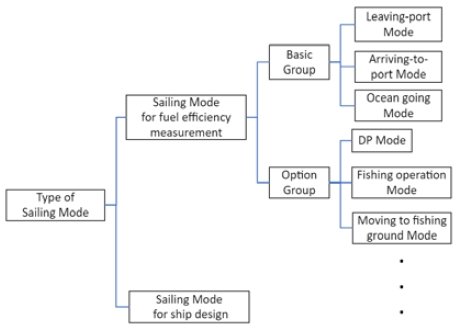
The sailing modes were divided into fuel efficiency and ship design modes. Figure 15 illustrates the types of sailing modes used. The fuel efficiency measurement sailing modes are divided into basic and optional groups, which refer to the sailing modes that all types of ships commonly have. The optional group refers to those that vary by ship type. For example, in the optional group, fishing vessels have modes, such as moving-to-fishing-ground and fishing-operation modes, whereas training ships have the DP mode. The fuel efficiency measurement sailing modes can be further subdivided based on the ship function, ELA, speed, power profiles, and other criteria. Unlike fuel efficiency measurement modes, ship design sailing modes are not subdivided. Instead, they exhibit a form similar to that of a single sailing profile.
4.3 Creation of a Sailing Mode for the Training Ship
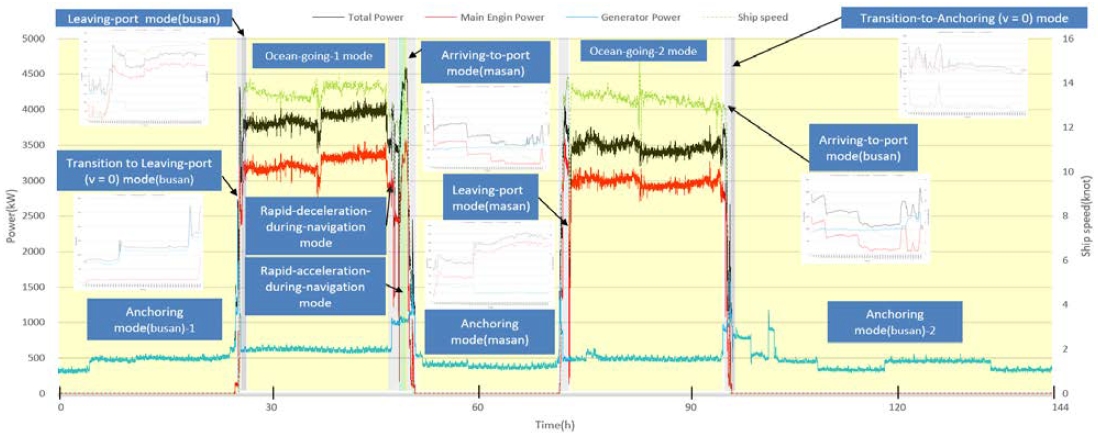
The fuel efficiency measurement mode was selected for the sailing profile of the training ship and South Sea nearshore area (Group 1). The sailing mode is derived based on the function, speed, power, and ELA of the ship. In the arrival and departure modes, the sailing mode is divided into parts where the speed was 0 with changing ship power, and where the speed was not 0 with gradually changing power, through which we additionally derived the anchoring, rapid acceleration during navigation, rapid deceleration during navigation, and ocean-going modes. Table 7 presents the types of derived sailing modes and Figure 16 presents the profiles of the main engine power, generator power, total power (main engine power and generator power), and ship speed for each mode.
- ○ Sailing-mode name: Fuel efficiency measurement: Training Ship – Group 1 (Busan–Masan–Busan voyage)
- ○ Sailing-mode type:
5. Conclusion
In this study, the general factors and profiles that influence the sailing modes of ships and driving modes of automobiles were analyzed, the problems that occur when applying automobile concepts to ships were identified, and their solutions were obtained. Accordingly, a sailing mode derivation algorithm was developed, and the sailing modes of the training ship from the sailing profile of one voyage were described.
The sailing modes of the training ship with the Busan–Masan–Busan voyage were developed based on the ship function, speed, output, and ELA and classified into anchoring (before departure), transition to leaving-port (v = 0), leaving-port, ocean-going, rapid-acceleration-during-navigation, rapid-deceleration-during-navigation, arriving-to-port, transition-to-anchoring (v = 0), and anchoring modes (after arrival). The results can serve not only on the training ship but also on other ships, and can also serve as basic data for developing representative sailing modes of methodologies generated based on the probability of deriving various sailing profiles of different types of ships into one representative sailing mode. In addition, the representative sailing modes derived for specific waters and routes can be used to design optimization systems for new ships and to measure the standardized fuel efficiency of ships with various sailing profiles.
Acknowledgments
This work was supported by the Technology Innovation Program (or Industrial Strategic Technology Development Program-Development of fuel cell system design and verification platform technology to hydrogen mobility) (00144182, Development of mobility driving mode for expansion of fuel cell system hybrid power system) funded By the Ministry of Trade, Industry & Energy(MOTIE, Korea).
This research was supported by Korea Institute of Marine Science & Technology Promotion(KIMST) funded by the Ministry of Oceans and Fisheries(20210369).
Author Contributions
Formal analysis, C. J. MOON; Investigation C. J. MOON; Supervision, K. D. PARK; Writing—original draft, C. J. MOON; K.W. KIM; Writing—review and editing, G. T. ROH; K. D. PARK. All authors have read and agreed to the published version of the manuscript.
References
- K. S. Wi., Development of Tractor Driving Cycle for Fuel Economy Test on Chassis Dynamometer, Master’s Thesis, Department of Mechanical Engineering, Ajou University, Korea, 2013 (in Korean).
-
N. W. Choi, D. S. Han, S. W. Cho, S. L. Cho, J. S. Yang, K. S. Kim, Y. J. Chang, and C. H. Jeon, “Development of a vehicle driving cycle in a military operation area based on the driving pattern,” Transactions of Transactions of the Korean Society of Automotive Engineers, vol. 20, no. 4, pp. 60-67, 2012 (in Korean).
[https://doi.org/10.7467/KSAE.2012.20.4.060]

-
J. Peng, J. Jiang, F. Ding, and H. Tan, “Development of driving cycle construction for hybrid electric bus: a case study in Zhengzhou, China,” Sustainability, vol. 12, no.17, p. 7188, 2020.
[https://doi.org/10.3390/su12177188]

- A. Fotouhi and M. J. S. I. Montazeri-Gh, “Tehran driving cycle development using the k-means clustering method,” Scientia Iranica, vol. 20, no. 2, pp. 286-293, 2013.
- Fuel Efficiency and Grade level in Automobiles, Korea Energy Agency. Available: https://bpms.kemco.or.kr:444/transport_2012/system/carlabel.aspx, , 2023, Accessed July 19, 2023.
- EPA Federal Test Procedure, EPA (United States Environmental Protection Agency). Available: https://www.epa.gov/emission-standards-reference-guide/epa-federal-test-procedure-ftp, , 2023, Accessed June 2, 2023.
-
R. E. Kruse and T. A. Huls, Development of the Federal Urban Driving Schedule, Technical Paper 730553, United States, 1973.
[https://doi.org/10.4271/730553]

- United States Environmental Protection Agency (US EPA), Dynamometer Drive Schedules. Available: https://www.epa.gov/vehicle-and-fuel-emissionstesting/dynamometer-drive-schedules, , Accessed August 13, 2023.
- DieselNet: Emission Test Cycles – FTP-75. Available at: https://dieselnet.com/standards/cycles/ftp75.php, , Accessed July 21, 2023.
-
Karabasoglu, Orkun, and Jeremy Michalek, Influence of driving patterns on life cycle cost and emissions of hybrid and plug-in electric vehicle powertrains, Energy policy,vol 60, pp. 445-461, 2013.
[https://doi.org/10.1016/j.enpol.2013.03.047]

- B. ÖZTÜRK, Energy Consumption and Emissions Characterization from Several Vehicle Technologies Considering Different Usage Profiles, Ph. D. Dissertation, Department of Mechanical Engineering, Tecnico Lisboa, July 2013.
-
H. C. Lee and J. -U. Cho, “Study of the shape of car body affecting flow resistance of air flowing near car,” Journal of the Korea Academia-Industrial cooperation Society, vol. 15, no. 8, pp. 4707-4712, 2014 (in Korean).
[https://doi.org/10.5762/KAIS.2014.15.8.4707]

-
P. A. Tuan and V. D. Quang, “Estimation of car air resistance by CFD method,” Vietnam Journal of Mechanics, vol. 36, no. 3, pp. 235-244, 2014.
[https://doi.org/10.15625/0866-7136/36/3/4176]

-
A. F. Molland, Ship Resistance and Propulsion, 2nd edition, Cambridge, United Kingdom: Cambridge University Press, 2017.
[https://doi.org/10.1017/9781316494196]

-
L. Nie, X. Xu, D. Zhan, J. Li, and J. Feng, “A collaborative operation framework for ship-building supply chain,” 2009 International Conference on Interoperability for Enterprise Software and Applications China, Beijing, China, pp. 41-46, 2009.
[https://doi.org/10.1109/I-ESA.2009.22]

-
P. Nieuwenhuis and P. Wells, The Global Automotive Industry, U.S: John Wiley & Sons, Ltd, 2015.
[https://doi.org/10.1002/9781118802366]

- Introduction to the ship Hannara. Available: https://www.kmou.ac.kr/stc/cm/cntnts/cntntsView.do?mi=4047&cntntsId=2621, , Accessed September 1, 2023.
- ELA (Electric Load Analysis table) of the ship Hannara, Accessed September 1, 2023.
- Global Status Report on Road Safety, WHO (World Health Organization), 2015.
-
D. Y. Chong, “A study on speed limit rules under sailing regulations - focusing on the perspective of VTS control,” Journal of the Korean Society of Marine Environment & Safety, vol. 28, no. 2, pp. 254-261, 2022.
[https://doi.org/10.7837/kosomes.2022.28.2.254]

-
J. Song and J. Cha, “Analysis of driving dynamics considering driving resistances in on-road driving,” Energies, vol. 14, no. 12, p. 3408, 2021.
[https://doi.org/10.3390/en14123408]

- R. Thitipatanapong, S. Klongnaivai, and P. Wongwetsawat, “Efficiency of a vehicle in traffic: kinetic energy approach,” 2012.
-
L. Sileghem, D. Bosteels, J. May, C. Favre, S. Verhelst, Analysis of vehicle emission measurements on the new WLTC, the NEDC, and the CADC, Transportation Research Part D: Transport and Environment, vol. 32, pp. 70-85, 2014.
[https://doi.org/10.1016/j.trd.2014.07.008]

-
A. Barré, F. Suard, M. Gérard, M. Montaru, and D. Riu, “Statistical analysis for understanding and predicting battery degradations in real-life electric vehicle use,” Journal of Power Sources, vol. 245, pp. 846-856, 2014.
[https://doi.org/10.1016/j.jpowsour.2013.07.052]

- G. Roh, The Study of Environment Friendly Fuel Cell System for Ship Application, Doctoral Dissertation, Department of Chemical and Biomolecular Engineering, Yonsei University, Korea, 2019.

