Finite element analysis of multi-pass dry wire drawing process of steel cord for tire reinforcement considering Al2O3 inclusion
Copyright © The Korean Society of Marine Engineering
This is an Open Access article distributed under the terms of the Creative Commons Attribution Non-Commercial License (http://creativecommons.org/licenses/by-nc/3.0), which permits unrestricted non-commercial use, distribution, and reproduction in any medium, provided the original work is properly cited.
Abstract
This study aimed to evaluate the effect of non-metallic inclusions on ductile damage during the multi-pass dry wire drawing process for manufacturing steel cords for tire reinforcement. The multi-pass design for the high-carbon (0.92-wt%C) steel-cord wire drawing process was carried out using an isothermal pass schedule to achieve a uniform wire temperature. The proposed drawing process reduced the wire diameter from 3.550 to 1.999 mm. The spherical non-metallic inclusion of Al2O3 was located at the center of a steel wire rod. The influence of the Al2O3 inclusion size on the effective strain and ductile damage during the ninth pass dry drawing process was investigated using finite element analysis. As the size of the Al2O3 inclusions increased, the effective strain, hydrostatic stress, and critical damage values inside the wire in contact with the inclusions increased as well.
Keywords:
Dry wire drawing process, Steel cord wire, Al2O3 inclusion, Ductile damage, Finite element analysis1. Introduction
A steel cord is a combination of multiple thin wires that help tires absorb shock and increase ride comfort. If the steel cord is manufactured using the highest quality steel, the tire can withstand high stress and improve stability during road driving. High-carbon steel is attracting interest as a suitable material for steel cords for tires because it has excellent heat and fatigue resistance, no shrinkage, and high durability. Considering these required properties, the dry/wet wire drawing technology of high-carbon steel is gradually developing, and the requirements to realize ultra-fine wires are increasing. However, as the wire becomes thinner, the risk of defects due to internal cracks caused by non-metallic inclusions such as Al2O3 and SiO2 increases, which may increase production costs and lower production efficiency.
Few studies have been conducted on the effect of inclusions during the wire drawing process. Riedel et al. performed finite element (FE) analysis of rod drawings with non-metallic inclusions and experimental verification. The proposed FE model can predict the brittle fracture of inclusions [1]. Yoshida conducted an FE simulation of drawing wires containing inclusions, and investigated the cause of wire breakage in terms of plastic mechanics [2]. Son et al. examined the effects of the inclusions of Al2O3 and SUS304 on a drawn gold wire. The yield stress of inclusions may cause a difference in drawing stress variation [3]. Norasethasopon and Yoshida showed the influence of the inclusion size and aspect ratio on the drawing stress, hydrostatic stress, and die pressure during the drawing of a copper-shaped wire [4]. However, in the abovementioned studies, the effect of non-metallic inclusions on wire breakage was not analyzed in the multi-pass drawing process applied in industrial sites.
This study aimed to evaluate the influence of Al2O3 inclusions on ductile fracture during the multi-pass dry wire drawing process. The drawing pass schedule for manufacturing tire steel cords was isothermally designed using an initial wire with a diameter of 3.55 mm. Elastoplastic FE analysis was performed using DEFORM-2D, and the ductile fracture of the drawn wire was analyzed in terms of plastic deformation, hydrostatic stress, and damage value.
2. Design of isothermal pass schedule
2.1 Flow stress curve at high strain
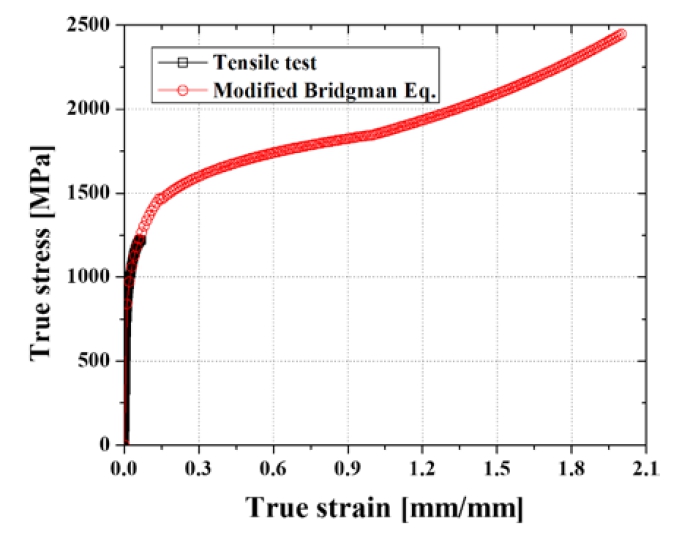
The steel cord material used in this study is high-carbon steel that including carbon of 0.88~0.96wt%. The chemical composition of the steel cord is presented in Table 1. Tire steel cords are produced through the multi-pass dry/wet wire drawing process, leading to severe plastic deformation of the material. Tensile tests were performed to predict the deformation behavior of the raw material. The results of the tensile tests were used to determine the stress–strain curve of the material. The tensile test results of the initial wire at room temperature are shown in Figure 1. Generally, the obtained flow stress-strain curve can be expressed using the Holloman equation:
| (1) |
where is the effective stress, is the effective strain, K is the strength coefficient, and n is the strain-hardening exponent. From an initial tensile test of the wire, K and n were found to be 2222.3 MPa and 0.2116, respectively. However, it is difficult to obtain an accurate effective stress-strain relationship at high strain using Equation (1) because of the large necking in the tensile test of the wire material.
To predict large deformation behavior, a rough correction for steel cord wires can be applied based on the empirical relation developed by Bridgman. Furthermore, the modified Bridgman factor to accurately describe flow stress at high strain, Bm, was used as follows [5]:
| (2) |
The red line in Figure 1 shows the predicted effective stress-strain relationship using Equation (2), and a more exact flow stress curve can be expected at a strain greater than 1.0.
2.2 Pass schedule of dry wire drawing process
Four stages are required for drawing high-carbon steel for manufacturing tire steel cords, starting from an initial wire with a diameter of 5.5 mm. The first and second stages are dry drawing processes. After each dry drawing process, the wires are treated using a patenting process. The third and fourth stages are wet drawing processes. In this study, we focused on the second dry drawing process.
In the multi-pass dry wire drawing process, the mechanical properties of the drawn product are significantly affected by the excessive increase in wire temperature during severe plastic deformation. Temperatures above 200 °C can cause significant strain aging, which can deteriorate the ductility of the drawn wire. Therefore, in this study, an isothermal pass schedule was designed in which the wire temperature at the die exit is the same at 200 °C or less in each pass so that delamination does not occur in the drawn wire. To achieve an isothermal pass schedule, the wire temperature at the die exit can be calculated using the following equations [6][7]:
| (3) |
where Tdie,in is the wire temperature at the die inlet, ρ is the wire density, km is the average deformation resistance during the deformation, kfm is the mean yield strength before and after the deformation, c is the specific heat of the wire, A is the conversion factor, m is the heat partition coefficient, f2 is the cross-sectional area of the wire at the die exit, F is the deviation of the cross-sectional area of the drawn wire between inlet and exit of drawing die, α is the semi-die angle, Q (=F/sin α) is the contact area between the drawing die and wire, and μ is the friction coefficient at the interface between the drawing die and wire.
The proposed drawing process, which comprises nine passes, reduced the wire diameter from 3.5 to 1.999 mm. The process conditions are listed in Table 2. The outlet diameter, area reduction, and predicted wire temperature for each pass are listed in Table 3.
3. FE analysis
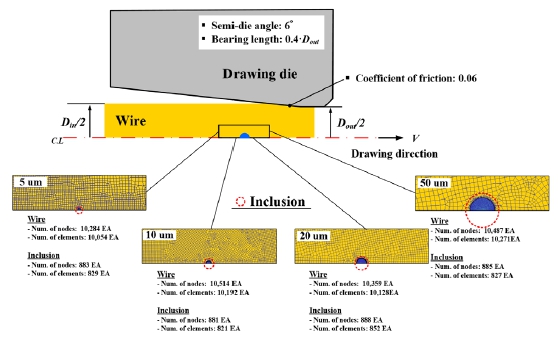
To investigate the effect of non-metallic inclusions on ductile damage during the multi-pass dry wire drawing process for manufacturing steel cords for tire reinforcement, elastoplastic FE analysis was performed using DEFORM-2D. The flow stress curve based on the modified Bridgman factor (Equation (2)) was applied to this FE analysis. Figure 2 shows a schematic illustration of the FE model, where the blue element indicates a non-metallic inclusion. The number of elements in the wire and inclusion was approximately 10,100 and 820, respectively. The size ratio of the fine mesh in the inclusions to the coarse mesh in the entire wire was 1:20.
The Al2O3 inclusions were located at the center of the steel wire cords, where the fracture of steel cords frequently occurs. The shape of the inclusions was assumed to be a sphere and its diameter was determined to be 5, 10, 20, and 50 μm. The elastic modulus and Poisson ratio of the Al2O3 inclusions were 398 GPA and 0.23, respectively [1]. In addition, the inclusion and wire part were completely joined at the contact boundary, and the Al2O3 inclusion was not deformed during the wire drawing process. The half die angle, Coulomb friction coefficient, and bearing length were 6°, 0.06, and 0.4·Dout, respectively. Dout is the outlet diameter of drawing dies.
The FE analysis was conducted under the same wire drawing conditions as the field operation. The pass schedule comprises nine passes, as listed in Tables 2 and 3. To investigate the effect of the inclusion, an FE analysis without the inclusion was also carried out. The effect of inclusions on ductile fracture was estimated using the normalized Cockcroft and Latham criterion. The damage value was calculated using the following expression:
| (4) |
where is the effective stress, σ* is the maximum principal tensile stress, is the effective strain at the fracture, is the effective strain, and C is the critical damage value.
4. Results and discussion
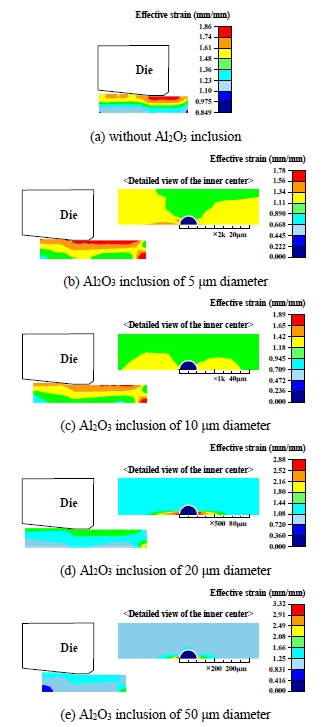
Figure 3 shows the effect of Al2O3 inclusions on the effective strain of the drawn wire and its distribution during the last drawing pass. The strain increased because of the friction at the interface between the drawing die and wire, and as a result of severe plastic deformation. When the size of the Al2O3 inclusions increased from 5 to 50 μm, the value of effective strain on the contact region between wire and inclusion dramatically increased. The maximum strain value of the drawn wire for an Al2O3 inclusion of 50-μm diameter at the last pass was 3.32, distributed around the front and rear regions of the inclusion along a drawing direction. This value is much larger than that of the wire without any inclusions.
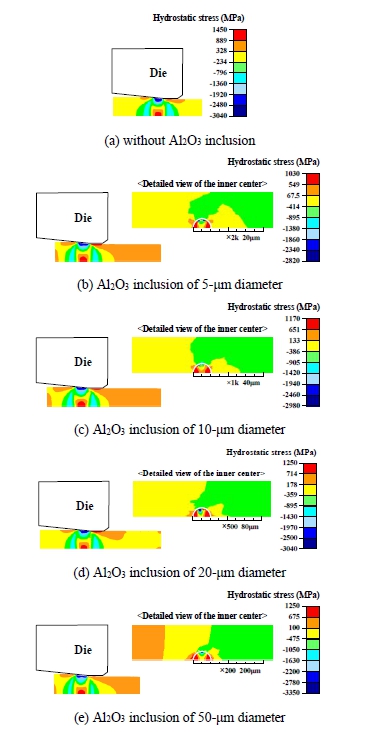
Figure 4 shows the hydrostatic stress distribution of the dry-drawn wire during the final drawing pass. When the size of Al2O3 inclusions increased from 5 to 50 μm, the magnitude of the negative hydrostatic stress at the reduction zone between the drawing die and wire and the positive value of that on the contact region between wire and inclusion gradually increased. This can in turn increase the probability of ductile fracture at the center of the drawn wire caused by Al2O3 inclusions.
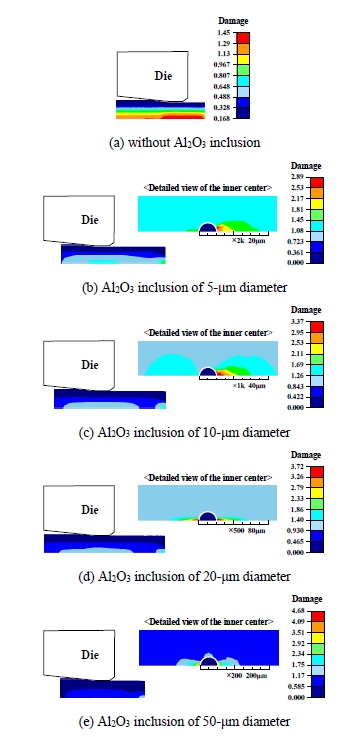
Figure 5 shows the effect of Al2O3 inclusions on the damage value of the drawn wire and its distribution during the last drawing pass. As shown in Figure 5(a), the damage value at the center of the wire without inclusions was approximately 1.45, and the damage value on the surface was 0.168. Larger Al2O3 inclusions led to an increase in the critical damage value of the drawn wire compared to that of the wire without inclusions. The maximum damage value of the drawn wire with Al2O3 inclusions of 50-μm diameter at the last pass was 4.68, as shown in Figure 5(e). The region where the maximum damage value appeared was almost the same as the region where the effective strain and positive hydrostatic pressure were the highest, i.e., the front and rear regions of the inclusions along the drawing direction.
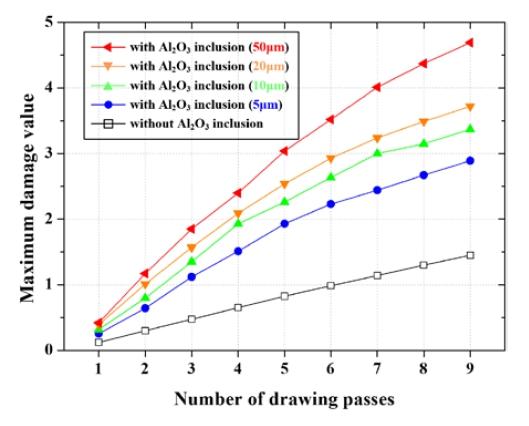
Figure 6 shows the variation curve of the maximum damage value for each drawing pass. Regardless of the presence or absence of Al2O3 inclusions, the maximum damage value increased almost linearly as the drawing pass progressed.
5. Conclusions
The dry drawing pass schedule in which the initial diameter (3.55 mm) was reduced to a final diameter of 1.999 mm was isothermally designed for sound production of steel cords for tire reinforcement. The wire temperature of the designed drawing process was approximately 170 ˚C in all the passes. Elastoplastic FE analysis was performed to evaluate the effect of spherical Al2O3 inclusions on ductile damage during the multi-pass dry wire drawing process. The inclusion was not deformed during the dry drawing process because of its large elastic modulus compared with that of the wire material. Larger Al2O3 inclusions enabled higher effective strain, positive hydrostatic stress, and critical damage value for the drawn wire. The maximum damage was observed in the front and rear regions of the inclusions along the drawing direction. The maximum damage value of the drawn wire with Al2O3 inclusions of 50-μm diameter and without inclusions was approximately 4.68 and 1.45, respectively.
Acknowledgments
This research was supported by Korea Basic Science Institute (National Research Facilities and Equipment Center) grant funded by Ministry of Education (grant No. 2022R1A6C101B738).
Author Contributions
Conceptualization, K. -H. Lee; Methodology, S. -K. Lee; Software, I. -K. Lee and K. -H. Lee; Validation, S. -K. Lee and K. -H. Lee; Formal Analysis, I. -K. Lee; Investigation, I. -K. Lee; Data Curation, I. -K. Lee and K. -H. Lee; Writing—Original Draft Preparation, I. -K. Lee; Writing—Review & Editing, K. -H. Lee; Supervision, K. -H. Lee; Funding Acquisition, K. -H. Lee.
References
-
U. T. Riedel, W. Bleck, J. E. Morgan, F. J. Guild, and C. A. McMahon, “Finite element modelling of the effect of non-metallic inclusions in metal forming processes,” Computational Materials Science, vol. 16, no. 1-4, pp. 32-38, 1999.
[https://doi.org/10.1016/S0927-0256(99)00043-9]

- K. Yoshida, “FEM analysis of wire breaks in drawing of superfine wire with an inclusion,” Wire Journal International, vol. 33, no. 3, pp. 102-107, 2000.
-
S. -B. Son, Y. -K. Lee, S. -H. Kang, H. -S. Chung, J. -S. Cho, J. -T. Moon, and K. -H. Oh, “A numerical approach on the inclusion effects in ultrafine gold wire drawing process,” Engineering Failure Analysis, vol. 18, no. 5, pp. 1272-1278, 2011.
[https://doi.org/10.1016/j.engfailanal.2011.03.015]

-
S. Norasethasopon and K. Yoshida, “Influences of inclusion shape and size in drawing of copper shaped-wire,” Journal of Materials Processing Technology, vol. 172, no. 3, pp. 400-406, 2006.
[https://doi.org/10.1016/j.jmatprotec.2005.09.020]

-
S. -K. Lee, D. -W. Kim, M. -S. Jeong, and B. -M. Kim, “Evaluation of axial surface residual stress in 0.82-wt% carbon steel wire during multi-pass drawing process considering heat generation,” Materials & Design, vol. 34, pp. 363-371, 2012.
[https://doi.org/10.1016/j.matdes.2011.06.036]

-
S. -K. Lee, D. -C. Ko, and B. -M. Kim, “Pass schedule of wire drawing process to prevent delamination for high strength steel cord wire,” Materials & Design, vol. 30, no. 8, pp. 2919-2927, 2009.
[https://doi.org/10.1016/j.matdes.2009.01.007]

-
H. -H. Jo, S. -K. Lee, M. -A. Kim, and B. -M. Kim, “Pass schedule design system in the dry wire-drawing process of high carbon steel,” Proceedings of the Institution of Mechanical Engineers Part B Journal of Engineering Manufacture, vol. 216, no. 3, pp. 365-373, 2002.
[https://doi.org/10.1243/0954405021520030]


