Study on the fabrication of a two-phase flow waste heat recovery unit for Organic Rankine Cycle in marine applications
Copyright © The Korean Society of Marine Engineering
This is an Open Access article distributed under the terms of the Creative Commons Attribution Non-Commercial License (http://creativecommons.org/licenses/by-nc/3.0), which permits unrestricted non-commercial use, distribution, and reproduction in any medium, provided the original work is properly cited.
Abstract
Unlike conventional heat exchangers, Waste Heat Recovery Units (WHRU) and condensers for Organic Rankine Cycle (ORC) power generation undergo phase changes. WHUR requires meticulous designs, because they utilize refrigerants instead of water as the working fluid. The objective of this study was to develop a WHRU that can be used in a single ORC system for ships. The heat transfer rate was calculated during the preliminary design stage, and the operating characteristics were analyzed using Computational Fluid Dynamics (CFD) techniques. A prototype of the WRHU was fabricated and tested, and calculation results of the experiment and CFD simulation confirmed the validity of the model. The heat transfer characteristics and stable phase changes in the WHRU were confirmed by applying various refrigerants to the CFD model, which were validated through experiments. Consequently, it was confirmed that the location at which the phase-change phenomenon occurs in the WHRU differs depending on the type of refrigerant, and the manufacturing and operating conditions of the heat exchanger for stable ORC power generation system operation can be predicted.
Keywords:
Organic Rankine Cycle, Waste heat recovery unit, Phase change, Heat transfer rate, Computational fluid dynamics1. Introduction
At the 72nd Marine Environment Protection Committee (MEPC) of the International Maritime Organization (IMO) held in 2018, an initial strategy for reducing GHG emissions from ships was adopted. Efforts to decarbonize maritime operations and enhance ship energy efficiency through technological advancements have been intensively pursued worldwide [1]-[2].
The adoption of the existing energy efficiency ship index (EEXI) at the 76th MEPC meeting of the IMO has significant implications for regulating ship energy efficiency. This measure is substantially important because it strictly applies energy efficiency regulations to both newly built vessels and existing operational ships [3]-[4].
From an energy efficiency perspective, heat exchangers installed on ships are essential for the smooth operation of major devices, including the main engine, thereby leading to gradual expansions of relevant markets.
The application of Waste Heat Recovery Unit (WHRU) is an effective approach for enhancing energy efficiency, specifically the use of waste heat from the exhaust gas generated by a ship's main engine [5].
The Organic Rankine Cycle (ORC) power generation system, which incorporates a WHRU, is among the technologies that enhance the energy efficiency by utilizing a refrigerant. The Rankine cycle power system generates electricity by utilizing the mechanical power generated from the rotation of a turbine, which is driven by high-pressure steam formed as it passes through the evaporator. Although water is an efficient working fluid for high-temperature heat sources, its usage becomes challenging when the heat source temperature is medium to low (70–400°C), resulting in a decrease in overall efficiency [6].
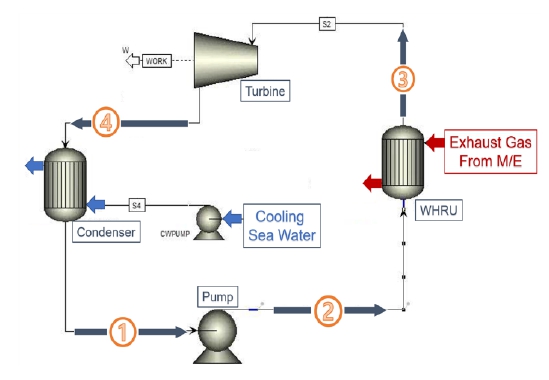
In this study, we developed a two-phase WHRU for use in ORC power generation systems of ships. The phase transition states and heat transfer characteristics were examined using numerical analyses. Figure 1 shows the configuration of a single ORC system for ships.
A WHRU is typically designed to capture the waste heat generated from a heat source and recycle it for use in another system. Standard WHRUs are based on a simple heat-exchange mechanism.
However, the WHRU operates differently for two-phase flows. This capitalizes on the phenomenon in which two different phases of a fluid, such as gas and liquid, flow together. The mixture of these two states creates complex internal thermal fluid dynamics, significantly impacting the heat transfer efficiency. Two-phase-flow WHRUs effectively harness the intricate flow phenomenon of waste heat recovery. Under specific conditions, a two-phase-flow WHRU can provide higher heat recovery efficiency than a conventional WHRU.
The following observations were made upon reviewing representative conventional studies that used numerical analysis to analyze the heat transfer characteristics of WHRUs used in ORC power generation systems.
Suárez et al. [7] conducted a comparative analysis using the ANSYS Fluent program to improve the accuracy of simulations predicting the heat exchange performance, operational temperature, and pressure in the evaporators of terrestrial industrial ORC power systems. This analysis involved comparing heat transfer calculations in one-dimensional cross sections and three-dimensional structures of the heat transfer area.
Zhang et al. [8] conducted research on a fin-and-tube evaporator, which is a component of an ORC power combined system that utilizes exhaust gas heat from a ship's diesel engine. The ANSYS Fluent program was used to perform heat and flow calculations, focusing on the pressure and flow of the exhaust gas. Adjusting the distance and angle of the fin layout changed the exhaust gas differential pressure, thereby increasing the efficiency of the diesel engine of the ORC combined system by up to 6.5%.
Rahbar et al. [9] introduced an ORC system to efficiently recover waste heat of temperatures 240-270°C emitted from small stoves that used wood as an energy source. For this purpose, a circular coil-style evaporator was installed in the exhaust gas penetration line, which resulted in the production of 1.113 kW of power and an approximately 20% increase in the system efficiency.
Yang et al. [10] simulated the performance and output of a heat exchanger in an ORC system utilizing waste heat from the diesel engine exhaust of a ship by adjusting three variables: evaporative pressure, degree of superheating, and condensation temperature from the perspective of an evaporator. The effective heat transfer area of the evaporator varied between 16.46% and 69.19% of the total heat transfer area depending on the output range of the diesel engine.
The four aforementioned studies employed numerical analysis techniques to examine the heat transfer characteristics associated with the evaporators of ORC power systems.
However, the characteristics were analyzed by focusing on the heat transfer rate, and information regarding the stable state and change in the phase-change from liquid to gas of the working fluid occurring within the WHRU was not considered.
In this study, a two-phase WHRU model for ORC power generation was developed using numerical analysis. Furthermore, a prototype was fabricated based on the simulation results of the model. The validity of the model was confirmed by comparing the experimental results obtained from the prototype with simulation results. Moreover, the modeling results revealed the internal occurrence of the phase change phenomenon when various refrigerants were used.
2. Fabrication of waste heat recovery unit
2.1 Fabrication process
In this study, the performance of a WHRU was evaluated using CFD. During the initial modeling phase, boundary conditions that mirrored the actual operating conditions were established. These conditions were determined based on standard flux equations.
Subsequently, discretization processes were employed to solve the problems related to continuous flow and heat transfer. Multiple grid densities and turbulence models were tested to ensure accuracy of the results. The final model was validated by comparing the modeling results with the experimental data.
The design requirements for the heat exchanger were initially reviewed considering factors such as the manufacturing processes. In this phase, we determined the overall dimensions, selected suitable materials, estimated the configuration, and arranged the tubes for the heat exchanger. Subsequently, the necessary heat transfer area was manually calculated to achieve the desired performance criteria.
The final design was derived from several iterations, and adjustments were made to the simulation results of the model. Consequently, a heat exchanger aligned with the specified performance objectives was fabricated.
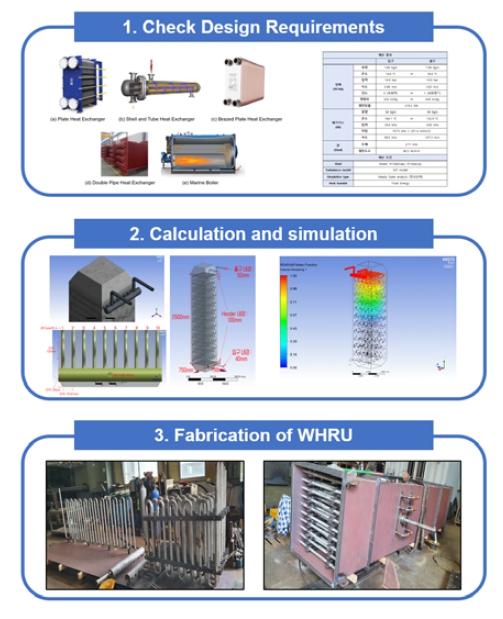
Figure 2 illustrates the fabrication process of the WHRU device. The first step was the identification of the performance requirements for the target WHRU through the ORC power generation system, considering that the heat exchanger was intended for marine use, and the determination of the necessary heat transfer rate to meet these requirements.
In addition, it is necessary to understand the characteristics and thermal energy range of the limited heat sources of ships. A suitable shape for the heat exchanger was determined based on an analysis of the heat source and its compatibility with ship installation.
The second step was to roughly determine the exterior that best fit the required WHRU performance. This was accomplished by considering the shape of the selected WHRU and relevant prior studies, and then selecting the appropriate material for the fabrication of the heat exchanger tube.
A 3D model was created for the simulation of the heat exchanger, based on which the performance of the WHRU was calculated. Thermal and flow simulations were conducted using the commercial program ANSYS CFX (v.18.1).
2.2 CFD model of WHRU
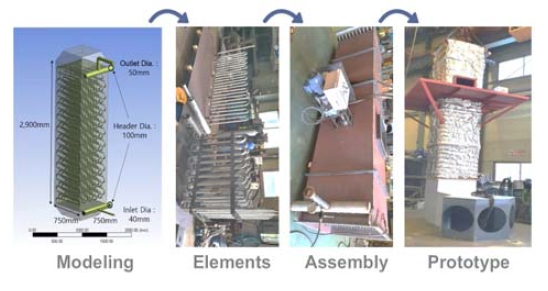
Figure 3 shows the model and prototype of the WHRU. The tube used to fabricate the WHRU model was made of steel and had an inner diameter of 26.213 mm and a thickness of 2.769 mm.
The chemical composition ratio of the exhaust gas from representative propulsion engines was used in the calculations [11]. After combustion, the oxygen concentration in the intake decreased, whereas carbon dioxide was generated in equal proportions. The composition ratio of the exhaust gas used in this simulation was 72% nitrogen, 20% carbon dioxide, and 8% water.
When creating the 3D CFD model, the tubes were designed based on their inner diameters rather than on their shapes and thicknesses. Including its thickness, producing a tube shape complicates the progress of numerical analysis calculations owing to the extensive number of grids required in the creation process.
The CFX program had a 'thin wall modeling' function for heat transfer calculations, which simulated heat transfer according to the tube thickness by inputting the tube thickness and material.
During the phase change in the WHRU, the refrigerant entered in its liquid state, exchanged heat with the exhaust gas, transformed into a gaseous state, and then discharged through the outlet.
The density of R134a is 1146.1 kg/m³ in its liquid state and 50.072 kg/m³ in its gaseous state, at an absolute pressure of 10 bar. Therefore, even though the flowrates of the refrigerant at the inlet and outlet were similar, the velocities appeared to differ owing to the differences in density. Thus, the refrigerant inlet pipe diameter should be designed to be smaller than the outlet pipe diameter.
2.3 Experiment of WHRU
An experimental setup similar to an ORC system was used in this study. An experiment was conducted to determine the heat transfer characteristics of R134a refrigerant as the working fluid.
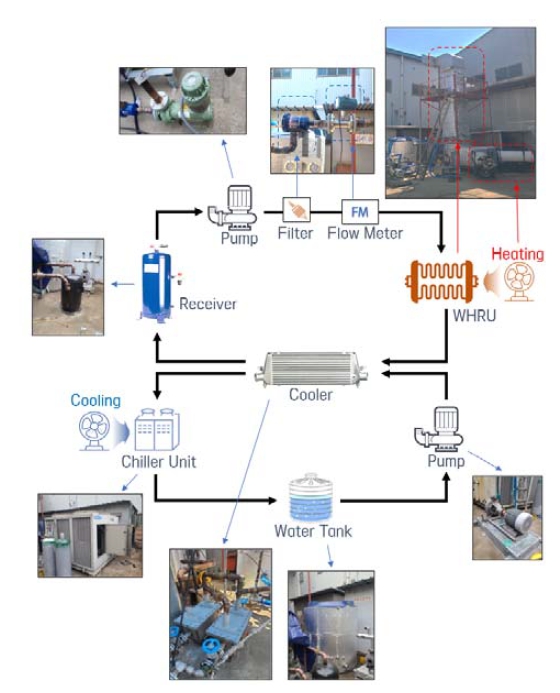
Figure 4 shows a schematic of the WHRU test equipment. Demonstration is difficult since the prototype is still in the research and development (R&D) stage. So, I devised the following experimental procedure.
The heating value of one hot air blower supplying heat to the WHRU was 140,000 kcal/h (162.7 kW), and the supply temperature ranged at approximately 160–170°C. The temperature of the gas generated by this hot air blower is relatively lower compared to that of the ship's main engine exhaust gas. Because of the low temperature, the flow rate was increased to ensure a sufficient supply of thermal energy to prevent waste heat.
The installed pump pressurized the liquid refrigerant before transferring it from the receiver to the WHRU. A filter was installed directly in front of the flow meter to remove any residual substances that could damage the flowmeter.
A chiller unit, water tank, and cooling water pump were installed to supply cooling water to the refrigerant condenser. The chiller unit of the CU-A40HSI model from the Century Company had a cooling performance of 19.8 RT. The pump employed a centrifugal mechanism.
A digital turbine flow meter that detected the rotation of the propeller caused by the flow per wing stroke was used for highprecision calculations. The working fluid flow was adjusted using a pump bypass valve. Despite minor differences in the outlet temperature, the model results showed identical heat transfer rates (W) (within a 5% error), confirming the validity of the model.
Table 1 lists the experimental results, which show that the experimental and simulated heat transfer rates were similar. The experimental and simulated exhaust gas temperatures had the largest difference. The simulation did not measure the temperature at a specific point with respect to the exhaust gas temperature; however, the average temperature of the exhaust gas outlet surface was calculated. In contrast, in the experiment, instead of measuring the average temperature, a temperature gauge was installed at a specific point on the exhaust gas outlet pipe. A temperature difference of approximately 5°C between experimental and simulated values was observed.
In addition, a difference of approximately 4°C between the simulated and experimental outlet temperatures of the refrigerant was observed. The refrigerant outlet temperature in the CFD simulations was determined by calculating the average temperature of the refrigerant outlet area.
The experiments and simulations were conducted under identical conditions. The experimental results, including the temperature and pressure of the refrigerant in the tube, agreed with those of the simulation. These results confirm the validity of the CFD model of the WHRU device fabricated in this study.
3. Phase change depending on refrigerant type
Various studies have compared and analyzed the thermal performances of refrigerants used in ORC systems. Depending on the refrigerant, the selection of the comparison targets and fixed variables is an important factor in the performance comparison process.
The interpretation of the results may vary depending on the calculation conditions related to the refrigerant characteristics because the manifestation of the thermal characteristics of refrigerants is not limited to a single factor such as temperature or pressure. In this study, the fixed variables were set as discussed in this section.
The objective of this study was to achieve a stable operation of the turbine installed downstream of the WHRU. The basic functions of the WHRU, which included achieving a dryness of 1 at the outlet and sufficient evaporation of the refrigerant at an operating pressure of 15 bar, were considered fixed variables.
3.1 Characteristics of heat transfer
Four refrigerants: R134a, R152a, R22, and R245fa, were used in the experiment. These refrigerants, which are commercially and readily available for use in ships, are preferred over the latest synthetic refrigerants.
Table 2 lists the results obtained by applying the four refrigerants (R134a, R152a, R22, and R245fa) using the WHRU model. All four refrigerants entered the WHRU in a sub-cooled state at 15°C and exited as saturated steam with a dryness of 1 at a pressure of 15 bar.
The fixed variables required for the WHRU to achieve stable operation of the ORC turbine are a pressure of 15 bar and a dryness of 1. An outlet dryness of 1 was achieved by adjusting the flow rate of the refrigerant inlet.
Among the four types of refrigerants, R22 required the highest flow rate to achieve a dryness of 1 under a working pressure of 15 bar at the outlet of the WHRU. The calculations revealed that R22, at a flow rate of 1.65 kg/s, had a heat transfer rate of 327.3 MW. In other words, the results indicate that the WHRU developed in this study achieved the highest heat exchange when R22 was used as the refrigerant.
Through this simulation, the operating conditions for the discharge of a refrigerant with a dryness of 1 at the outlet of the fabricated WHRU were identified when four different types of refrigerants were used.
For refrigerant R22, the temperature of the gas corresponding to a dryness of 1 at 15 bar was 39.7°C. This temperature is relatively low compared to other refrigerants. Moreover, the specific heat capacity of R22 at constant pressure was the lowest compared with those of the other refrigerants.
Based on these characteristics, the highest rate of heat transfer was achieved when R22 was applied. To achieve a dryness of 1 using R22, it was necessary to recover the highest amount of waste heat. Using R22, the difference between the inlet and outlet temperatures was relatively small.
The refrigerants used in this simulation exhibited the following characteristics. R22 is a widely used HCFC refrigerant in refrigeration and air conditioning systems. Although R22 has a high cooling efficiency and can operate at low-temperature heat sources, its usage is currently limited and declining because of its contribution to ozone depletion and global warming [12]. Although it is possible to use R22 in ORC power systems, it is more appropriate to use alternative refrigerants considering environmental regulations and efficiency.
R245fa is an HFC refrigerant primarily used in ORC power systems that utilize low-temperature heat sources. Because of its high fluid density and low environmental impact, it enables efficient heat transfer while ensuring stable system operation. It is primarily used in energy recovery systems, such as geothermal power plants, and in the recovery of industrial waste heat.
Both R134a and R152a are HFC refrigerants with similar price and have relatively lower environmental impacts than other refrigerants. R134a is widely used owing to its stable performance and high level of safety. R134a is preferred owing to its high cooling efficiency when applied to ORC systems, whereas R152a is primarily considered for its environmental benefits.
3.2 Heat transfer coefficient of WHUR
The heat transfer coefficient measures the amount of heat transferred per unit area under a temperature difference. In simpler terms, this parameter quantifies the efficiency of the thermal transfer between two materials. The higher the value, the more efficient is the heat transfer. The heat transfer coefficient is influenced by several factors, including the type of material, surface conditions, and flow characteristics.
The heat transfer coefficients from previous studies on WHRUs for ORC systems that utilized R245fa as the working fluid were reviewed. In these studies, shell- and tube-type heat exchangers demonstrated heat transfer coefficients ranging from approximately 170 to 400 W/m2·°C [13]-[15].
In this study, the WHRU model obtained a heat transfer coefficient of 240.7 °C W/m2 using R245fa refrigerant. This coefficient is within the average coefficients reported in previous studies on WHRU.
The heat transfer coefficient can vary, even when similar types of heat exchanger and working fluid are used. This inconsistency is caused by the variations in the operational conditions, such as the system pressure and temperature, which are adjusted according to the specific objectives of the ORC system.
The heat transfer coefficient can vary significantly, particularly during phase changes, because of the subtle design differences in the bends, flow path, and turbulence that occur during fluid flow in heat exchangers.
3.3 Phase change based on refrigerant type
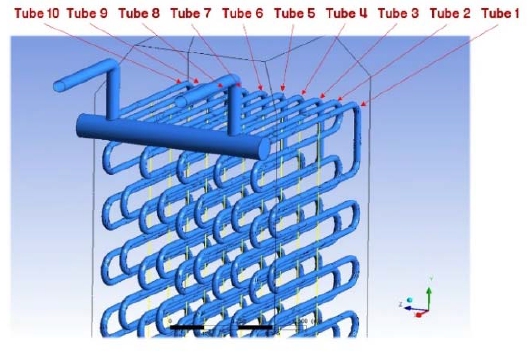
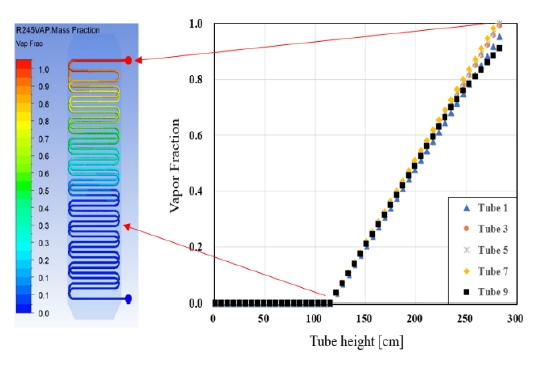
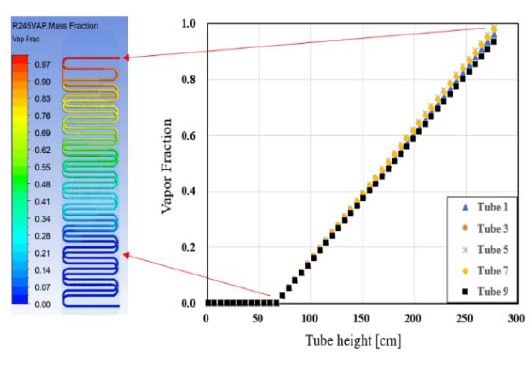
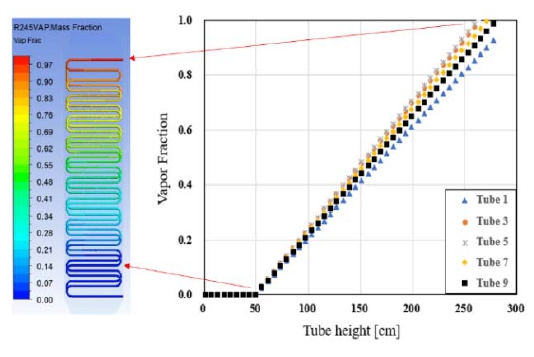
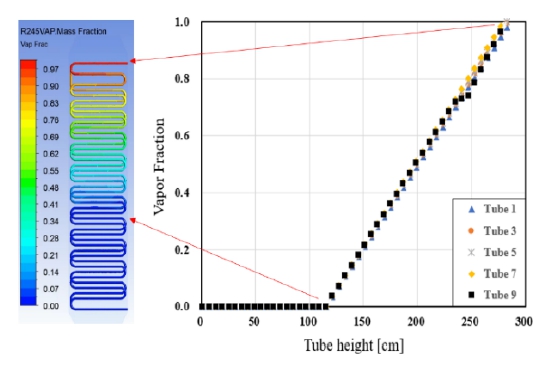
Figure 4 shows the numbers assigned to the ten tubes within the WHRU. These numbers were assigned to compare changes in dryness across each tube. Figures 5, 6, 7, and 8 show the distribution of dryness for each refrigerant and their corresponding graphs.
A crucial element in heat exchanger design involving phase change is the location at which the phase change occurs. If it occurs too close to the inlet or outlet, it can impede the stable operation of the heat exchanger.
The location of the phase change is crucial because it affects both the stable operation and heat transfer efficiency. If the phase change occurs too close to the inlet of the heat exchanger, it may cause the fluid to undergo a phase change immediately upon entering the heat exchanger, resulting in operational inefficiency. Conversely, if the phase change occurs near the outlet, there is a risk of expelling steam-containing liquid droplets, which could damage the turbine installed downstream of the WHRU, if the phase change is not fully completed.
When designing a heat exchanger with a phase change, predicting the location of the phase change is crucial for heat transfer calculations. The temperature distribution of a fluid can be predicted through heat transfer calculations, enabling estimation of points at which the phase changes occur. Phase changes can be verified through experimental methods or simulations.
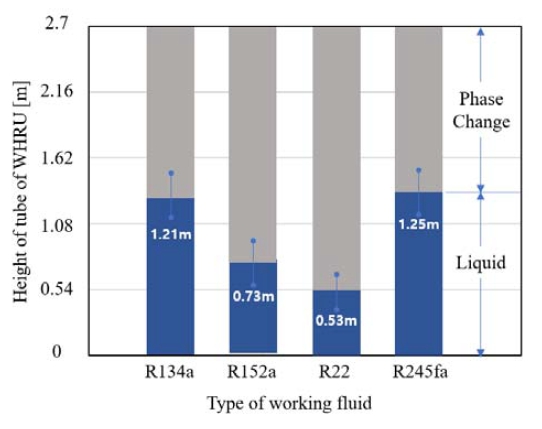
Figure 9 shows the phase transition points for the four refrigerants, which indicate the transition from liquid to gas. The most stable operating state of the phase change occurred near the center of the WHRU.
The phase change points of R152a and R22 were found to be relatively closer to the inlet, at approximately 1/6 of the total height of the pipe, compared to the other refrigerants. This implies that the phase change point changes even if only the type of refrigerant is changed and the shape of the heat-exchanger remains the same. That is, the location at which an internal phase change occurs varies depending on the characteristics of the refrigerant, even if it is discharged at the outlet with the same dryness fraction of 1.
The position of phase change varies depending on the refrigerant, making it an important design factor. Although the heat transfer rate and high thermal efficiency are important in the design and manufacture of WHRUs where phase changes occur, this study is meaningful because it confirmed the locations of phase changes based on the types of refrigerants used for stable operation.
To design and manufacture heat exchangers suitable for ORC power generation, it is important to consider the refrigerant characteristics and locations of the phase changes.
The locations of the phase changes in a heat exchanger is crucial for ensuring both stable operation and optimal thermal efficiency. If the phase change occurs too close to the entrance, it may cause fluid transition.
4. Conclusions
In this study, a WHRU was fabricated for single ORC systems designed for ships. The performance of the heat exchanger was calculated using CFD techniques during the design stage, and the heat transfer characteristics were analyzed for fabrication.
(1) The simulation results of the WHRU developed in this study were compared to the operational results of an actual prototype. The heat transfer rate calculated experimentally was 403 kW, whereas that in the simulation was 398 kW. The validity of the WHRU model, which simulated the evaporation and phase change of the refrigerants, was verified.
(2) Simulations were conducted using four types of refrigerants in the WHRU model. R22 required the highest flow rate to achieve an outlet dryness of 1 at a working pressure of 15 bar under the same calculation conditions. The calculation resulted in a flow rate of 1.65 kg/s and heat transfer of 327.3 kW for R22.
(3) The points at which phase changes occur in WHRUs varied depending on the type of refrigerant. In two-phase flow-type heat exchangers, the points at which phase changes occur can affect both the efficiency of the heat exchangers and stable operations of the turbines installed at the rear of WHRUs. Therefore, they should be designed such that the points of occurrence of the phase changes would be close to the center of the heat exchangers as possible.
Acknowledgments
Author Contributions
Conceptualization, D. J. Hwang; Methodology, D. J. Hwang and O. Cheol; Software, D. J. Hwang; Formal Analysis, T. W. Lim; Investigation, J. H. Jee; Data Curation D. J. Hwang; Writing-Original Draft Preparation, D. J. Hwang; Writing-Review & Editing, E. S Bang; Visualization, E. S Bang; Supervision, D. J. Hwang, and O. Cheol; Project Administration, O. Cheol; Funding Acquisition, O. Cheol.
References
-
T. -H. Joung, S. -G. Kang, J. -K. Lee, and J. -K. Ahn, “The IMO initial strategy for reducing Greenhouse Gas (GHG) emissions, and its follow-up actions towards 2050,” Journal of International Maritime Safety, Environmental Affairs, and Shipping, vol. 4, no. 1, pp. 1-7, 2020.
[https://doi.org/10.1080/25725084.2019.1707938]

- International Maritime Organization (IMO), Resolution MEPC.304(72). Initial IMO Strategy on Reduction of GHG Emissions from Ships, Resolution MEPC.304(72), 2018.
- International Maritime Organization (IMO), Report of the marine environment protection committee on its seventy-third session, MEPC 73/19, 2018.
-
E. Czermański et al., “Implementation of the energy efficiency existing ship index: An important but costly step towards ocean protection,” Marine Policy, vol. 145, 2022.
[https://doi.org/10.1016/j.marpol.2022.105259]

-
Y. -U. Song, “Study on the ORC power generation system in marine engines of various sizes,” Journal of the Korean Society of Marine Engineering, vol. 42, no. 3 pp. 148-154, 2018.
[https://doi.org/10.5916/jkosme.2018.42.3.148]

- Y. Lu, A. P. Roskilly, and X. Yu, “The development and application of Organic Rankine Cycle for vehicle waste heat recovery,” Organic Rankine Cycle Technology for Heat Recovery, 2018.
-
C. Paz, E. Suárez, J. Porteiro, and A. Díaz, “New methodology for CFD simulations of compact evaporators used in automotive ORC systems,” International Journal of Thermal Sciences, vol. 143, pp. 14-26, 2019.
[https://doi.org/10.1016/j.ijthermalsci.2019.05.010]

-
C. Bei, H. Zhang, F. Yang, S. Song, E. Wang, H. Liu, and et al., “Performance analysis of an evaporator for a diesel engine–organic Rankine cycle (ORC) combined system and influence of pressure drop on the diesel engine operating characteristics,” Energies, vol. 8, no. 6, pp. 5488-5515, 2015.
[https://doi.org/10.3390/en8065488]

-
K. Rahbar, S. Mahmoud, R. K. Al-Dadah, N. Moazami, and D. Ashmore, “Feasibility study of power generation through waste heat recovery of wood burning stove using the ORC technology,” Sustainable Cities and Society, vol. 35, pp. 594-614, 2017.
[https://doi.org/10.1016/j.scs.2017.09.013]

-
F. Yang, H. Zhang, C. Bei, S. Song, and E. Wang, “Parametric optimization and performance analysis of ORC (organic Rankine cycle) for diesel engine waste heat recovery with a fin-and-tube evaporator,” Energy, vol. 91, pp. 128-141, 2015.
[https://doi.org/10.1016/j.energy.2015.08.034]

- J. Bernodusson, Combustion of Fossil Fuel, Research and Development Icelandic Transport Authority, 2020.
-
B. -B. Hwang, J. -I. Yoon, C. -H. Son, and M. -J. Jeon, “Status of use of refrigerants in ship,” Journal of the Korean Society for Power System Engineering, vol. 20, no. 6, pp. 5-10, 2016.
[https://doi.org/10.9726/kspse.2016.20.6.005]


