A Study on Velocity Profiles between Two Baffles in a Horizontal Circular Tube
Copyright © The Korean Society of Marine Engineering
This is an Open Access article distributed under the terms of the Creative Commons Attribution Non-Commercial License (http://creativecommons.org/licenses/by-nc/3.0), which permits unrestricted non-commercial use, distribution, and reproduction in any medium, provided the original work is properly cited.
Abstract
The shell and tube heat exchanger is an essential part of a power plant for recovering transfer heat between the feed water of a boiler and the wasted heat. The baffles are also an important element inside the heat exchanger. Internal materials influence the flow pattern in the bed. The influence of baffles in the velocity profiles was observed using a three-dimensional PIV (Particle Image Velocimetry) around baffles in a horizontal circular tube. The velocity of the particles was measured before the baffle and between them in the test tube.
Results show that the velocity vectors near the front baffle flow along the vertical wall, and then concentrate on the upper opening of the front baffle. The velocity profiles circulate in the front and rear baffle. These profiles are related to the Reynolds number (Re) or the flow intensity. Velocity profiles at lower Re number showed complicated mixing to obtain the velocities and concentrate on the lower opening of the rear baffle as front wall.
Numerical simulations were performed to investigate the effects of the baffle and obtain the velocity profiles between the two baffles. In this study, a commercial CFD package, Fluent 6.3.21 with the turbulent flow modeling, k-ε are adopted. The path line and local axial velocities are calculated between two baffles using this program.
Keywords:
Baffle, Shell and tube heat exchanger, Particle image velocimetry, Computational Fluid Dynamics1. Introduction
Shell and tube heat exchangers are devices that supply thermal energy between two or more fluids at different temperatures. These apparatuses are widely employed in the industry, such as thermal power plant, chemical process, electronics, air-conditioning, refrigeration, manufacturing, and other thermal systems. Previous investigations for this type of heat exchanger have concentrated on increasing heat transfer coefficient, system performance, pumping power, surface characteristics, fouling or plugging, and other factors using experimental or numerical methods.
Only few studies have focused on the effect of baffles and flow patterns inside the heat exchangers. Among these approaches, Gupta et al. [1] investigated several microfiltrations in helical baffles using flow visualization, and found more than 50% enhancement in permeate flux. Van Dijk et al. [2] observed the physical behavior in dense fluidized beds using the X-ray technique, and suggested that despite the clear effect of the baffle on the bubble dynamics, the velocity of the apex was not very severely affected. Tomasz Chmielnieliak et al. [3] reported a cyclone-type separator with swirling baffle based on Leith and Licht’s cyclone [4].
The tangential velocity distribution is obtained by superposition of the velocity fields generated by tangential gas inlet and others.
L. Du et al. [5] studied particle flow behavior in a gas–solid separator with guide and separation baffles using the phase Doppler particle analyzer. The results of their study revealed that the inertia of the particle significantly affects their behavior in different group sizes, indicating that smaller particles are more influenced by the drag force of the gas stream.
Rensheng Deng et al. [6] presented a study on the Taylor vortex flow between a rotating inner cylinder and a stationary outer cylinder with vertical or horizontal baffles by employing particle image velocimetry (PIV) and computational fluid dynamics (CFD). The results showed that vertical baffles influence the vertical positions of the vortices, and are primarily significant in the bottom vortex. H. Asgharzadeh et al. [7] studied a sedimentation tank for water treatment plants using a 10 MHz acoustic Doppler anemometry. The results of their study showed that the best baffle position and proper baffle height are related to the inlet concentration. Mahboubeh Jafarkhani et al. [8] demonstrated the qualitative and quantitative properties of fluid dynamics in a baffle-filled channel by CFD. They found that the average fluid velocity, shear stress, and mass transfer on the tube wall increased by further extending the baffle angles from 90° to 180°. Nguyen Lu Phuong et al. [9] investigated the behavior of airflow and dispersion of size, depending on the ventilation duct, using the κ– ε turbulent model. They found that a vertical duct with a baffle in a perfect sink condition on the wall surfaces increased particle deposition and decreased particle escape.
Xesus Nogueira et al. [10] conducted numerical and experimental studies on oscillatory flow within a baffle tube that contains tri-orifice baffles. The results indicated that numerical scheme is suitable for computation in the complex flow situation. Mahdi Sharokhi et al. [11] employed CFD to find the optical position of a baffle in a laboratory primary sedimentation tank. Results showed that the baffle improves tank efficiency in terms of sedimentation and acts as a barrier, effectively suppressing the horizontal velocities and reducing the size of the dead zones. Recently, Jian-Feng Yang et al. [2] investigated the effects of number and width of the sealing strips on shell and tube heat exchangers. The results showed the mass flow rate and the width of the sealing strips. With the increase in the number of sealing strips, the Nusselt number was 9.3% to 41.7% higher than that without sealing strips.
Various studies on the effects of baffle for the flow and hydrodynamics of devices have been conducted. However, only a few studies mentioned the velocity near and between the baffles. In the present study, 3D PIV was employed to measure the velocity profiles without swirling flow around two baffles in a horizontal circular tube. The velocities for the baffles are considered on the parallel and the counter flows.
2. Experimental Apparatus and Methods
2.1 Apparatus
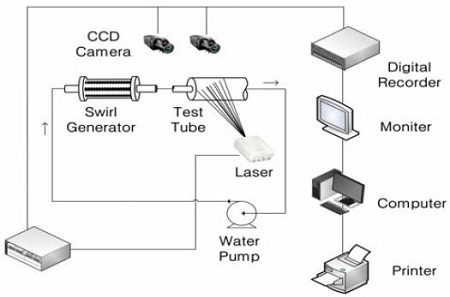
Figure 1 presents the schematic of the experimental rig and the PIV system employed in this study. The test tube was manufactured with an acrylic pipe (d = 54 mm, L = 770 mm) 3.0 mm thick. Two baffles (3 mm thick) were installed in the test tube with 13% of the cutoff ratio (approximately 7.02mm). The detailed diagram of the test tube is shown in Figure 2, which has flow direction, such as parallel and counter flows. A swirl generator with tangential slots was employed to produce swirling flow. For the without-swirling flow generation, the swirl generator was taken out and replaced with honeycombs to produce uniform flow.
The flow rate was measured by employing a flow meter installed at the outlet of the main pipe. The Reynolds number (Re) with the diameter of the main pipe was 7,200 to 14,000. The measurement region X is the horizontal direction of the vertical pipe, Y the vertical direction, and Z the out-of-plane direction. Given that the test tube was circular, the images captured by the two cameras were strongly distorted. Thus, a square box was installed outside the circular tube and water was filled in the empty space between the circular tube and the square box to reduce such effect.
Two digital high-speed cameras (Basler 2.3 k × 1.7 k, 250 fps) with lenses (60 mm, MICRO NKKOP) were used for stereoscopic measurements and arranged as shown in Figure 1.
The flow field was visualized with a continuous laser light sheet (thickness = 2 mm to 3 mm) (Ar–ion laser, 2 W). The two cameras were horizontally installed, maintaining 30° angles toward the measurement area. The seeding particles (nylon, d = 100 μm) were suspended in the working fluid (water) for PIV measurements and added at the entrance of the main pipe (d = 54 mm, L = 770 mm). The particle supply was made through a small hole (d = 5 mm) at the main pipe, whereas the working fluid was not circulated by the pump.
2.2 PIV(Particle Image Velocimetry) Calculation
Camera calibration should be performed before the main experiments to enable 3D measurements with the two-camera system. The calibrator is a flat plate (50 mm × 50 mm) on which grid lines are formed with regular intervals of 10 mm lines. This plate was traversed back and forth to the direction of the camera lens so that the grid images at six locations can be obtained. This plate was traversed inside of the test tube to consider the refractive indexes of the working fluid (water) and the acrylic walls. To perform this process, a cover on the circular cylinder tube was installed. During the main experiments, the cover was completely closed to prevent any leakage of water.
The calibration method and 3D measurement algorithms developed by Doh et al. [13] were used for camera calibration and stereoscopic PIV measurements. Equation (1), the collinear equation, was used for 3D calculations, where cx and cy are the focal distances for the x and y components of the coordinate; Δx and Δy are the lens distortions; l refers to the distance between the origin O (0, 0, 0) and the principal point (X0, Y0, Z0 ) of the camera; (x, y) represents the photographical coordinate of the image centroid of the calibration targets; (Xm, Ym, Zm) represents the point P position of the calibrator when the the photographical (camera coordinate) and physical coordinates are set in a collinear line after rotation with tilting angles mx and my, which correspond to the point at which the normal vector from the origin O (X0, Y0, Z0 ) of the camera coordinate meets with the X–Y plane. Equation (1) has 10 unknown parameters, specifically 6 exterior parameters (l, mx, my) and 4 interior parameters (cx, cy, k1, k2). The regression method by Doh et al. [13] was adopted to calculate these 10 unknown parameters.
| (1) |
After all unknown camera parameters were calculated, the relations between the photographic (camera coordinate) and absolute coordinates (physical coordinate) of the target or particle image can be expressed through Equation (2), where (X, Y, Z) represents the absolute coordinate of the target position P in the photographic coordinate. The matrix MM used for rotational transformation contains the 10 unknown parameters.
| (2) |
When the camera center is set to a vector (X0,Y0,Z0), the collinear equation for one object(or particle) can be expressed as P(X, Y, Z)=(aJq+X0,a2q+Z0), where q is an arbitrary vector and a1, a2, and a3 represents the corresponding terms that can be reconstructed from Equation (3). The cross-section position constructed from the following two collinear equations for the two cameras were defined as the 3D positions in the absolute coordinate.
| (3) |
t and s were obtained by the least square method. The coefficients (a11, a12, a13) and (b11, b12, b13) represent the corresponding terms that can be reconstructed from Equation (2) for camera 1, whereas (a21, a22, a23) and (b21, b22, b23) for camera 2. The cross-sectional points do not always intersect at one point because of measurement uncertainties. Therefore, the center of the shortest distance between the two collinear equations was used as the final 3D position of the object defined as Equation (4).
| (4) |
where XA, YA, and ZA represent the absolute coordinates for Camera A defined by Equation (3), and XB, YB, and ZB represent the absolute coordinates for Camera B. After obtaining the positions of the vector grid points (vector start points), the 3D vector terminals were obtained by vector addition with the two sets of two-dimensional vector terminals obtained by the same method used by Cho et al. [14], who adopted the gray-level cross-correlation method (Kimura et al., 1986). The Gaussian fitting method (Huang et al., 1997) was also adopted to attain the sub-pixel resolution. The interrogation size for the correlation calculation was set to 32 × 32 and the calculation grid to 42 × 21.
The measured velocity components U, V, and W were defined as the horizontal, vertical, and azimuthal components, respectively. The measured velocities were normalized with time mean velocity calculated from the flow rate.
3. Results and Discussion
3.1 Raw image of particles without swirl
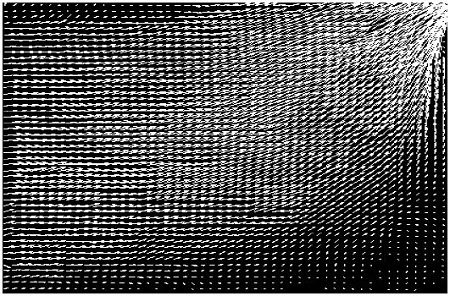
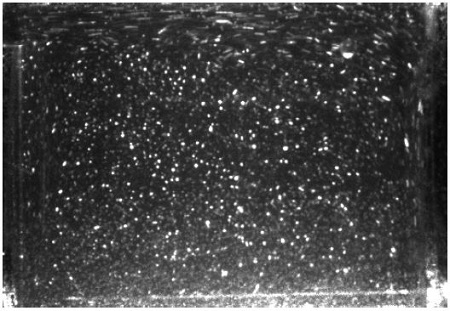
Figure 3 shows the raw image of particles at the entry of the front baffle without swirling flow. The calculated velocity vectors of the particles are shown in Figure 4 for the parallel flow at Re = 7,200. The movement of particles is slightly slow along the tube wall and near the baffle, but faster at the upper opening of the front baffle. The baffle is considered a barrier to the flow of the particles. Figure 4 demonstrates the velocity vectors of particles between the test tube and the front baffle. The vector profiles are concentrated on the upper opening of the front baffle and then rapidly passed through the gap.
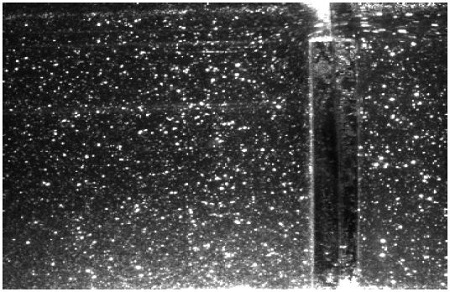
Raw image of particles at the entry of the front baffle without swirl for parallel flow at Re = 7,200.
Figure 5 shows the raw image of the particles between two baffles without swirl for the parallel flow at Re = 7,200. The particles are slightly faster at the outlet of the upper opening of the front baffle, and then moved down near the rear baffle to pass through its lower opening. However, some particles moved to the opposite side of the rear baffle, making weekly bigger circles between the two baffles.
The movement of the particle flow from the opening of the front baffle is considered fast.
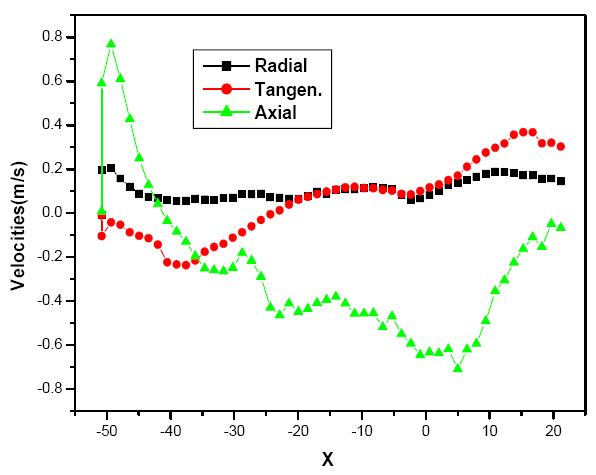
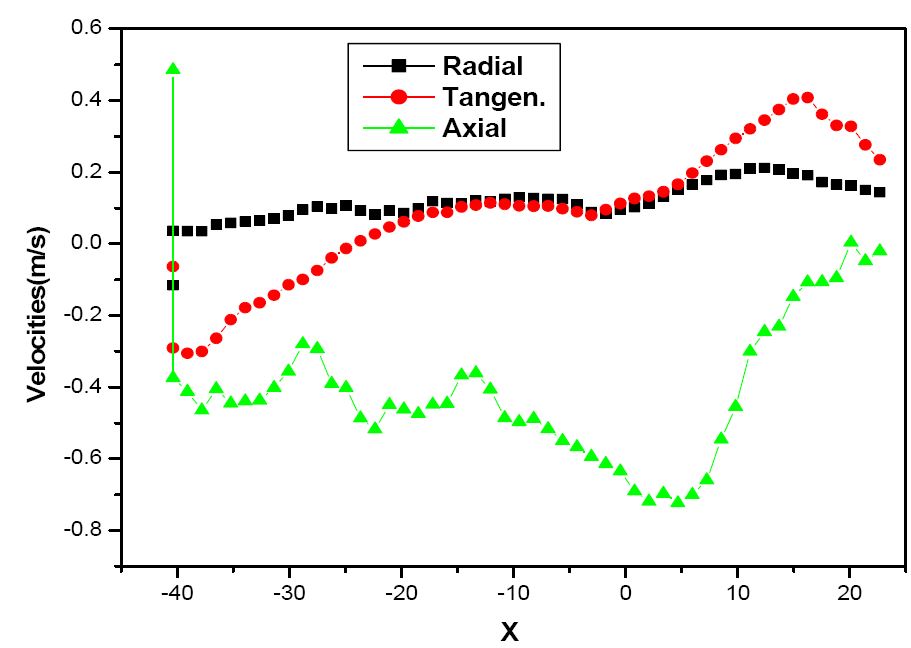
Figure 6 shows the local velocities of the particles between the two baffles without swirl. As expected, the axial velocity is bigger than the tangential and radial velocities near the opening. In this velocity, the particles move fast from the outlet of the upper opening of the front baffle. However, the axial velocity decreases along the X and the velocity indicates negative and then increases when the particles move to the lower opening of the rear baffle or circulate between two baffles. Further more, the tangential and radial velocities between two baffles do not significantly change, except for the surrounding of the opening of the rear baffle.
Figure 7 is demonstrated axial velocities along with y varying for without swirl flow at Re=7,200. The axial velocity profile near upper wall(y=-796) is showing positive values, but they are slowly decreased along with the distance of x. But, the velocities are very fluctuated at y=0.232(near the center line), it is considered the recirculating flow between two baffles. However, this values are increased near the opening of the rear baffle for exhausting through it.
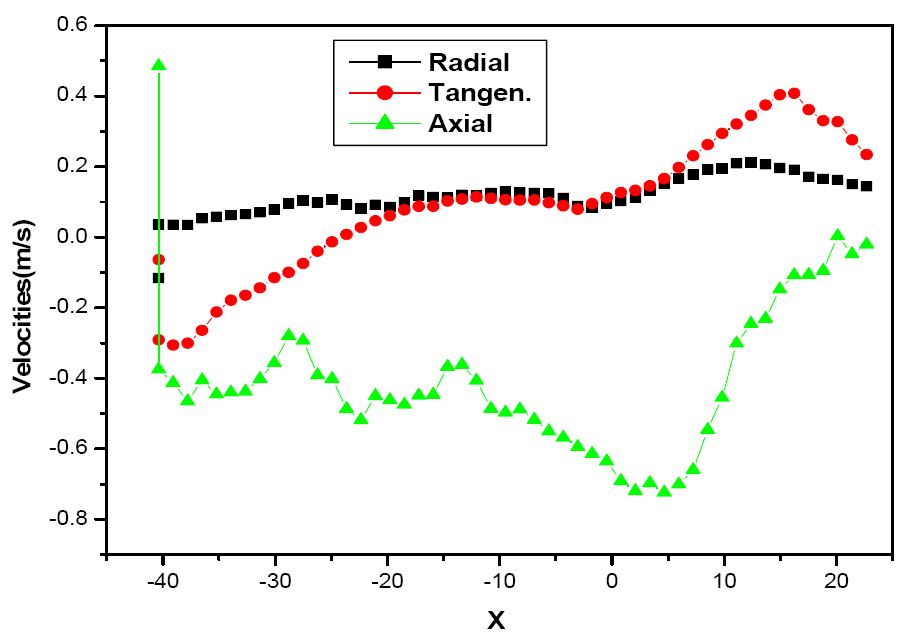
Figure 8 shows the local velocity profiles for the counter flow without swirl. The axial velocities showed higher values at the outlet of the lower opening, and then steeply decreased between two baffles. However, the values increased near the rear baffle. The tangential and radial velocities gradually increased along the distance of the two baffles. In comparisons with two Figs, the whole contour of velocities profiles are not much changed except tangential velocity.
4. Numerical Analysis
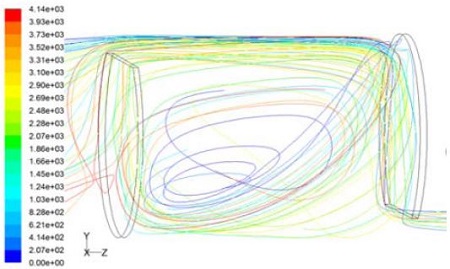
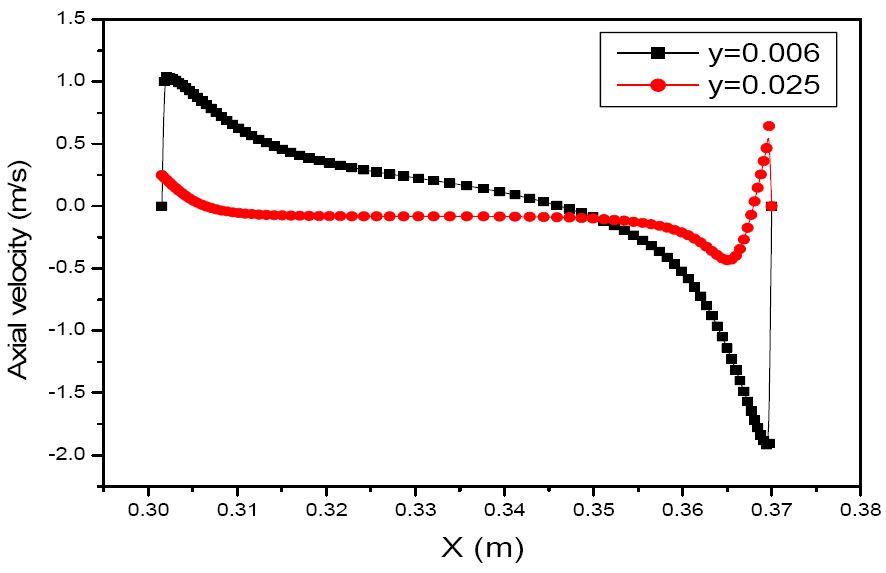
Numerical simulations were conducted to investigate the effects of the baffle and obtain the velocity profiles between the two baffles. In this study, a commercial CFD package, Fluent 6.3.21, and turbulent flow modeling, k-ε model, are adopted. Uniform velocity and pressure outlet are used for boundary conditions for without swirl. In this section, the Reynolds number is employed from experimental works. Figure 9 depicts the path lines for parallel flow without swirl. The lines are moved out through the upper opening that shows flow recirculations between two baffles, and then moved out through the lower opening. From this path line, the axial velocities are calculated and depicted at y = 0.006 and 0.025 (m), as shown in Figure 10. The axial velocity at y = 0.006 indicates nearly zero value around the front baffle, and then sharply increases from the opening flow. This velocity smoothly decreases along the distance of two baffles, and then a negative value is displayed near the rear baffle. However, this velocity suddenly increases around the lower opening. The velocity is supposed to be abruptly increased at the lower opening of the rear baffle. This feature is showed that of the experimental axial velocities at Re=7,200 and y=-0.388. This Reynolds number is employed identical value with experimental results.
5. Conclusion
1. 3D PIV system is employed for experimental work. The movement of particles is slightly slow along the tube wall and near the baffle without swirl for the parallel flow, but very fast at the upper opening of the front baffle. The particles are slightly faster at the outlet of the upper opening of the front baffle, and then moved down near the rear baffle to pass through its lower opening. However, some particles moved to the opposite side of the rear baffle, making weekly bigger circles between the two baffles.
2. From the local velocities of the particles between the baffles without swirl for the parallel flow, the axial velocity is bigger than tangential and radial velocities. The axial velocities are varied along with the y values between the two baffles, or the velocities are very fluctuated at y=0.232(near the center line), it is considered the recirculating flow between two baffles. But this values are increased near the opening of the rear baffle for exhausting through it.
3. Numerical studies have been conducted to obtain axial velocity profiles and path line without swirl at the parallel flow between two baffles. The path lines are moved out through the upper opening that shows flow recirculations between two baffles, and then shifted through the lower opening. From this path line, the axial velocities are calculated, these velocity smoothly decreases along the distance of two baffles, and then a negative value is displayed near the rear baffle. However, these velocity suddenly increase around the lower opening.
The velocities are supposed to be abruptly increased at the lower opening of the rear baffle. This feature is showed that of the experimental axial velocities at Re=7,200 and y=-0.388. The Reynolds number is employed identical value with experimental results.
Acknowledgments
This research was supported by the ReSEAT program funded by the Ministry of Science, ICT and Future Planning through the National Research Foundation of Korea and the Korea Lottery Commission grants. It is also partly supported by Kyungnam University and Korea Marine University.
References
-
B. B. Gupta, J. A. Howell, D. Wu, and R. W. Field, “A helical baffle for cross-flow microfiltration,”, Journal of Membrane, 99, p31-42, (1995).
[https://doi.org/10.1016/0376-7388(94)00241-P]

-
J. J. Dijk, A. C. Hoffmann, D. Cheesman, and J. G. Yates, “The influence of horizontal internal baffles on the flow pattern in dense fluidized beds by X-ray investigation,”, Power Technology, 98, p273-278, (1998).
[https://doi.org/10.1016/S0032-5910(98)00069-2]

- C. Tomasz, and B. Andrzej, “Method of calculation of new cyclone-type separator with swirling baffle and bottom take off of clean gas-part I : Theoretical approach,”, Chemical Engineering and Processing, 441, p441-448, (2000).
- D. Leith, and W. Leith, “The collection efficiency of cyclone-type particle collectors-a new theoretical approach,”, American Institute of Chemical Engineers Symposium Series, 68(126), p196-206, (1972).
-
L. Du, J. Zh, Yao, and W.G. Lin, “Experimental study of particle flow in a gas-solid separator with baffles using PDPA,”, Journal of the Chemical Engineering, 108, p59-67, (2005).
[https://doi.org/10.1016/j.cej.2004.12.043]

-
D. Rensheng, Y. A. Davis, Y. Mak, and C. H. Wang, “Taylor vortex flow in presence of internal baffles,”, Chemical Engineering Science, 65, p4598-4605, (2010).
[https://doi.org/10.1016/j.ces.2010.05.001]

-
H. Asgharzdeh, B. Firoozabadi, and H. Afshin, “Experimental in investigation of effects of baffle configurations on the performance of a secondary sedimentation tank,”, Scientia Iranica B, p938-949, (2011).
[https://doi.org/10.1016/j.scient.2011.07.005]

-
J. Mahboubeh, K. M. Mostafa, D. Reza, M. Z. Fathollah, and M. Masoud, “Three-dimentional simulation of turbulent flow in a membrane tube filled with semi-circular baffles,”, Desalination, 294, p8-19, (2012).
[https://doi.org/10.1016/j.desal.2012.02.031]

-
L. P. Nguyen, and I. Kazuide, “Experimental and numerical study of airflow pattern and particle dispersion in a vertical ventilation duct,”, Building and Environment, 59, p466-481, (2013).
[https://doi.org/10.1016/j.buildenv.2012.09.014]

-
N. Xesus, B. J. Taylor, G. Hector, C. Ignasi, and M. R. Mackley, “Experimental and computational modeling of oscillatory flow within a baffled tube containing periodic-tri-orifice baffle geometries,”, Computers and Chemical Engineering, 49, p1-17, (2013).
[https://doi.org/10.1016/j.compchemeng.2012.09.015]

-
S. Mahdi, R. Fatemeh, M. Azlin, M. Said, and Syafalni, “Numerical modeling of baffle location effects on the flow pattern of primary sedimentation tanks,”, Applied Mathematical Modeling, 37, p4486-4496, (2013).
[https://doi.org/10.1016/j.apm.2012.09.060]

-
J. F. Yang, M. Zeng, and Q. W. Wang, “Effects of sealing strips on shell-side flow and heat transfer performance of a heat exchanger with helical baffles,”, Applied Thermal Engineering, 64, p117-128, (2014).
[https://doi.org/10.1016/j.applthermaleng.2013.11.064]

-
D. H. Doh, T. G. Hwang, and T. Saga, “3D-PTV measurements of the wake of a sphere,”, Measurements Science Technology, 15, p1059-1066, (2004).
[https://doi.org/10.1088/0957-0233/15/6/004]

-
G. R. Cho, M. Kawahashi, H. Hirahara, and M. Kitadume, “Application of stereoscopic particle image velocimetry to experimental analysis of flow through multiblade fan,”, Journal of the Japan Society of Mechanical Engineers International Series B, 48(1), p25-33, (2005).
[https://doi.org/10.1299/jsmeb.48.25]


