An experimental study on the effect of plastic sheet thickness on gas explosion load profiles generated in a vented cylindrical chamber
Copyright © The Korean Society of Marine Engineering
This is an Open Access article distributed under the terms of the Creative Commons Attribution Non-Commercial License (http://creativecommons.org/licenses/by-nc/3.0), which permits unrestricted non-commercial use, distribution, and reproduction in any medium, provided the original work is properly cited.
Abstract
Many researchers have performed gas explosion experiments by enclosing a cloud of gas in a plastic sheet made of polyethylene or polypropylene. However, in most cases, the plastic sheet is used without considering the effects of its geometrical and material properties. Therefore, the generated gas explosion load profiles may vary depending on the properties of the sheet material used in the experiment. This study experimentally investigated the effect of plastic sheet thickness on the explosion overpressure of hydrogen and selected hydrocarbon gases. One-side-open (vented) cylindrical explosion chambers were manufactured, and plastic sheet thickness was varied from 0.05 to 0.3 mm. The experimental results for the explosion overpressure of hydrogen gas showed that the overpressure varied with plastic sheet thicknesses by a factor of up to 7. It was found that the explosion overpressure of explosive gases is a unique distinguishing characteristic and that it is necessary to identify the plastic sheet effect in gas explosion experiments. The results of this study suggest that thinner plastic sheets promote the formation of realistic gas cloud volumes and shapes. The study results can also be used for further structural analysis and numerical modelling of the proper of gas explosion loads with explosion overpressure profiles tailored to the circumstances of the experimental explosion.
Keywords:
Hydrogen gas, Hydrocarbon gas, Gas explosion test, Plastic sheet, Explosion load profile1. Introduction
Numerous experimental and numerical studies have been conducted on the explosion characteristics of hydrogen and hydrocarbon gases for the safety design of flammable and explosive gases.
Wähner et al. [1] used logistic regression to statistically analyse the minimum ignition energy (MIE) levels of hydrogen, ethene, and propane. They utilised both existing MIE test results and new measurements to explore the conditions necessary to apply this approach. Mukhim et al. [2] investigated the applicability of the existing methods used to calculate the overpressure induced by a vapour cloud explosion to the prediction of overpressures from unrestricted hydrogen explosions. Bao et al. [3] conducted an emission explosion test on 29 batches of methane–air mixtures in a 12-m3 concrete chamber to investigate the effects of methane concentration and discharge pressure on the internal over pressure. Cao et al. [4] performed an exhaust explosion experiment involving a hydrogen–air mixture in a 2-m-long cylindrical tube to study the influence of hydrogen concentration and exhaust burst pressure. Two types of cardboard covers (thicknesses: 0.28 and 0.48 mm) were used to create an explosive environment in the tube. Using the FLame ACcelerator Simulator-Computational Fluid Dynamics (FLACS-CFD) software [6], Zhu et al. [5] investigated the overpressure of methane–air bursts in a large-scaled straight tunnel, performed experiments on three scales, and verified the volumetric effects; the effects of the methane–air concentration, blockage rate, tunnel length, and cross section were studied. Li et al. [7] conducted an explosion test on a premixed methane–air mixture in a 0.8 × 0.8 × 30-m3 tube and found that the presence of an outlet reduced the maximum pressure by 13–91% and increased the travel distance of the flame inside the tube. Zhang et al. [8] studied the explosive properties of unconstrained clouds through numerical simulations. They considered stoichiometric concentrations of hydrogen–air, propane–air, and methane–air. Unlike the explosion overpressure, the explosion temperatures of the investigated mixtures did not differ much. Wang et al. [9] investigated the effects of hydrogen concentration and sheet thickness on blast emissions from small-scaled obstructed rectangular vessels. As the hydrogen concentration increased, the time to reach the maximum overpressure increased slightly, and the maximum overpressure increased monotonically with the film thickness. The experimental results revealed that the explosion pressure increased monotonically with the film thickness (0.02, 0.04, 0.06, 0.08, and 0.10 mm). Wakabayashi et al. [10] measured the detonation pressure of a hydrogen–air mixture by wrapping a cylinder and a rectangular explosive tent with a thin plastic sheet (0.05–0.3 mm) and obtained data on the hydrogen–air mixture. Shirvill et al. [11] experimentally analysed the explosive overpressure of hydrogen–methane mixtures in a tent experiment in which the explosion chamber was wrapped in a plastic sheet. The effect of the plastic sheet (ignoring the effect of the plastic sheet thickness) on congestion inside the explosion chamber was experimentally analysed to study the change in the explosive overpressure of the mixture. Sato et al. [12] experimentally confirmed hydrogen detonation using a 37-m3 hydrogen tent and 0.008–0.025-mm thin films.
Numerous researchers have studied combustible gas leak accidents using experimental and numerical approaches to identify the consequences of explosions and determine the accidental design loads. Various experimental methods are available to create an explosive gas cloud for measuring the explosion load profiles of a combustible gas or mixture of gases, but the most common method is to use a plastic sheet. However, investigations on the effects of the material properties of the plastic sheet have been inadequate, and given too broad and general in the literature. Apart from the gas concentration and environmental effects, plastic sheet effects could also be a governing factor in idealised gas explosion testing. Therefore, it is necessary to identify the dependence of gas explosion load profiles on the properties of the plastic sheet material used in the experiment.
In this study, the effect of plastic sheet thickness on the explosion overpressure and other explosive properties (rise time, duration, and impact) of hydrogen was evaluated. In addition, these characteristics were compared with those of selected hydrocarbon gases (butane, methane, and LPG [98% propane]).
2. Explosion testing
2.1 General gas explosion load characteristics
The explosive properties of combustible substances depend on the phase and the physical and chemical properties of the substance (e.g., heat capacity, vapour pressure, and the heat of combustion). Chemical explosions are caused by chemical reactions. The reaction between a combustible substance and an explosive substance result in an oxidation reaction and a decomposition reaction. From a chemical perspective, an explosion can be defined as the rapid increase in the rate of a reaction in a system; from a physical perspective, it is the rapid expansion of energy or matter under certain conditions.
In general, in enclosed or partially enclosed spaces such as inside a ship, an explosion occurs when a flammable gas leaks and encounters an ignition source. Explosions also transmit high temperatures and shock waves to the surroundings, which can injure people—sometimes fatally—and damage property.
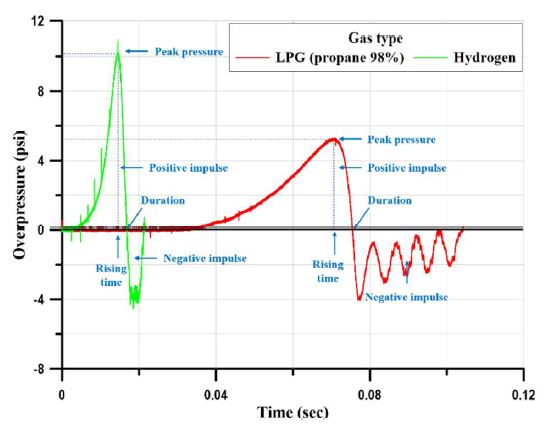
Figure 1 shows the typical time–pressure relationship for the explosion of hydrocarbons (LPG [98% propane]) and hydrogen gases [13]. The explosive behaviour of combustible gases generally depends on the characteristics of each gas ignited in an explosive environment. Irrespective of the gas, a positive pressure forms after the maximum explosive overpressure is reached during the rising time.
Over time, the positive pressure reaches the negative-pressure zone and then enters the atmospheric pressure state. Detonation differs from deflagration in the amount of impulse generated in the overpressure region. In deflagration, the impulse generated in the overpressure region is comparable to that in the negative-pressure region [14].
Numerous researchers have experimentally investigated gas explosions to obtain and understand gas explosion load profiles. Gas explosion experiments are performed by enclosing a cloud of gas in a plastic sheet made of polyethylene or polypropylene. However, as the effects of the thickness and properties of the plastic sheet are usually not considered, the experimental assumptions and results may vary with the characteristics of the plastic sheet. Therefore, the generated gas explosion load profile may be dependent on the characteristics of the sheet.
2.2 Method and apparatus used in the explosion test
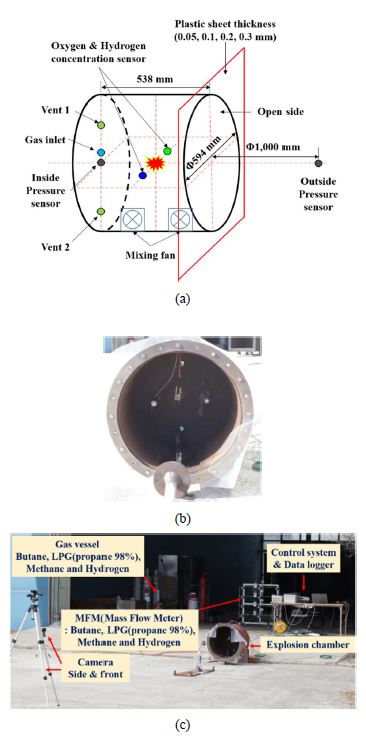
To minimise the effect of the internal explosion pressure due to the internal shape, an explosion experiment was conducted in a one-side-open (vented) cylindrical explosion chamber which is widely used in ships and offshore ventilation and piping system. Figure 2 shows the device installed for explosion testing.
The explosion test scenarios are shown in Table 1. The test was repeated three times for each scenario.
The cylindrical explosion chamber was manufactured to the following specifications: a volume of 0.149 m3, material SS275, and a plate thickness of 10 mm. Plastic sheets of four thicknesses were installed in the open side of the chamber.
Explosion-induced overpressure is an important characteristic of explosions. A 100-psi pressure sensor (113B27, PCB Piezotronics, United States) was used for pressure measurements. A pressure sensor was installed in the centre of the side opposite the open side to measure the explosion overpressure inside the explosion chamber, and another sensor was installed 1 m outside the open side to measure the external discharge overpressure.
Depending on the specific gravities of hydrogen and the hydrocarbon gases, the gas may be concentrated in the upper or lower parts of the explosion chamber; therefore, a mixing fan was installed to homogenise the concentration of the internal gas. Oxygen and hydrogen sensors were installed inside the explosion chamber to measure the gas concentrations.
The gas was injected into the explosion chamber, and a 30-lpm mass flow meter (TSM-D230, MFC KOREA) was used to control the flow rate. To measure the explosion pressure, 5,000,000/s of data were measured and analysed using the software Dewesoft X Professional.
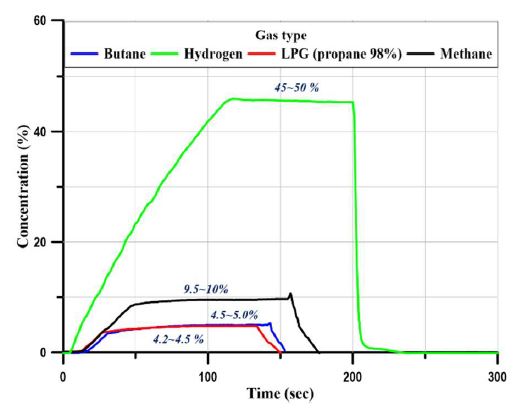
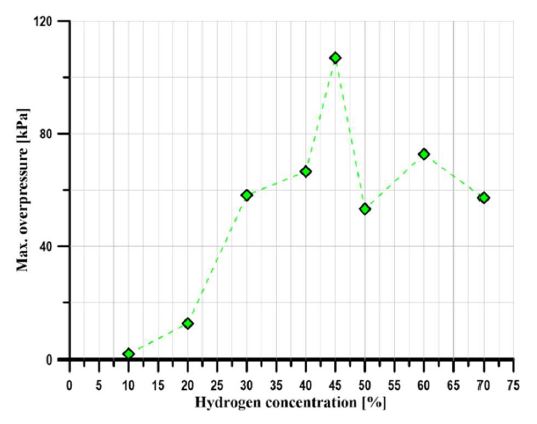
An experiment was conducted to compare the explosion overpressures of hydrogen and the hydrocarbon gases for various plastic sheet thicknesses. In explosion experiments, the concentration of each gas is an important variable. Most gases have a lower explosive limit (LEL) and an upper explosive limit (UEL). Within this range, the overpressure exhibits the characteristic of a curve with respect to the change in concentration. The stoichiometric ratio, the ratio of the amount of fuel to the amount of air required for the ideal combustion of a gas, is a unique property of each gas. However, the maximum explosion overpressure is measured at a slightly higher concentration value than the stoichiometric ratio due to the influences of the shape of the explosion chamber and environmental variables. The stoichiometric ratio of hydrogen is 28.5 ± 2%, but as shown in Figure 4, the concentration (45%–50%) at which the maximum explosive overpressure forms was confirmed based on the results of the preliminary experiment [13]. In addition, the scenario (see Table 1 and Figure 3) was selected as the concentration of each gas that forms the maximum explosion overpressure for hydrocarbon gases selected for comparison of hydrogen explosion overpressure. As the explosive ranges of the gases differ and hydrogen’s explosive range is wider than that of hydrocarbon gases, scenarios based on the maximum explosion overpressure were selected rather than scenarios with the same gas concentration. In addition, the rise time, duration, and impulse (i.e., the explosive characteristics) of the gases were calculated, compared, and analysed using the maximum explosion overpressure.
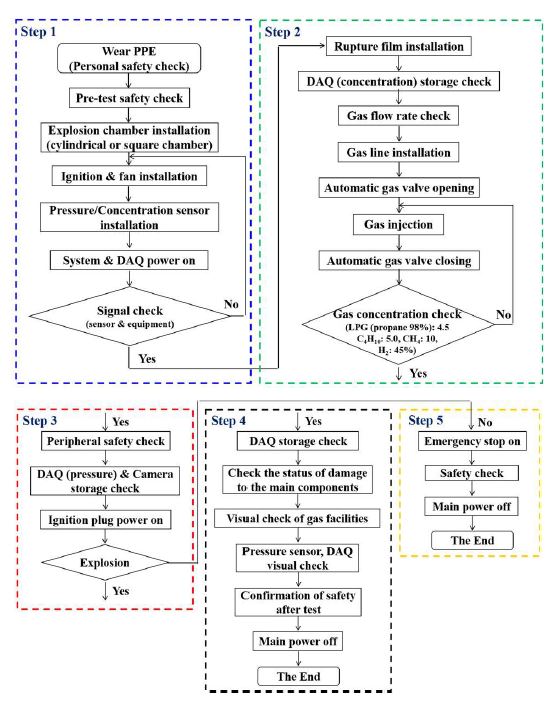
The explosion test procedure should be safe and ensure reliable data. Accordingly, the procedure was designed to be performed sequentially in five steps (Figure 5) as follows.
In Step 1 (the preparatory work before the explosion test), the explosion chamber, concentration sensor, spark plug, and pressure sensor are installed inside the explosion chamber, and power is applied to check the signal of each device. In Step 2, the explosive environment inside the explosion chamber is prepared as follows. To form a gas cloud, the plastic sheet is installed on the open surface of the explosion chamber. Gas is injected to determine the concentration of the target gas. In Step 3, the safety of the environment around the explosion site is verified, and data logging and image storage arrangements are made. After verifying that the preparatory steps have been completed, power is applied to the spark plug to trigger an explosion. In Step 4, the pressure data storage status after the explosion is checked, the safety of the explosion chamber and equipment is assessed, and mains power is turned off to end the test. Step 5 pertains to the case in which no explosion occurs. In this step, power to all devices is turned off, and the exhaust port is opened to release the trapped gas into the atmosphere.
3. Experimental results and considerations
The explosion experiment with the cylindrical explosion chamber was performed at least three times to ensure the reproducibility of each scenario shown in Table 1.
Figure 6(a) shows typical overpressure–time curves for the maximum plastic sheet thickness (0.3 mm) inside the chamber. The maximum overpressure was measured for hydrogen, LPG, methane, and butane. As expected, hydrogen exhibited the highest overpressure and the shortest duration time, whereas butane exhibited the lowest overpressure and the longest duration time. LPG and methane gases exhibited similar explosion load profiles. All overpressure values were lower in the load profiles outside the chamber (Figure 6(b)), but the trends were similar to those inside the chamber. The difference between the explosion load profiles can be explained by chemical reactions in terms of the number of atoms and their mass, as determined by the chemical composition of the gases.
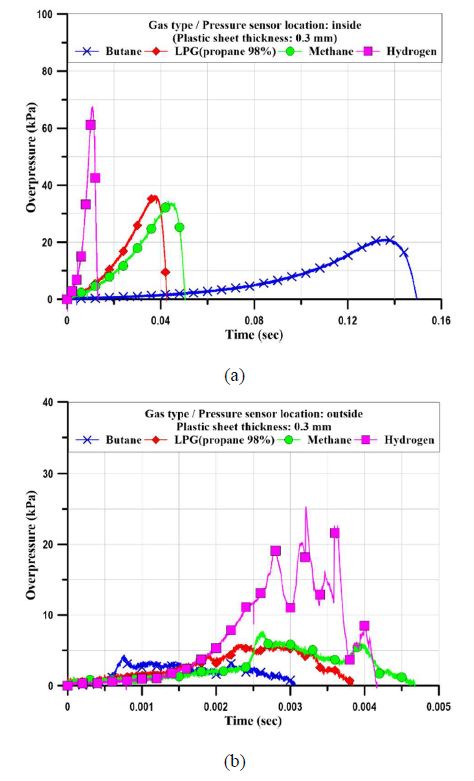
Overpressure–time profile for a plastic sheet thickness of 0.3 mm: (a) inside the chamber, (b) outside the chamber
An explosion load profile for the explosion of a combustible gas is usually generated as a pressure–time relationship curve and comprises parameters such as the overpressure, rising time, duration time, and impulse. When a flammable gas–air mixture is ignited within a confined enclosure, overpressure and impulse escalations are associated with the combustion process. The overpressure escalation is caused by the expansion of hot burnt flame/gas inside the confined space. It is this fast discharge of impulse (energy) with its associated overpressure rise and decay that defines a gas explosion. Therefore, all test results were analysed using the average value theorem of explosion overpressure, rising time, duration, and impulse for each scenario.
3.1 Effect of plastic sheet thickness on overpressure
Figure 7 presents the variation in the internal and external pressure (the average of three experiments) with the plastic sheet thickness.
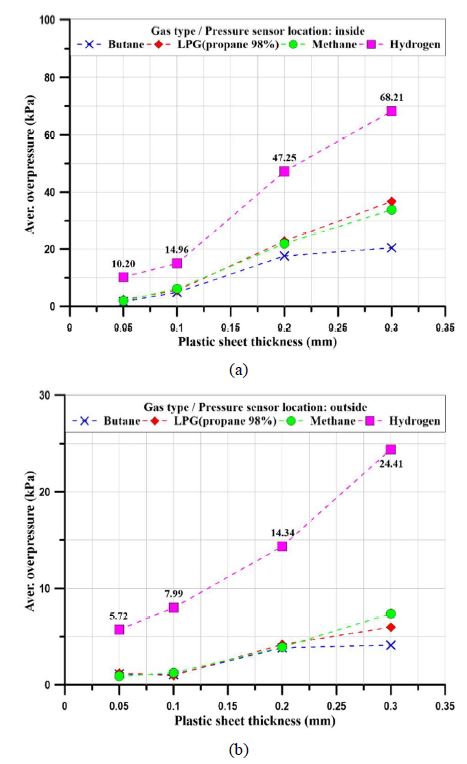
Comparison of the average overpressure for each gas: (a) inside the chamber, (b) outside the chamber
Figure 7(a) shows the internal explosion overpressure for each scenario. For all of the plastic sheet thicknesses, hydrogen’s explosive overpressure was higher than that of the hydrocarbon gases. Hydrogen is thought to form a high explosion overpressure because the reaction rate between hydrogen elements after ignition is faster than that in the hydrocarbon gases. In addition, it has been determined that the explosion overpressure of the hydrocarbon gases is lower than that of hydrogen at a reaction rate lower than that of hydrogen, due to the combination of carbon atoms.
The effect of the plastic sheet thickness was confirmed by the finding that the explosion overpressure increased with the plastic sheet thickness for all gases. For hydrogen, a thickness of 0.3 mm produced an approximately seven times higher overpressure than a thickness of 0.05 mm. As with all gases, it is thought that the thicker the plastic sheet, the greater its effect on the explosion overpressure on account of the greater resistance to the expansion of the discharged gas inside the chamber.
Figure 7(b) shows the external explosion overpressure for each scenario. The external overpressure tended to be lower than the internal overpressure due to the plastic sheet effect and the release of pressure into the atmosphere.
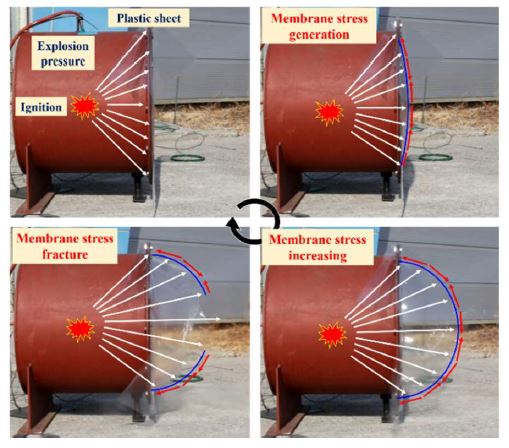
The effect of the plastic sheet thickness can be explained by the plastic sheet rupture process shown in Figure 8.
Internal ignition occurred at a flammable gas concentration (between the LFL and the UFL) in the chamber, after which the explosive overpressure increased and propagated in all directions. The vent (the open side) was covered with a plastic sheet. The increased overpressure reached the plastic sheet failure pressure due to the application of yield and rupture stress at the plastic sheet. This pressure is called the opening pressure.
The film ruptured as follows. When the overpressure reached the plastic sheet surface, bending stress was first induced. The predominant stress generated was membrane stress. As the internal explosive pressure increased further, the sheet’s membrane stress was exceeded and its rupture stress was reached. The film ruptured towards the region with lower membrane stress, and the internal overpressure was discharged into the atmosphere.
The membrane stress depends on the mechanical properties of the plastic sheet, such as its tensile strength. In general, the greater the thickness, the greater the tensile strength. Therefore, explosion load profiles can be generated for various plastic sheet thicknesses.
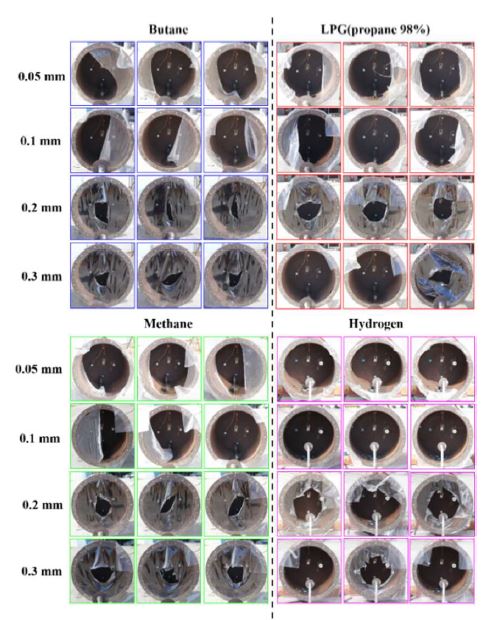
Figure 9 shows the plastic sheet rupture shape after the explosion tests. In the case of thinner plastic sheets (0.05 and 0.1 mm), the rupture, which affected the whole sheet of the open surface (the installed plastic sheet area), was irregularly shaped, and its location varied. However, for the thicker plastic sheets (0.2 and 0.3 mm), the rupture was located at the centre of the open surface.
3.2 Effect of plastic sheet thickness on rising time and duration time
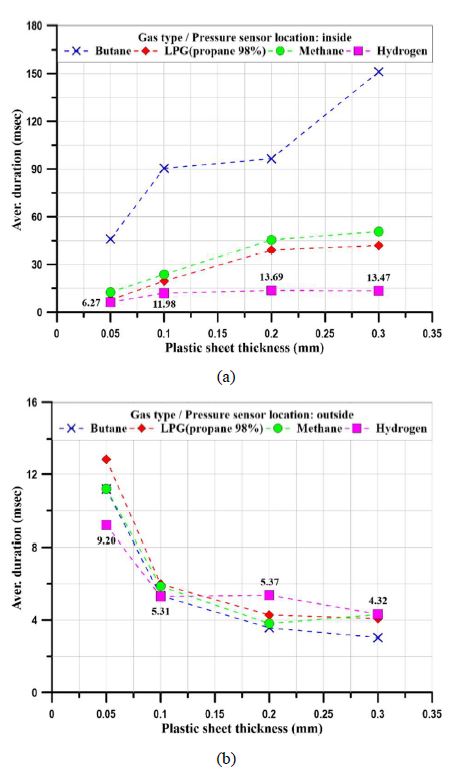
It is necessary to confirm the effect of the rising time (i.e., the time to reach the maximum overpressure) on the peak pressure (see Figure 1). Figure 10 shows the rising times inside and outside the explosion chamber plotted against the plastic sheet thickness.
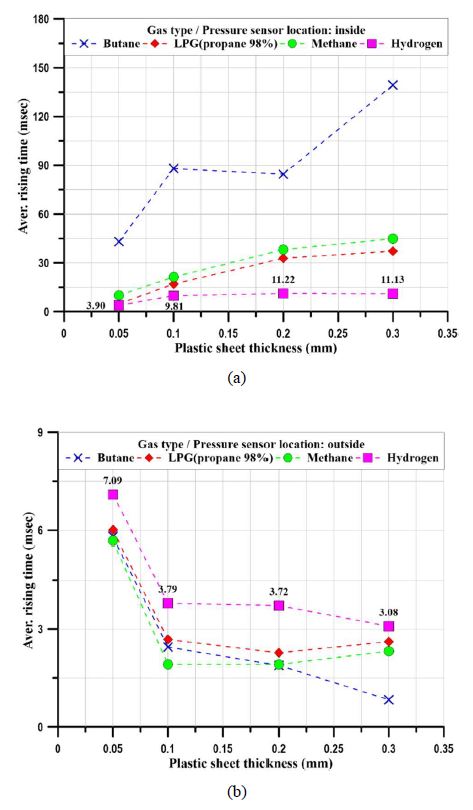
Rising times of gases versus plastic sheet thicknesses: (a) inside the chamber, (b) outside the chamber.
The rising time of all gases increased with the plastic sheet thickness inside the chamber, as shown in Figure 10(a). The hydrocarbon gases had a longer rising time than hydrogen. At long rising times, the slope of the graph up to the maximum explosion overpressure is low, and the slope for the hydrocarbon gases is gentler than that for hydrogen. Therefore, the difference in rising time between hydrogen and the hydrocarbon gases can be attributed to the faster reaction rate of hydrogen relative to that of the hydrocarbon gases.
Outside the chamber (i.e., 1.0 m away from the chamber), as shown in Figure 10(b), hydrogen had the longest rising time. As mentioned early, the rising time to withstand the overpressure of hydrogen by the plastic sheet is shorter than for the hydrocarbon gases. Therefore, because the overpressure of discharged hydrogen continued to be larger outside the chamber, its rising time was the longest.
The duration time of the positive pressure is one of the main factors determining the explosion characteristics and the calculation of the impulse energy. Figure 11 shows plots of the duration time against the plastic sheet thickness for the overpressure of the positive phase. The variation of the duration time is similar to that of the rising time of both hydrogen and the hydrocarbon gases. The results of the duration times obtained with various plastic sheet thicknesses can be explained by the plastic sheet rupture process, which discharges the overpressure propagations from inside the chamber to the outside.
3.3 Effect of plastic sheet thickness on impulse
Impulse is defined as the energy produced by an explosion, in contrast to overpressure, which occurs as a load. Impulse is generally an important design parameter for structures subject to impact loads. It can be calculated by integrating pressure with respect to time. Impulse can be expressed as follows:
| (1) |
where I is the impulse and P(t) is the explosion overpressure as a function of time. As P(t) increases with duration time, the impulse increases.
Figure 12 shows plots of impulse against plastic sheet thickness. The impulse is calculated as in Equation (1), which gives the area under the overpressure–time curves. The impulse increases when the overpressure is larger and the duration time is longer. The impulse varies in a similar manner as the overpressure and duration time.
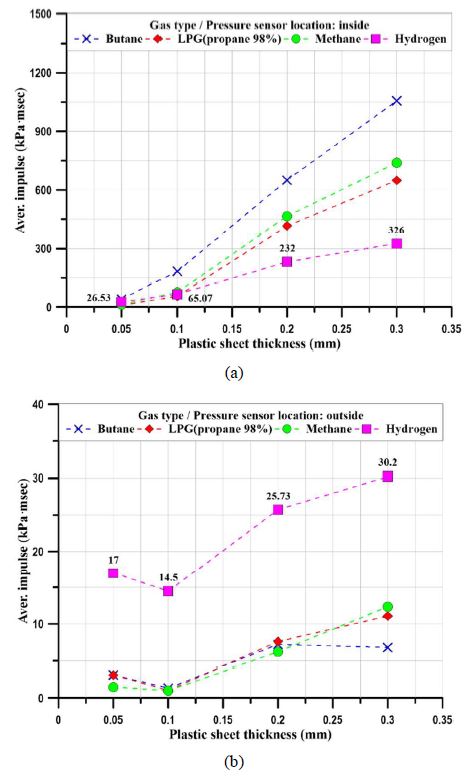
Impulse under different gas scenarios and varying plastic sheet thicknesses: (a) internal pressure, (b) external pressure
As per the investigation of previous results of the overpressure of hydrogen is greater than that of the hydrocarbon gases, but its duration time is very short; therefore, the impulse is calculated to be lowest inside the chamber. Hydrogen is calculated to have the highest impulse outside the chamber because it has the longest duration time.
3.4 Effect of plastic sheet thickness
It was confirmed that the explosion load profiles of hydrogen and the hydrocarbon gases are related to plastic sheet thickness through the sheet’s material properties and opening pressure.
Hydrogen has a higher overpressure than the hydrocarbon gases depending on the plastic sheet thickness inside the chamber. The overpressure difference increased by a factor of about 7 for a plastic sheet thickness of 0.3 mm. Outside the chamber, the overpressure increased by a factor of about 5 for the same plastic sheet thickness.
Hydrogen had the lowest duration time inside the chamber. However, outside the chamber, it was confirmed that the rising and duration times were affected by the plastic sheet thickness. The effect of long duration times was mostly observed with thicker plastic sheets. Hydrogen had the lowest impulse for a given plastic sheet thickness inside the chamber but the highest impulse outside the chamber. Therefore, it can be concluded that the explosion load profile varies with plastic sheet thickness.
4. Conclusions and remarks
This study experimentally investigated the dependence of explosion load profiles on plastic sheet thickness. The effect of plastic sheet thickness on explosion overpressure was found to be related to the change in material properties and the opening pressure with thickness.
The explosion experiment with hydrogen and selected hydrocarbon gases (butane, LPG [98% propane], and methane gas) revealed that plastic sheet thickness influences overpressure, rising time, duration time, and impulse. Hydrogen gas is not much influenced the plastic sheet effect induced by overpressure, but hydrogen observed as a lower effect on rising time, duration, and impulse compared with hydrocarbon gases.
The function of the plastic sheet in the experimental study was to enclose a cloud of flammable or explosive concentration of gases, which is an experimental technique used in the gas explosion test. The obtained experimental explosion load profiles are generally used in safety design or in investigations of explosion accidents. The explosion load profile may be distorted for various reasons. In particular, the plastic sheet characteristics should not affect the explosion load profile; therefore, the details of the plastic sheet material should be considered before testing. The plastic sheet used in experimental testing should be as thin as possible. Moreover, unlike hydrogen, hydrocarbon gases are combustible and contain carbon atoms. The hydrocarbon gases used in this experiment—butane, LPG (98% propane), and methane gas—have molecular weights of 58, 44, and 16 g/mol, respectively. The heavier the gas, the lower the explosion overpressure and the longer the rising time and duration time. These results are explained by the unique characteristic of each atom; thus, additional experiments and analyses that use atomic and molecular kinematics are required.
Acknowledgments
This study was a part of a project entitled ‘Development of guidance for leakage prevention and mitigation of consequences in hydrogen ships’ funded by the Ministry of Oceans and Fisheries, Korea.
Author Contributions
Conceptualisation, J. K. Seo and J. H. Kim; Methodology, S. W. Park, J. H. Kim, and J. K. Seo; Formal Analysis, S. W. Park; Investigation, S. W. Park and J. K. Seo; Resources, S. W. Park; Data Curation, S. W. Park; Writing Original Draft Preparation, S. W. Park; Writing Review and Editing, J. K. Seo; Visualisation, S. W. Park; Supervision, J. K. Seo; Project Administration, J. K. Seo; Funding Acquisition, J. H. Kim. All authors have read and agreed to the published version of the manuscript.
References
-
A. Wähner, G. Gramse, T. Langer, and B. Beyer, “Determination of the minimum ignition energy on the basis of a statistical approach,” Journal of Loss Prevention in the Process Industries, vol. 26, no. 6, pp. 1655-1660, 2013.
[https://doi.org/10.1016/j.jlp.2013.06.002]

-
E. D. Mukhim, T. Abbasi, S. M. Tauseef, and S. A. Abbasi, “A method for the estimation of overpressure generated by open air hydrogen explosions,” Journal of Loss Prevention in the Process Industries, vol. 52, pp. 99-107, 2018.
[https://doi.org/10.1016/j.jlp.2018.01.009]

-
Q. Bao, Q. Fang, Y. Zhang, L. Chen, S. Yang, and Z. Li, “Effects of gas concentration and venting pressure on overpressure transients during vented explosion of methane–air mixtures,” Fuel, vol. 175, pp. 40-48, 2016.
[https://doi.org/10.1016/j.fuel.2016.01.084]

-
Y. Cao, Y. Wang, X. Song, H. Xing, B. Li, and L. Xie, “External overpressure of vented hydrogen-air explosion in the tube,” International Journal of Hydrogen Energy, vol. 44, no. 60, pp. 32343-32350, 2019.
[https://doi.org/10.1016/j.ijhydene.2019.10.086]

-
Y. Zhu, D. Wang, Z. Shao, X. Zhu, C. Xu, and Y. Zhang, “Investigation on the overpressure of methane-air mixture gas explosions in straight large-scale tunnels,” Process Safety and Environmental Protection, vol. 135, pp. 101-112, 2020.
[https://doi.org/10.1016/j.psep.2019.12.022]

- FLACS v10.9, User’s Manual, 2019.
-
Z. Li, L. Chen, H. Yan, Q. Fang, Y. Zhang, H. Xiang, Y. Liu, and S. Wang, “Gas explosions of methane-air mixtures in a large-scale tube,” Fuel, vol. 285, 2021.
[https://doi.org/10.1016/j.fuel.2020.119239]

-
Q. Zhang and D. Li, “Comparison of the explosion characteristics of hydrogen, propane, and methane clouds at the stoichiometric concentrations,” International Journal of Hydrogen Energy, vol. 42, no. 21, pp. 14794-14808, 2017.
[https://doi.org/10.1016/j.ijhydene.2017.04.201]

-
X. Wang, C. Wang, X. Fan, F. Guo, and Z. Zhang, “Effects of hydrogen concentration and film thickness on the vented explosion in a small obstructed rectangular container,” International Journal of Hydrogen Energy, vol. 44, no. 40, pp. 22752-22759, 2019.
[https://doi.org/10.1016/j.ijhydene.2018.12.207]

- K. Wakabayashi, T. Mogi, D. Kim, T. Abe, K. Ishikawa, E. Kuroda, T. Matsumura, Y. Nakayama, S. Horiguchi, M. Oya, and S. Fujiwara, “A field explosion test of hydrogen-air mixtures,” International Conference on Hydrogen Safety, 2005.
-
L. C. Shirvill, T. A. Roberts, M. Royle, D. B. Willoughby, and P. Sathiah, “Experimental study of hydrogen explosion in repeated pipe congestion – Part 2: Effects of increase in hydrogen concentration in hydrogen-methane-air mixture,” International Journal of Hydrogen Energy, vol. 44, no. 5, pp. 3264-3276, 2019.
[https://doi.org/10.1016/j.ijhydene.2018.12.021]

-
Y. Sato, H. Iwabuchi, M. Groethe, E. Merilo, and S. Chiba, “Experiments on hydrogen deflagration,” Journal of Power Sources, vol. 159, no. 1, pp. 144-148, 2006.
[https://doi.org/10.1016/j.jpowsour.2006.04.062]

-
S. W. Park, J. H. Kim, and J. K. Seo, “Explosion characteristics of hydrogen gas in varying ship ventilation tunnel geometries: An experimental study,” Journal of Marine Science and Engineering, vol. 10, no. 4, p. 532, 2022.
[https://doi.org/10.3390/jmse10040532]

- I. Sochet, “Blast effects of external explosions,” 8th International Symposium on Hazards, Prevention, and Mitigation of Industrial Explosions, HAL Open Science, Yokohama, Japan, HAL Id: hal-00629253, 2010.

