Real-time work intensity estimation algorithm based on deep learning using heart rate and skin temperature
Copyright © The Korean Society of Marine Engineering
This is an Open Access article distributed under the terms of the Creative Commons Attribution Non-Commercial License (http://creativecommons.org/licenses/by-nc/3.0), which permits unrestricted non-commercial use, distribution, and reproduction in any medium, provided the original work is properly cited.
Abstract
In harsh environments where high-intensity work is performed, predicting the work intensity based on the vital signs of a worker can be useful in preventing accidents. Considering existing worker management systems are analyzed using set thresholds, they cannot resolve variables caused by individual differences. Therefore, we propose an algorithm to estimate the work intensity of workers based on their heart rate and body temperature using a deep learning-based 1D CNN-LSTM model. The proposed algorithm uses time-series signals of 60 s to accurately estimate the work intensity by considering the time-series characteristics. In addition, the proposed algorithm considers the individual differences in bio-signals by extracting and using data from the exercise and rest states of workers. To verify the performance of the proposed algorithm, we compared estimation performance factors such as model accuracy, precision, recall, and F1 score with those of various models; the results showed a high estimation accuracy of 99.96%. We believe the proposed algorithm can help minimize damage by preemptively responding to unexpected accidents that may occur at work sites by accurately estimating the work intensity based on the individual differences among workers.
Keywords:
Work intensity estimation, 1D CNN, LSTM, Deep learning1. Introduction
Owing to the recent development of smart devices and sensors, many user-centered services based on various bio-signals have been developed [1]-[4]. Wearable devices such as smartwatches measure heart rate, blood pressure, and electrocardiogram provide highly reliable health indicators according to the user's real time activity. The user's bio signal measured through a wearable device is crucial in determining the real-time physical condition, and their safety can be derived by predicting the condition. In particular, in harsh environments where high-intensity work is performed, such as ships and steel mills, the prediction of work intensity based on the worker's vital signs can help improve safety management and prevent accidents [5]-[6].
An increase in physical activity owing to an increase in the work intensity indicates an increase in the amount of oxygen required for muscle activity. To supply the oxygen required, certain changes occur in the body, such as increased respiration and heart rate and skin temperature. In particular, when the heart rate increases during high-intensity work, the skin temperature rises, which decreases the work efficiency, causing severe fatigue and low concentration, leading to serious accidents. Therefore, there is a need for a method of estimating the work intensity by grasping the real-time biometric information of the worker, such as skin temperature and heart rate. Existing estimates of work intensity are directly related to the heart rate [7]-[8]. The Borg's Scale [9], a representative exercise intensity measurement index, is the most widely used method of estimation, and various studies have been conducted related to work intensity [10]-[11]. However, because the metric is a questionnaire-based reasoning method, it can be difficult to conduct real-time measurements. Therefore, based on the high correlation between Borg's Scale and the heart rate, several studies have combined activity perception and heart rate [12]-[13] and proved the relationship between heart rate and the intensity of physical activity. Therefore, the work intensity can be estimated in real time using the heart rate.
Existing worker management systems receive information such as the skin temperature, blood pressure, and the heart rate of workers, and analyze whether they pass a set risk level [14]-[15]. However, assigning the same criteria to all workers cannot resolve the variables caused by individual differences. Therefore, the worker management system requires a work intensity estimation algorithm that can be considered. The work intensity can be estimated using the heart rate, which was confirmed through the previous studies described above. Additionally, when the heart rate increases, the energy consumption and skin temperature increase, thereby indicating that the skin temperature changes according to the changes in the heart rate, and the work intensity can be estimated using the heart rate and skin temperature. Recently, many studies have been conducted to solve various problems by learning bio-signals using deep learning models [16]-[17]. By using a deep learning-based method, the model can learn the characteristic patterns of various signals, and representative features can be extracted from the information of bio signals with individual differences.
This study proposes a deep learning-based real-time work intensity estimation algorithm that uses heart rate and skin temperature information to determine a worker’s rest and physical activity states. The proposed algorithm measures the heart rate and skin temperature information using the Fatigueset's wrist wearable device and extracts the rest state information and physical activity state information from the dataset. Furthermore, the proposed deep learning-based 1D CNN-LSTM is used to determine the extracted biometric information as a time series and estimate the work intensity in the current state according to the rest, physical activity, heart rate, and skin temperature. The proposed algorithm simultaneously uses the remaining state information and the physical activity state information. This algorithm can determine individual differences in biometric information, and the data aspects according to time series can be obtained by processing the heart rate and skin temperature information using a sliding window technique.
The remainder of this paper is organized as follows. Section 21D describes the CNN-LSTM and related research. Section 3 explains the structure of the proposed method and the data preprocessing methods. In Section 4, the performance is evaluated by comparing the model accuracy, precision, recall, and F1 score for the detailed settings and dataset descriptions for the experiment of the proposed method. The experimental results and conclusions are presented in Section 5.
2. Related research and theories
2.1 Related research
The work intensity can be estimated using the heart rate, which was confirmed through previous studies. In addition, when the heart rate increases, energy consumption and skin temperature increase, thereby indicating that the skin temperature changes according to the changes in the heart rate, and the work intensity can be estimated using the heart rate and skin temperature [16][17]. Recently, many studies have been conducted to solve various problems by learning bio signals using deep learning models [18][19]. Using a deep learning-based method, the model can learn the characteristic patterns of various signals to extract representative features from the information of bio-signals with individual differences.
Padraig et al. [20] classified work intensity with a very simple binary classification system using a CNN based on activity data recorded by a smartwatch. The proposed algorithm compared and analyzed the data measured based on Borg's scale with machine learning algorithms such as Support Vector Machine (SVM) and DTW. However, it was difficult to estimate real-time task intensity considering the proposed CNN-based algorithm classifies data by post-processing rather than real-time processing. In particular, the performance of DTW, which is a real-time processing method, was lower.
Darbandy et al. [21] proposed a method for monitoring and detecting occupational physical fatigue using heart rate measurement of a wearable device. It can quickly determine the heart rate signal by determining the similarity using the KNN. However, the proposed method is difficult to apply universally, depending on the environment, given that the user characteristics are not considered. Therefore, it is necessary to study a discrimination algorithm for real-time work intensity based on a user's biological characteristics.
2.2 1D CNN-LSTM structure
A CNN is a network that can extract spatial features of data, and an LSTM [22] is a network that can learn features of time-series data. CNN-LSTM. These two structures combined can learn the features of time-series data and two-dimensional data together. Because 1D CNN filter 1D data, their features can be obtained from 1D sensor data, and by learning time-series information through LSTM, it shows excellent performance in classifying and estimating time-series data. The 1D CNN-LSTM structure is used in signal-based technologies such as healthcare and RADAR-based Human Activity Recognition (HAR). Shoeibi et al. [23] proposed a model capable of automatically diagnosing schizophrenia by processing an EEG, which is a brain wave signal using a 1D CNN-LSTM structure. This study was conducted to determine whether it is schizophrenia using a 1D CNN-LSTM model by combining graphs according to various electrodes of the EEG signal into one image. The results showed that it is easy to process bio signals by using 1D CNN and LSTM simultaneously. Zhu et al. [24] proposed a model that learns the characteristics of frequency change using 1D CNN-LSTM of the 2D spectrogram of the radar signal in radar-signal-based HAR and classified behavior through LSTMs. The model proposed in this study showed a similar performance to other models using a 2D CNN. Through these studies, the structure of 1D CNN-LSTM can effectively obtain good results in the learning model of time-series data.
3. Proposed Algorithm
3.1 Overview of the proposed algorithm
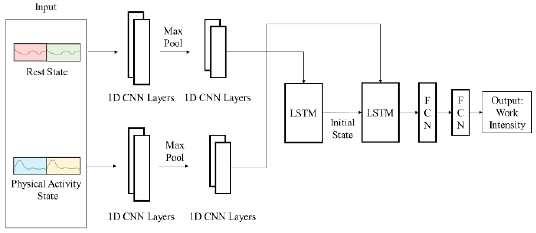
In this study, we propose a model for estimating the work intensity of a worker using their heart rate and skin temperature during rest and physical activity states in real time. The proposed deep-learning model comprises a 1D CNN and LSTM, as shown in Figure 1.
The proposed model divides the time-series data of the heart rate and skin temperature in the rest and physical activity states using the sliding window technique for 60 s of the signal, and uses the combined heart rate and skin temperature data as input data. Furthermore, when inputting data into the model, the data is divided into rest and physical activity states such that each state can also be considered. Feature information of time series data are extracted using 1D CNN layers of the preprocessed data in the rest state and physical activity state, respectively. A 1D CNN is a network that can analyze one-dimensional data patterns and time-series information and extracts time-series characteristic information of bio-signals. Then, the extracted feature information is input to LSTM, which can learn time-series data. Here, the initial weights are set by first inputting the characteristic information of the remaining state into the LSTM. Subsequently, the feature information of the physical activity state is input to the LSTM, wherein the weight is mapped with the information of the rest state. Finally, the FCNs were used in a structure for the final output of the data to obtain the estimated work intensity from the output data. By inputting the characteristic rest state first and using the data of the physical activity state later, the characteristic information of the physical activity state can be learned considering the feature information of the rest state. As a result, the work intensity can be estimated considering both states.
3.2 Data preprocessing
The model proposed in this study uses the heart rate and skin temperature data as input data. However, biometric information such as the heart rate and skin temperature differs from person to person depending on the body condition. Therefore, to consider these conditions for all workers, it is necessary to develop a method for identifying variables caused by individual differences. Although there are individual differences for each person, as the work intensity increases, the heart rate and body temperature increase. To apply these human characteristics, this paper uses rest and physical activity, heart rate, and skin temperature data during preprocessing to respond to individual differences in a wide range of work and learn changes in bio signals depending on the work intensity.
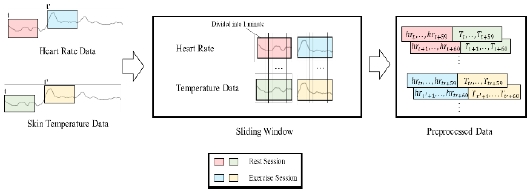
The preprocessing process is illustrated in Fig. 2. First, signals in the rest and physical activity states were extracted from the heart rate and skin temperature data. Then, using the Sliding Window technique, the data was overlapped and extracted in units of 60 s. For example, for 180 s of data collected, we obtain 120 pieces of data. However, considering the skin temperature or heart rate does not change rapidly depending on the physical activity state, it is not possible to accurately determine the change if information at a short time point is used. This paper focuses on the fact that the average heart rate is described in terms of heart beats per minute and extracts data in units of 60 s. Finally, to use both the heart rate and skin temperature information simultaneously, the heart rate and skin temperature data at the same time are simultaneously connected and used as input to the model.
3.3 Proposed 1D CNN-LSTM model
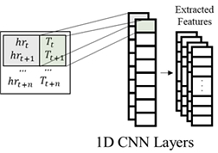
The work-intensity estimation algorithm using heart rate and skin temperature uses preprocessed time-series data, as described in Section 3.2. Therefore, the proposed model was designed using a 1D CNN, which can extract of time-series data, and LSTM, which can estimate the time-series data. Previous studies [7]-[13] confirm that heart rate is related to actual work intensity. Moreover, because blood pressure also increases as the heart rate increases, the body temperature can serve as an auxiliary variable for the heart rate. The input time series data was calculated as shown in Figure 3.
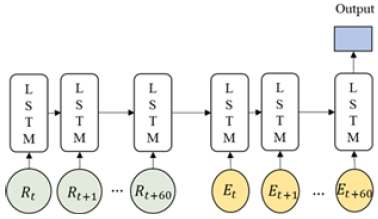
In the 1D CNN, the heart rate at time t (hrt) and the skin temperature (Tt) are preprocessed input data in 60 s increments are convolved in chronological order to extract temporal characteristics, and the feature data are extracted by combining the other two variables. Then, it goes through multi-layer 1D CNN Layers and max-pooling to generate feature vectors for time-series patterns. For all parameters of the 1D CNN, Kernel Size was set to 2, stride was set to 1, and padding was set to 0. The kernel size of the max-pooling layer was set to 1. The feature vectors in the rest and physical activity states generated through this process were input to the LSTM to extract time-series pattern features. The adapted LSTM is illustrated in Figure 4.
where Rt and Et are feature vectors extracted from a 1D CNN as input data in the rest and physical activity states, respectively. Each feature vector was processed according to the following formulas.
| (1) |
| (2) |
As shown in Equation (1), Rt is used as an input to LSTM and outputs of Many to One. These vectors are used as the initial weights of LSTM, which Et will be input in Equation (2), and a vector called output is the output of Many to One. If the output of the vector in the rest state is used as the initial weight of the LSTM, the output considering the characteristics of the rest state can be obtained by inputting the vector in the physical activity state. Therefore, it is possible to obtain a result of estimate the work intensity by considering both the information of the rest and physical activity states. The hidden size of LSTM was set to 128, and the bidirectional option was applied to design a model that simultaneously considers information from the previous and later time steps.
4. Results
4.1 Experimental setting
The model proposed in this paper was implemented using Pytorch, a Python-based deep learning framework, and the learning parameters and learning epochs were set to 100. The batch size was set to 512. The learning loss function uses cross-entropy, which is a representative function used in classification algorithms. Adam [25], which optimizes different neural networks well, was used as the learning optimizer, and the learning rate was set to 0.001.
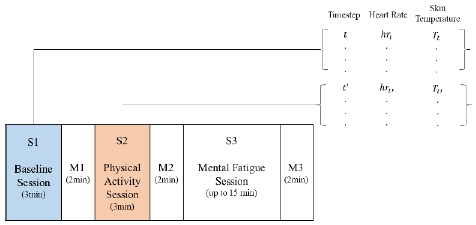
The training dataset used was Fatigueset [26]. Fatigueset measured mental and physical fatigue after performing three types of physical activities by attaching four wearable devices to 12 people. There were three sessions in Fatigueset, as shown in Figure 5.
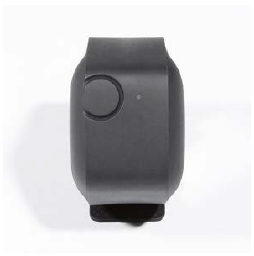
One is S1 Session, wherein the subjects are given a 3 min break for data collection, and the second is S2 Session, wherein the physical activity is performed for 3 min to provide physical fatigue. The third is the S3 Session, which is a task that gives mental fatigue for 15 min. The middle of each course was comprised of M1 sessions that identified fatigue status through questionnaires. The physical activity intensity of the S2 Session was expressed in three categories: 0, 1, and 2, and jogging was performed at speeds of 5, 7, and 9 km/h. When the subject reported a grade of 10, 14, or 16 on Borg’s Scale, the criterion for each physical activity intensity was determined while stopping for safety. We extracted and used the data of sessions S1 and S2 to acquire heart rate and skin temperature information during rest and physical activity states. Heart rate and skin temperature data were extracted from a wrist wearable device, as shown in Figure 6, and signals of 1 Hz and 4 Hz were received. To match the time step of the data, the heart rate and skin temperature data corresponding to 1 Hz were used.
After completing the preprocessing described in Section 3.2, the total number of data was 466560, and each data point was ([resting heart rate for 60 s, rest skin temperature for 60 s], [physical activity heart rate for 60 s, physical activity skin temperature for 60 s], and physical activity intensity). The ratio of training, verification, and test data was 8:1:1, and bias caused by data order was prevented by randomly shuffling the entire dataset.
4.2 Experiment results
To compare the performance of the proposed method, we evaluated whether it was accurately estimated using the model accuracy, precision, recall, and F1 score. Model accuracy refers to the prediction accuracy of the model's test dataset, and precision is a metric that compares whether the category classified by the model is classified correctly; one can check whether the predicted correct answer is correct. Recall is a metric that can be used to determine whether the correct answer is accurately predicted. The F1 Score is calculated as the harmonic average of precision and recall; therefore, the performance of the model can be accurately evaluated regardless of data imbalance. The dataset used for learning uses the Fatigueset [26] described in Section 4.1, and the learning settings of all models were the same as those described in Section 4.1.
To prove the performance of the model for estimating time-series bio-signals, we compared the performance of the SVM, DNN, and the proposed model. Furthermore, we compared the SVM, a representative machine learning-based classification algorithm, and deep neural networks (DNNs), which are multi-layered single dense layers, with the proposed model in Table 1. The SVM was implemented using the Scikit-Learn module, the Radial basis function (RBF) [27] was used as the kernel, and the parameters C and gamma were set to 10 and 0.1, respectively. Instead of 1D CNN and LSTM, DNNs stack three layers of FCN layers with output sizes of 60, 30, and 15 to extract features in the rest state and physical activity state, combine the two features, and finally input them into an FCN layer with an output size of three.
As a result, the model accuracies of DNNs, SVM, and the proposed model were calculated as 64.4%, 65.0%, and 57.2%, respectively. When using only single data, the proposed method showed lower accuracy and estimation performance compared to the DNNs or SVMs. However, the accurate estimation showed similar performance to the comparison models, as the precision results were 66%, 66%, and 65%, respectively. However, because it compares information at a single point in time that does not match the time-series information, the performance is said to be somewhat insufficient for practical use. Therefore, in Table 2, the performance was compared after constructing the input data using the data preprocessing method of the proposed method.
In Table 2, the models used in each method used DNNs and 1D CNN-LSTM with the same structure as in Table 1. However, the structure of the input data used data from a single point in time, and the data were built through the proposed preprocessing method.
The test accuracy of the model using the single time step and multi-time step significantly improved to 65% and 91.83% for DNNs and 57.2% and 99.96% for 1D CNN-LSTM, respectively. Additionally, 1D CNN-LSTM showed a very high estimation accuracy of 99.6%. When the estimation performance was almost accurate, the number of datasets was relatively small using information on the three physical activity states of the 12 subjects. However, it can be confirmed that using the information of the rest and physical activity states can estimate the work intensity more accurately than using a single time step in the same learning environment and model. In the future, additional studies will be conducted using large-scale bio signal information. Moreover, the estimation performance was higher than that of DNNs considering 1D CNN-LSTM handles time-series information of a longer time step better than DNNs. Therefore, it was confirmed that the model method of the proposed method is effective in learning time-series data. Finally, in Table 3, the effect of using both sets of data was analyzed by comparing the cases of using both heart rate and skin temperature data and using only the heart rate data.
Table 3 analyzes the effects of heart rate and skin temperature on the work intensity estimation by comparing the cases of using only heart rate information and both heart rate and skin temperature using the proposed 1D CNN-LSTM. For the training data, the heart rate and body temperature data measured by Fatigueset's wrist sensor were used. The experimental environment and conditions were the same as those in Tables 1 and 2. The heart rate and body temperature data were collected from Fatigueset's wrist sensor, and only heart rate data was used for learning when used for each 1 Hz. In contrast, when using heart rate and body temperature, input data in the form of (heart rate and body temperature) were combined and used for learning. When the model used only the heart rate, the model accuracy was 82.56% lower than when the heart rate and skin temperature were used together. Although the amount of data used was minimal, considering the same number of learnings were used, it was confirmed that the work intensity could be accurately estimated when the heart rate and skin temperature were used together, thereby showing higher accuracy by adding skin temperature information.
From the above experimental results, we can conclude that the work intensity can be estimated more accurately than a single point in time by preprocessing the rest and physical activity data with a sliding window and utilizing the characteristics of time-series information. Using this method, it is possible to determine the work intensity with high accuracy, even in real-time. Furthermore, the work intensity can be estimated more accurately by using both heart rate and skin temperature, as a comparison between the method using both heart rate and skin temperature and the method using only heart rate. Additionally, the proposed method showed high performance compared to other algorithm models, thereby proving the performance of the proposed model. However, the estimated accuracy of the model was quite high owing to the lack of data. In future work, we believe it will be possible to study whether similar accuracy can be obtained in a real environment by collecting work intensity estimation data at a longer time step.
5. Conclusion
This study proposed an algorithm for estimating work intensity in real time using the heart rate and skin temperature in the rest and physical activity states to estimate the work intensity of a worker. The proposed algorithm acquired the time-series data by pre-processing the time-series information of the resting and physical activity states of the heart rate and skin temperature using the sliding window method and estimating the work intensity using a 1-D CNN and LSTM. Through a performance comparison, the proposed algorithm estimated more accurately compared to other estimation algorithms with 99% model accuracy, high precision, recall, and F1 Score. Additionally, the proposed method is expected to show high accuracy in real-time estimation by comparing preprocessed time-series data in units of 60 s. Moreover, it was confirmed that the estimation performance was improved based on the correlation between the two data sets by using heart rate and skin temperature together. In the future, we expect that research will be conducted to collect and analyze various bio signals from workers working in ships and shipyards.
Acknowledgments
This work was supported by the Technology development Program (S3254278) funded by the Ministry of SMEs and Startups (MSS, Korea).
Author Contributions
Conceptualization, J. W. Bae and J. H. Seong; Methodology, J. W. Bae; Software, J. W. Bae; Data Curation, J. W. Bae; Writing—Original Draft Preparation, J. W. Bae; Writing—Review & Editing, J. H. Seong; Supervision, J. H. Seong;
References
- M. H. Lee and S. Y. Shin, “Driver drowsiness detection system using image recognition and bio-signals,” Journal of the Korea Institute of Information and Communication Engineering, vol. 26, no. 6, pp. 859-864, 2022.
- A. Trnčić, D. M. Ajayi, E. Hodžić, L. S. Bećirović, L. G. Pokvić, and A. Badnjević, “Biomedical signal analysis for automatic detection of diseases and disorders in prenatal age,” in 2022 11th Mediterranean Conference on Embedded Computing (MECO), pp. 1-4, 2022.
-
H. Hamil, Z. Zidelmal, M. S. Azzaz, S. Sakhi, R. Kaibou, S. Djilali, and D. Ould Abdeslam, “Design of a secured telehealth system based on multiple biosignals diagnosis and classification for iot application,” Expert Systems, vol. 39, no. 4, 2022.
[https://doi.org/10.1111/exsy.12765]

-
K. H. Choi and E. S. Yang, “A study on the trend of healthcare device technology by biometric signal,” Journal of Korea Entertainment Industry Association, vol. 14, no. 2, 165-176, 2020 (in Korean).
[https://doi.org/10.21184/jkeia.2020.2.14.2.165]

-
C. W. Kin and J. Y. Son, “Indoor positioning system for localizing people in danger using existing fire alarm network,” Journal of the Korean Society of Marine Engineering, vol. 43, no. 4, pp. 321-327, 2019.
[https://doi.org/10.5916/jkosme.2019.43.4.321]

- N. R. Son, M. A. Jung, and S. R. Lee, “Design and implementation of a real-time sailor management system based on ubiquitous healthcare,” Journal of Korean Institute of Communications and Information Sciences, vol. 35, no. 3, pp. 279-286, 2010 (in Korean).
- S. A. Baek, E. J. Lee, K. H. Nam and K. H. Cho, “Heart rate strain of forest-workers in timber harvesting operation,” Journal of The Korean Society of Industry Convergence, vol. 23, no. 4, pp. 593-601, 2020 (in Korean).
- J. H. Seong, S. T. Choi, J. Y. Lee, and W. D. Cho, “Exercise detection method by using heart rate and activity intensity in wrist-worn device,” KIPS Transactions on Computer and Communication Systems, vol. 8, no. 4, pp. 93-102, 2019 (in Korean).
-
G. Borg, “Psychophysical bases of perceived exertion,” Medicine & Science in Sports & Exercise, vol. 14, no. 5, pp. 377-381, 1982.
[https://doi.org/10.1249/00005768-198205000-00012]

-
O. Lee and J. W. Jung, “Validity of borg’s category ratio 10 scale during maximal-graded exercise testing,” Exercise Science, vol. 25, no. 2, pp. 92-99. 2016 (in Korean).
[https://doi.org/10.15857/ksep.2016.25.2.92]

- D. Y. Kim, S. S. Noh, and B. J. Kim, “Validity of RPE as the standard of exercise intensity,” The Korean Journal of Physical Education, vol. 45, no. 2, pp. 557-568, 2006.
- B. H. Kim, J. Y. Park, and S. W. Tak, “Comparison between heart rates and borg’s scale as a tool to evaluate physical workload,” Journal of Korean Society of Occupational and Environmental Hygiene, vol. 29, no. 3, pp. 368-374, 2019 (in Korean).
- J. M. Kim, “An Evaluation of Subjective Degrees of Physical Activity Based on Heart Rate,” Journal of the Korean Institute of Plant Engineering, vol. 14, no. 3, pp. 61-66, 2009.
-
Z. Yang, Y. Yuan, M. Zhang, X. Zhao, and B. Tian, “Assessment of construction workers’ labor intensity based on wearable smartphone system,” Journal of Construction Engineering and Management, vol. 145, no. 7, 2019.
[https://doi.org/10.1061/(ASCE)CO.1943-7862.0001666]

-
W. Fang, L. Ding, B. Zhong, P. E. Love, and H. Luo, “Automated detection of workers and heavy equipment on construction sites: a convolutional neural network approach,” Advanced Engineering Informatics, vol. 37, pp. 139-149, 2018.
[https://doi.org/10.1016/j.aei.2018.05.003]

-
S. M. Spook, W. Koolhaas, W. U. Bültmann, and S. Brouwer, "Implementing sensor technology applications for workplace health promotion: A needs assessment among workers with physically demanding work," BMC Public Health, vol. 19, no. 1, pp. 1-9, 2019.
[https://doi.org/10.1186/s12889-019-7364-2]

-
S. Anwer, H. Li, M. F. Antwi-Afari, W. Umer, and A. Y. L. Wong, “Evaluation of physiological metrics as real-time measurement of physical fatigue in construction workers: State-of-the-art review,” Journal of Construction Engineering and Management, vol. 147, no. 5, 2021.
[https://doi.org/10.1061/(ASCE)CO.1943-7862.0002038]

-
S. W. Park, J. H. Han, and S. K. Hong, “LSTM based behavior classification deep learning algorithm using EEG,” The Transactions of the Korean Institute of Electrical Engineers, vol. 70, no. 12, pp. 1924-1933, 2021 (in Korean).
[https://doi.org/10.5370/KIEE.2021.70.12.1924]

- J. K. Bae, M. S. Kwak, K. K. Noh, D. K. Lee, D. J. Park, and S. M. Lee, “Comparative learning based deep learning algorithm for abnormal beat detection using imaged electrocardiogram signal,” Journal of the Korea Institute of Information and Communication Engineering, vol. 26, no. 1, pp. 30-40, 2022 (in Korean).
-
P. Davidson, P. Düking, C. Zinner, B. Sperlich, and A. Hotho, “Smartwatch-derived data and machine learning algorithms estimate classes of ratings of perceived exertion in runners: A pilot study,” Sensors, vol. 20, no. 9, p. 2637, 2020.
[https://doi.org/10.3390/s20092637]

-
M. T. Darbandy, M. Rostamnezhad, S. Hussain, A. Khosravi, S. Nahavandi, and Z. A. Sani, “A new approach to detect the physical fatigue utilizing heart rate signals,” Research in Cardiovascular Medicine, vol. 9, no. 1, pp. 23-27, 2020.
[https://doi.org/10.4103/rcm.rcm_8_20]

-
S. Hochreiter and J. Schmidhuber, “Long short-term memory,” Neural Computation, vol. 9, no. 8, pp. 1735-1780, 1997.
[https://doi.org/10.1162/neco.1997.9.8.1735]

-
A. Shoeibi, D. Sadeghi, P. Moridian, N. Ghassemi, J. Heras, R. Alizadehsani, et al., “Automatic diagnosis of schizophrenia in EEG signals using CNN-LSTM models,” Frontiers in Neuroinformatics, vol. 15, 2021.
[https://doi.org/10.3389/fninf.2021.777977]

-
J. Zhu, H. Chen, and W. Ye, “Classification of human activities based on radar signals using 1D-CNN and LSTM,” 2020 IEEE International Symposium on Circuits and Systems (ISCAS), pp. 1-5, 2020.
[https://doi.org/10.1109/ISCAS45731.2020.9181233]

- D. P. Kingma and J. Ba, “Adam: A Method for Stochastic Optimization”, arXiv preprint arXiv:1412.6980, , 2014.
-
M. Kalanadhabhatta, C. Min, A. Montanari, and F. Kawsar, “FatigueSet: A multi-modal dataset for modeling mental fatigue and fatigability,” International Conference on Pervasive Computing Technologies for Healthcare, pp. 204-217, 2022.
[https://doi.org/10.1007/978-3-030-99194-4_14]

-
M. D. Buhmann, “Radial Basis Functions,” Acta numerica, vol. 9, pp. 1-38, 2000.
[https://doi.org/10.1017/S0962492900000015]


