[ICACE2022] Prediction of container vessel waiting time in Busan port using LSTM neural network
Copyright © The Korean Society of Marine Engineering
This is an Open Access article distributed under the terms of the Creative Commons Attribution Non-Commercial License (http://creativecommons.org/licenses/by-nc/3.0), which permits unrestricted non-commercial use, distribution, and reproduction in any medium, provided the original work is properly cited.
Abstract
This study proposes a long short-term memory neural network model to predict the waiting time of container vessels at Busan Port. Based on Port Management Information System (Port-MIS) data, the vessel waiting time and vessel service time of container vessels in Busan Port were extracted from the vessel calling status (VCS) between January 2001 and August 2022. The method and procedures for calculating the vessel waiting time and vessel service time using the time stamp, call sign, number of arrivals, vessel type, navigation status, and facility code are described for ongoing measurements. Additionally, a multivariate long short-term memory model was applied to predict the future vessel waiting time with the vessel service time, number of waiting vessels, and container throughput as the input features. Predictions were made multiple times with different window sizes, and the mean square error, mean absolute error, and root mean square error were used to assess the performance of the model. The results prove the feasibility of using the long short-term memory model for predicting the vessel waiting time. The computation method and prediction model of this study provide significant implications and support shipping market participants and port authorities in making more informed decisions regarding the utilization of port facilities and the upcoming port congestion status.
Keywords:
Vessel waiting time, Long short-term memory (LSTM), Neural network, Busan port, Port management information system (Port-MIS)1. Introduction
Korea has pursued export-led economic growth since the beginning of its development. Consequently, both exports and imports have expanded rapidly over the years, and the trade-to-GDP ratio has increased from 53.0% in 1990 to 84.8% in 2021 [1]. Under these circumstances, the fact that shipping accounts for 99.8% of the total exports and imports in terms of volume clearly shows how ports in Korea have significantly contributed to the development of the national economy [2].
With ports playing such a vital role as key infrastructure, “Port Congestion” is regarded as an important determinant of port competitiveness [3]. That is, alleviating port congestion is an essential prerequisite for improving a port's competitiveness and overall performance. This is because port congestion causes the vessels to stay longer than their original schedule. This not only causes a significant loss of time, but also increases the fuel consumption and total emissions within the port.
Additionally, port slowdowns have severely hampered container turnaround times and schedule reliability in liner shipping, thereby disrupting the maritime supply chain. Therefore, it is necessary for port authorities and shipping market participants to accurately evaluate the port congestion status and make the most precise predictions about upcoming congestion.
Existing studies measuring port congestion in Korea have mostly been conducted by calculating the overall waiting ratio of a port or container terminal. Kim and Kim [4] assessed the service level of vessel entry and departure in Korean ports using a waiting ratio calculated in terms of different terminals and vessel types. Lee and Park [5] compared the theoretical and actual vessel waiting ratios of a particular container terminal located in Busan New Port.
For the theoretical vessel ratio, the queuing theory was applied, and the actual vessel waiting ratio of the container terminal was extracted using the Port Management Information System (Port-MIS) and Terminal Operating System (TOS). However, the method and procedure for calculating the vessel waiting time have not been clearly described. The calculation was based on the vessel’s permitted period to use a certain facility; therefore, whether the vessel actually stayed there while waiting during that period was not certain.
In this study, we propose a computation method to estimate the monthly average vessel waiting time and vessel service time using the vessel calling status in port-mis data [6]. Moreover, a multivariate long short-term memory (LSTM) neural network was applied to predict the future vessel waiting time of container vessels in Busan port by incorporating the vessel service time, number of vessels waiting, and container throughput. Predictions using the proposed method were performed with different window sizes, and the performance was compared with that of the conventional recurrent neural network (RNN) model. Computing and predicting vessel waiting times from Port-MIS data will enable port authorities and shipping market participants to monitor the port congestion status more precisely and make wiser decisions regarding the utilization of port facilities.
The remainder of this paper is organized as follows. Section 2 lists the data fields of the vessel calling status in Port-MIS used in this study and presents a brief description of Busan Port. Section 3 describes the methodology for calculating the vessel waiting time and vessel service time and illustrates the calculated results for container vessels in Busan Port. A multivariate LSTM model is proposed in Section 4, the prediction results of the model are evaluated, and Section 5 concludes the study.
2. Port-MIS (Port Management Information System) data
The Port-MIS (Port Management Information System) is an integrated information system established to manage information and handle civil petitions related to the entry and departure of vessels, port utilization, port logistics, shipping, sailors, vessels, etc. The information provided by the Port-MIS website includes ship-related information, port facility usage information, cargo-and dangerous goods-related information, control information, codes, and HNS [7].
In this study, data fields regarding the use of anchorage and berth facilities were extracted from the vessel-calling status of the Port-MIS. For the analysis of the vessel waiting time and service time, we considered the time stamp, call sign, number of arrivals, vessel type, navigation status, and facility code, as illustrated in Table 1.
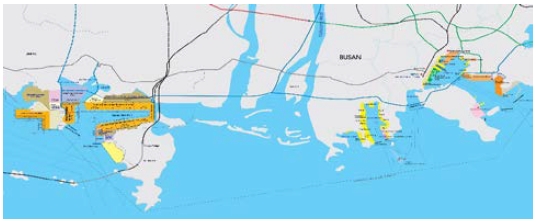
Figure 1 shows the layout of Busan port, the port to be analyzed. It is the largest container handling port in Korea, covering 75% of the nation’s total container handling volume [8]. The total length of the quay was 30,709m, with a berthing capacity of 146 vessels. It has three geographical segments: Busan New Port. Busan North Port, and General Piers (South Port, Gamcheon Port, and Dadaepo Port), with 21 anchorage areas operating as of 2020 [9]. The overall status of Busan Port is summarized in Table 2.
3. Port-MIS data-driven vessel waiting/service time computation
3.1 Defining vessel waiting/service time
The process of a vessel from arriving at the port to leaving the area after the work is done consists of eight steps, i.e., “Arrival,” “Entry,” “Departure,” “Anchor,” “Heave,” “Berth,” “Unberth,” and “Leave”; it proceeds as follows depending on the traffic condition and status of each facility within the port [10].
- ① If a berth is available, the vessel carries out a load-discharge operation at the assigned berth and leaves the port.
- ② If no berth is available, the vessel moves to the anchorage area and waits until one berth is assigned. When the berth is clear, the vessel carries out a load-discharge operation at the assigned berth and leaves the port.
- ③ If there is a delay before leaving the port, the vessel moves from the assigned berth to the anchorage area and waits until traffic conditions are clear.
Accordingly, in this study, the time for vessels waiting in the anchorage area is defined as the “vessel waiting time,” and the time for vessels to load and discharge at the berth is defined as the “vessel service time”.
3.2 Methodology in calculating vessel waiting/service time
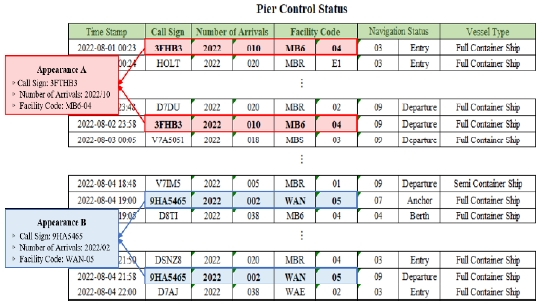
The logic framework for calculating the vessel waiting time and service time is based on the vessel calling status of the Port-MIS data. First, from the observations of the original data, the appearance of a particular vessel in the port is identified by the “Call Sign” and the “Facility Code” of the one that the vessel is using as shown in Figure 2. Each appearance is distinguished from the previous appearance of the same vessel by the “Number of Arrivals”.
The type of facility used by the vessel is then sorted into the berth, anchorage, etc. with the “Facility Code”. Two consecutive navigation statuses of the vessel are used to determine whether the vessel is waiting or carrying out a load-discharge operation in a certain facility. Table 3 further presents the classification of the vessel status. Lastly, the “Time Stamps” provide an estimate of the vessel waiting time and vessel service time by subtracting the time stamp of the latter observation from the time stamp of the former observation. If the vessel status of the appearance is “Waiting,” the calculated time would be defined as the vessel waiting time. If the vessel status is “In Operation,” the calculated time is defined as the vessel service time.
3.3 Calculation Results
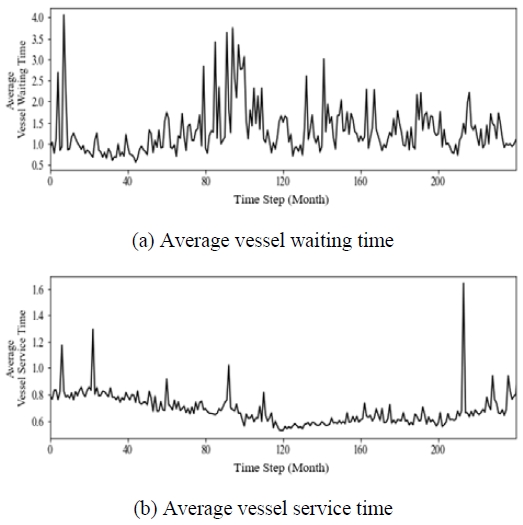
To determine the vessel waiting time and vessel service time of container vessels in Busan Port, original Port-MIS data are filtered by “Vessel Type,” selecting observations of “Full-Container Ship” and “Semi-Container Ship” as the subject. The vessel waiting time and vessel service time were calculated for each appearance of the container vessels in Busan Port from 2001.01 to 2022.08 and the monthly average was computed.
Figure 3 shows the computed monthly average of the vessel waiting time and vessel service time during the calculation period, and Table 4 presents a statistical summary of the two datasets.
4. Vessel waiting time prediction with LSTM
4.1 LSTM neural network
The major feature of a Recurrent Neural Network (RNN) is the type of memory that stores data and is capable of processing sequential data, such as time series. However, as the sequence of the training data increases, there is a loss of memory with a reduction in the learning rate. This problem is referred to as the vanishing gradient problem and one of the approaches designed to handle this long-term dependency is the LSTM neural network [11][12][13].
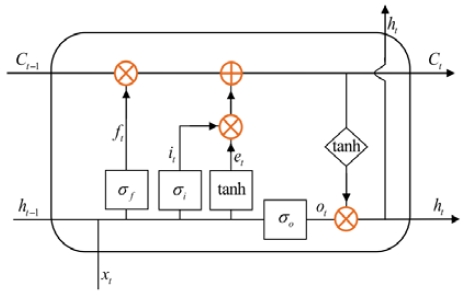
Figure 4 shows the inner structure of the LSTM cell. Although the basic operation of the LSTM is the same as that of a conventional RNN, the long-term memory loss problem can be resolved by adding input, forget, and output gates inside the cell. The input gate adjusts the input data, and the forget gate determines the extent to which the cell state of the previous time is reflected using a sigmoid function ranging from 0 to 1. The output gate adjusts the input data when the weight value is applied to each state. The LSTM forgets a certain amount of cell state data at the previous cell state through the forget gate and further multiplies the previous output value and current input value by the output from the input gate to control the input data, thus updating the current cell state.
4.2 Input Features
Theoretically, having multivariate features in the input dataset improves the performance of the LSTM prediction model, as long as they are correlated with the data that the model is meant to predict. Therefore, we first need to select the features that should be included in the input dataset [15]. In this study, the vessel waiting time, vessel service time, number of waiting vessels and container throughput were determined as the input features based on prior research on vessel waiting time [16][17]. In other words, our proposed model should predict the vessel waiting time in the next aggregation period based on the current and past vessel waiting time, vessel service time, number of waiting vessels, and container throughput.
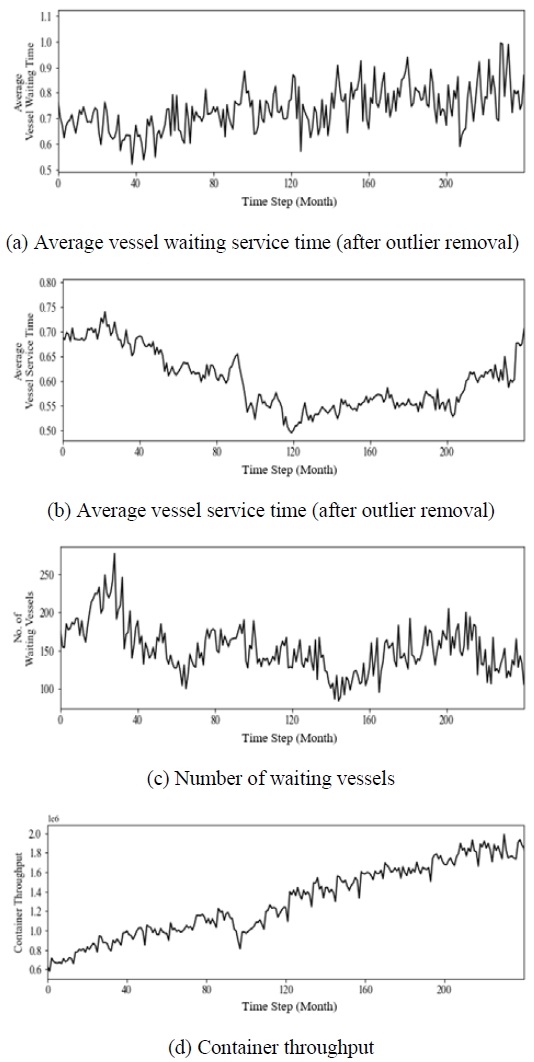
In the case of the vessel waiting time and service time, the monthly average is computed using the method described in the previous section. However, the computed data included outliers that were distant from other data points. Because the training process of the LSTM model is highly responsive to the distribution and range of the data points, these values make it difficult to extract the feature values during the training process. Therefore, the data were preprocessed and outliers were removed [18][19]. This study applied the interquartile range (IQR) to identify the outliers. That is, if the observed value is greater than the third quartile plus 1.5 IQR or less than the first quartile minus 1.5 IQR, it is defined as an outlier and removed from the dataset [20].
Figure 5 shows a sample of the input features of the proposed LSTM model. It includes the monthly average vessel waiting time and vessel service time with the outlier removed, along with the monthly data of the number of waiting vessels and container throughput, which are additionally extracted from the Port-MIS data.
4.3 Architecture of the model
In this study, a multi-stacked LSTM model with two LSTM layers, a single dropout layer, and two dense layers was constructed to predict the vessel waiting time. The four input features mentioned above were first reshaped into a training format. Some unit of the input data include the vessel waiting time, vessel service time, number of waiting vessels, and container throughput of the past period. The data were then passed to two LSTM layers with 64 and 32 units, respectively. In each LSTM layer, ‘relu’ was used as the activation function and a dropout layer was added to avoid overfitting and improve the training process of the neural network [21]. Finally, two dense layers are used to change the dimensions of the vectors from the LSTM layers to one dimension (the predicted vessel waiting time). The specific parameters for each layer are listed in Table 5.
4.4 Prediction results
The LSTM model used in this study was implemented using the following hardware and operating system: Windows 10 Pro, AMD Ryzen 5 4600G with a Radeon Graphics 3.70 GHz processor, NVIDIA GeForce RTX 3060 Ti, and 32 GB of RAM. In terms of software, the deep learning library Keras with a Tensor-Flow backend engine for parallel computing was utilized in the design. Both libraries are available in Python. The input dataset used to train the model was collected from 2001.01 to 2022.08 at Busan Port, including 260 data points. to predict the vessel waiting time of the container vessels, the dataset is filtered and focuses on the “Full-Container Ship” and “Semi-Container Ship” only.
Our experiment was designed with three different window sizes (2, 3, and 4) to evaluate the effect of the window size on the prediction performance. For each input dataset, we split the set into 80% training and 20% testing sets, with the time sequence preserved (unshuffled). The performance of the proposed model was assessed using three standard metrics: mean square error (MSE), mean absolute error (MAE), and root mean square error (RMSE) [22][23]. The training epochs and performance metrics for each window size are presented in Table 6. From the results, we can observe that the difference between the prediction performance with different window sizes is insignificant; however, MSE, MAE, and RSME are the smallest when the window size is 4. This means that the vessel waiting time is best predicted when considering the vessel waiting time, vessel service time, number of waiting vessels, and container throughput of the past four months.
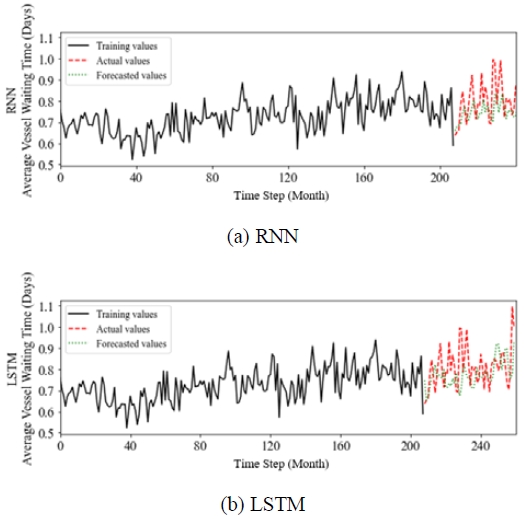
Furthermore, a comparison was conducted between the performance of the proposed LSTM model and that of the conventional RNN model, which was used for the same dataset. Based on the previous experiment, the window size of the LSTM model was set to 4 (which achieved the highest accuracy), and to better compare the prediction results, the training epoch of the RNN model was set to the same value as that of the LSTM. The training epochs and performance metrics are listed in Table 7. The prediction results of the vessel waiting time using both models are shown in Figure 6. It is clearly shown that the LSTM model achieves a lower error rate in terms of every performance metric.
5. Conclusions
In this study, we first evaluated the process of a vessel within the port and defined the vessel waiting time and vessel service time. We then proposed a computing method for the two based on the Port-MIS data. Data fields such as the time stamp, call sign, number of arrivals, vessel type, navigation status, and facility code were extracted from the vessel calling status.
Based on these data, the appearance of vessels in the port was determined, and the vessel waiting time along with the vessel service time was calculated once the vessel status of each appearance was classified. After computing the vessel waiting time and vessel service time of container vessels in Busan Port from 2001.01 to 2022.08, the LSTM model was implemented to predict the vessel waiting time in the next aggregation period based on the current and past vessel waiting times, vessel service time, number of waiting vessels, and container throughput.
Predictions were performed using different window sizes, and the performance of each prediction was evaluated. Additionally, the prediction results using the proposed LSTM model and the conventional RNN model were compared. The results provided empirical evidence and verified the feasibility of applying a deep learning approach with an LSTM Neural Network to predict the vessel waiting time with adequate accuracy.
We believe that the present work provides port authorities with a method to effectively monitor the port congestion status and improve the efficiency of future operations. It also helps liners and other participants in the shipping market to determine the port of call and adjust their plans.
Acknowledgments
This paper is an expanded version of the proceeding paper entitled “The prediction of container vessel waiting time in Busan port using LSTM neural network” presented at the ICACE 2022.
This research was supported by the 4th Educational Training Program for the Shipping, Port, and Logistics from the Ministry of Oceans and Fisheries.
Author Contributions
Conceptualization, H. S. Shin and H. S. Kim; Methodology, H. S. Shin and C. Y. Kim; Software, H. S. Shin; Validation, H. S. Shin and C. Y. Kim; Formal Analysis, H. S. Shin; Investigation, C. Y. Kim; Resources, H. S. Shin; Data Curation, H. S. Shin; Writing-Original Draft Preparation, H. S. Shin; Writing-Review & Editing, C. Y. Kim; Visualization, H. S. Shin; Supervision, H. S. Kim; Project Administration, H. S. Kim; Funding Acquisition, H. S. Kim.
References
- Trade-to-GDP Ratio, https://www.index.go.kr/unify/idx-info.do?idxCd=4207&clasCd=7, , Accessed October 11, 2022.
- M. -K. Lee, “A study on determinant of the ship’s time in a port in the perspective of port service innovation,” Innovation Studies, vol. 7, no. 1, pp. 51-69, 2012 (in Korean).
- G. -T. Yeo and D. -W. Song, “The hierarchical analysis of perceived competitiveness: An application to Korean container ports,” Journal of the Eastern Asia Society for Transportation Studies, vol. 6, pp. 866-880, 2005.
- E.-S. Kim and G.-S. Kim, “An analysis of ship’s waiting ratio in the Korean seaports,” Journal of Navigation and Port Research, vol. 40, no. 1, pp. 35-41, 2016 (In Korean).
-
J. -H. Lee and N. -K. Park, “A study on the gap between theoretical and actual ship waiting ratio of container terminals: The case of a terminal in Busan new port,” Journal of Korea Port Economic Association, vol. 34, no. 2, pp. 69-82, 2018 (In Korean).
[https://doi.org/10.38121/kpea.2018.06.34.2.69]

- Port-MIS, https://new.portmis.go.kr/, , Accessed October 11, 2022.
- M. -J. Kim and S. -S. Shin, “A study on the evaluation of the service quality of Port-Mis,” Journal of Korea Port Economic Association, vol. 29, no. 2, pp. 211-238, 2013 (in Korean).
- Current Status of Busan Port, https://www.busan.go.kr/depart/ahoceaninfo, , Accessed October 11, 2022.
- Overall Status of Port Facilities in Busan Port, https://www.busanpa.com/eng/Contents.do?mCode=MN0031, , Accessed October 11, 2022.
- J. -Y. Oh and H.-J. Kim, “Analysis of Port-MIS data for prediction of anchorage waiting time,” Proceedings of the 2020 KAOSTS Fall Conference, pp. 3-4, 2020 (in Korean).
-
S. Hochreiter and J. Schmidhuber, “Long Short-Term Memory,” Neural Computation, vol. 9, no. 8, pp. 1735-1780, 1997.
[https://doi.org/10.1162/neco.1997.9.8.1735]

-
W. -Y. Kim, J.-H. Seong, S.-H. Lee, and D. -H. Seo, “A study on oil-film detection technique using IR-UWB radar-based Bi-LSTM,” Journal of the Korea Society of Marine Engineering, vol. 42, no. 10, pp. 843-850, 2018.
[https://doi.org/10.5916/jkosme.2018.42.10.843]

-
M. -W. Cho, T. -Y. Kim, and B. -W. Lee, “Turn-time prediction system implementation of container trucks at the port terminal,” Korea Logistics Review, vol. 32, no. 4, pp. 105-114, 2022 (In Korean).
[https://doi.org/10.17825/klr.2022.32.4.105]

-
Z. Cui, K. Ruimin, P. Ziyuan, and Y. Wang, “Stacked bidirectional and unidirectional LSTM recurrent neural network for forecasting network-wide traffic state with missing values,” Transportation Research Part C: Emerging Technologies, vol. 118, p. 102674, 2020.
[https://doi.org/10.1016/j.trc.2020.102674]

- H. Lütkepohl, New Introduction to Multiple Time Series Analysis, 2nd edition: Springer, 2006.
-
J. Franzkeit, H. Pache, and C. Jahn, “Investigation of vessel waiting times using AIS data,” Proceedings of International Conference on Dynamics in Logistics, pp. 70-78, 2020.
[https://doi.org/10.1007/978-3-030-44783-0_7]

-
W. Peng, X. Bai, D. Yang, K. -F. Yuen, and J. Wu, “A deep learning approach for port congestion estimation and prediction,” Maritime Policy & Management, pp. 1-26, 2022.
[https://doi.org/10.1080/03088839.2022.2057608]

-
S. V. Belavadi, S. Rajagopal, R. Ranjani, and R. Mohan, “Air quality forecasting using LSTM RNN and wireless sensor networks,” Procedia Computer Science, vol. 170, pp. 241-248, 2020.
[https://doi.org/10.1016/j.procs.2020.03.036]

-
D. -H. Shin, K. -Y. Chung, and R. C. Park, “Prediction of traffic congestion based on LSTM through correction of missing temporal and spatial data,” IEEE Access, vol. 8, pp. 150784-150796, 2020.
[https://doi.org/10.1109/ACCESS.2020.3016469]

- J. W. Tukey, Exploratory Data Analysis, Addison-Wesley, 1977.
-
R. A. Jacobs, “Increased rates of convergence through learning rate adaption,” Neural Networks, vol. 1, no. 4, pp. 295-307, 1988.
[https://doi.org/10.1016/0893-6080(88)90003-2]

-
F. U. M. Ullah, A. Ullah, I. U. Haq, S.-M. Rho, and S.-W. Baik, “Short-term prediction of residential power energy consumption via CNN and multi-layer bi-directional LSTM networks,” IEEE Access, vol. 8, pp. 123369-123380, 2020.
[https://doi.org/10.1109/ACCESS.2019.2963045]

-
F. Jiang, G. Xie, and S. Wang, “Forecasting port container throughput with deep learning approach,” Proceedings of the 5th International Conference on Computer Science and Application Engineering, pp. 1-4, 2021.
[https://doi.org/10.1145/3487075.3487173]


