Effect of the turbulence model in the flow analysis of triple offset butterfly valve
Copyright © The Korean Society of Marine Engineering
This is an Open Access article distributed under the terms of the Creative Commons Attribution Non-Commercial License (http://creativecommons.org/licenses/by-nc/3.0), which permits unrestricted non-commercial use, distribution, and reproduction in any medium, provided the original work is properly cited.
Abstract
A valve is a device that regulates the flow of fluid by manipulating various passageways to control the pressure and flow stream. For the robust design of valves using a numerical approach, understanding the flow behavior through valves with complicated geometric structures is crucial. The present paper reports a numerical study of flow behavior through a 300 mm sized triple offset butterfly valve with different turbulence models of k–ε and Reynolds stress models. The effect of the turbulence model and consequent flow behavior analysis of the valve under different disc opening cases were carried out to examine the effect of different turbulence models. Different discrepancies between the numerical and experimental results were observed, and the Reynolds stress model showed a considerably smaller discrepancy than that of the k–ε model. Whereas the turbulence effect was well expressed with the Reynolds stress model at the developing location, it was well expressed with the k–ε model rather than the Reynolds stress model at the developed location.
Keywords:
Butterfly valve, Turbulence model, Flow behavior, Volume flow rate1. Introduction
A valve is a device that regulates the flow of fluid by manipulating various passageways to control the pressure and flow stream [1][2]. Valves can be largely classified as manual or control valves according to the method of controlling the valve. Either of them, a control valve that controls flow passage by a signal from a controller has attracted considerable attention owing to the precise control and easy manipulation of the device, particularly for larger valves. In controlling the flow through a valve, two methods are commonly used: a linear motion valve and a rotary motion valve (quarter turn valve). Linear motion valves, such as gate valves, globe valves, needle valves, and pinch valves, valves use a closure device that moves along a straight line to start, stop, or throttle the flow. Rotary motion valves (quarter turn valve), such as ball valves, butterfly valves, and plug valves, rotate a disc about the shaft in their fully open or closed state by turning the stem [3].
Valve characteristics are characterized by various valve coefficients such as the valve flow coefficient, loss coefficient, and hydrodynamic torque coefficient. The performance and characteristics of a valve were determined using a numerical approach in many cases because obtaining these factors is not feasible [4] owing to experimental limitations such as cost, prohibitive for the large size.
For the robust design of valves using a numerical approach, understanding the flow behavior through valves with geometric structures is crucial. One of the important considerations is the turbulence model because the accurate numerical prediction of the flow behavior in the valve is dependent on the turbulence model. Therefore, in the present numerical study, the most frequently used turbulence model in industrial workplaces is considered: the two-equation k – ε model of Launder [5].
The present paper reports a numerical study of the flow behavior through a 300 mm sized triple offset butterfly valve (TOBV). Different turbulence model effects were examined under different fluid flow conditions of the valve caused by various disc opening conditions. The effect of the turbulence model was examined with consequent flow behavior analysis around the valve with turbulence variables such as turbulence kinetic energy and Reynolds stress.
2. Numerical model and method
2.1 Numerical model
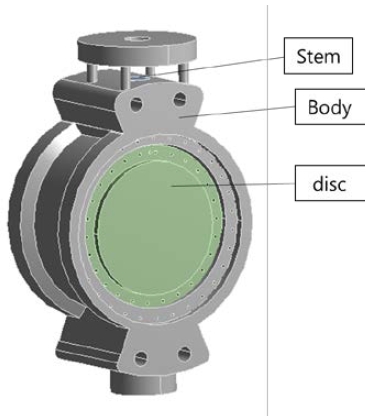
In the present analysis, a 300 mm sized TOBV was considered. Valve specification is shown in Figure 1, with a structured nonadaptive grid (hexahedral grid) with 250,000 nodes. Numerical studies were conducted with different turbulence models, and the accuracy of the turbulence model was examined by comparing the results.
The governing equations of fluid motion for turbulent flow deal with the conservation of mass and momentum equations expressed in terms of Reynolds density-averaged variables.
The mass and momentum conservation equations are expressed by Equations (1) and (2), respectively, as follows:
| (1) |
| (2) |
where the velocity components are denoted by ui, i = 1, 2, 3; and and denote the ensemble-averaged quantities. The quantities of ρ, p, μ, and τij represent the density, pressure, dynamic viscosity, and turbulence Reynolds stress, respectively.
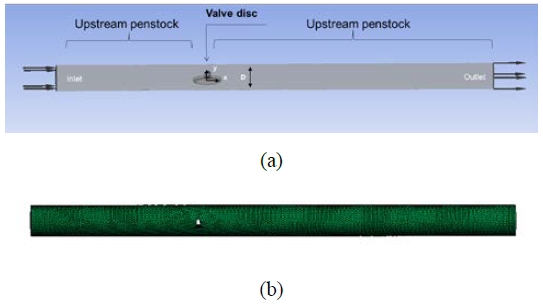
The representative cross sections of a TOBV and the connected pipe and mesh are shown in Figure 2, where the upstream penstock, valve disc, and downstream penstock sections.are shown. The distances from the valve required for the flow to fully develop, that is, upstream and downstream lengths were 5 and 10 times the pipe diameter, respectively.
2.2 Turbulence model
The Reynolds stresses can be expressed with Reynolds averaging using an eddy viscosity model with the Boussinesq hypothesis [6]-[8] as follows:
| (3) |
where k, ρ, δij, τij, and represent the turbulent kinetic energy, density, Kronecker delta tensor, turbulence Reynolds stress, and eddy viscosity, respectively. The velocity and mean velocity components in the direction are denoted by ui (i = 1, 2, 3) and Ui , respectively, and the overbar denotes the time average.
The two-equation k – ε model is developed by Launder and Sharma [9]-[10] and simply called the k – ε model. In this model, the transport equations for the turbulent kinetic energy (k) and dissipation rate (ε) are expressed as follows:
| (4) |
| (5) |
The Reynolds stress (RS) model, a second-order closure model, can be obtained by solving the following transport equations derived from the Navier–Stokes equation.
| (6) |
| (7) |
| (8) |
| (9) |
Pressure–strain term Φij simulates the production and transport processes of RS and determines the structure of turbulent flows.
3. Results and discussion
3.1 Effect of numerical turbulence models
Considering the flow coefficient when designing the valve is a practical method for determining the size of the valve [11]. The flow coefficient of the valve is measured as the quantity of water in US gallons at 60 ℉ that passes through the valve each minute under a pressure drop of 1 psi and is regarded as the valve capacity by the ISA standard S75.01, 02 [12]-[13]. The butterfly valve is a typical on–off quarter-turn rotational motion valve. Therefore, the flow coefficient was measured under the condition of full opening.
Flow coefficient experiments were conducted under full opening conditions in accordance with KS B 2101 [14]. The test valve was installed in the test jig with the valve fully open. After applying a pressure of 6.9 kPa (1 psi) to the front and rear ends of the valve, the amount of water flow rate was measured for 1 min. The results are shown in Figure 3(a): about 0.316 m3/s of volume flow rate and approximately 20,000,000–27,000,000 of Reynolds number were measured.
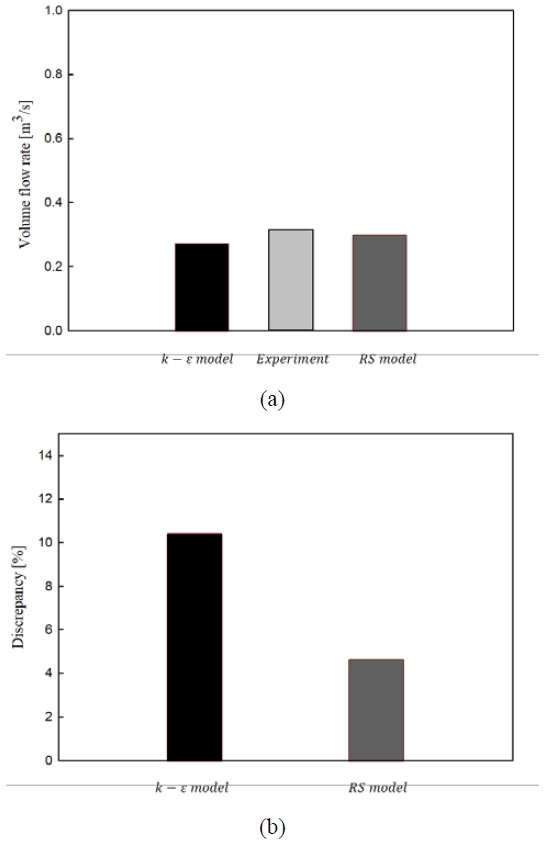
Experimental and numerical results for the different turbulence models with 300 mm sized valves; (a) volume flow rate, (b) discrepancy between experimental and numerical results
The practical use of numerical methods is important for fluid machinery, such as valves. The numerical approach in the valve requires an understanding of the fluid flow behavior through the valve that is closely dependent on the turbulent model. Choosing and adopting adequate turbulence models is essential for obtaining reasonable results for valve flow [15]-[17]. Therefore, the numerical method with an adequate turbulence model was validated with an experimentally measured valve flow coefficient of 300 mm (12 inch) diameter using k – ε and RS models.
The results are shown in Figures 3(a), (b). Different discrepancies between the numerical and experimental results were observed with the turbulence model. The discrepancy value between numerical and experimental results was 5–13 %. Between the two turbulence models, the RS model has a considerably smaller discrepancy than the k – ε model.
3.2 Fluid flow of different opening conditions with turbulence models
Whereas the butterfly valve is a typical on–off valve, many efforts have been made to use a control valve with a butterfly valve because of its ease of repair and lightweight merits. Therefore, the effect of the turbulence model and consequent flow behavior through the valve was numerically investigated under different valve opening conditions.
Figure 4 shows the velocity contours of different opening angles for the 300 mm valve with the two equations of standard k – ε and RS models. Overall, the flow in the valve developed with vortices and dissipated with swirling vortices after passing around the valve. The flow stream remained constant until it approached the valve in the upstream region, and the flow through the passing valve changed with increasing velocity owing to the decreased area between the disc and the valve wall, resulting in a highly turbulent flow including many vortices. After passing through the disc, streamlines along the valve disc were separated from each other, causing a large amount of turbulence. Swirling vortices with different mixing behaviors for different disc opening angles were shown and observed with an eventual constant-flow stream in the downstream region.
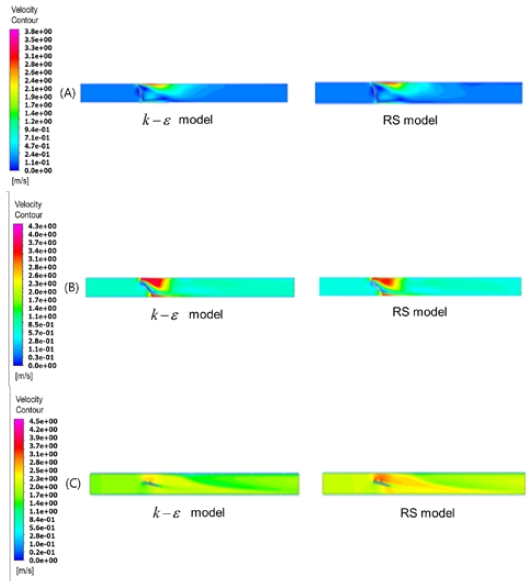
Velocity streamline contours with different disc opening cases with different turbulence models of k – ε and Reynolds stress models ((A) 20 % disc opening, (B) 50 % disc opening, (C) 80 % disc opening)
In the 20% disc opening condition, flow behavior through the valve showed that vortices and wake regions were created. Flow recirculation and secondary flows were observed in the form of vortex mixing resulting from the wakes. However, with large opening of 80%, the amount of recirculation and swirling behind the valve decreased because of the large area between the disc and the pipe wall.
Fluid flow and turbulence effects were observed at different locations of x/Y = 5 and 10, where x is the downstream location from the valve, and Y is the nominal valve size. Regarding different turbulence models, different characteristics of flow behavior were shown, particularly at the location of 5 x/Y with valve opening conditions. With a decreasing disc opening angle, a relatively smaller effective flow region between the disc and the wall caused a large pressure drop and velocity increase that could increase the turbulence. Increasing turbulence was expressed by the turbulence kinetic energy, as shown in Figure 5. Higher turbulence owing to vortices was observed for the RS model, followed by the k – ε model expressed with higher turbulence kinetic energy.
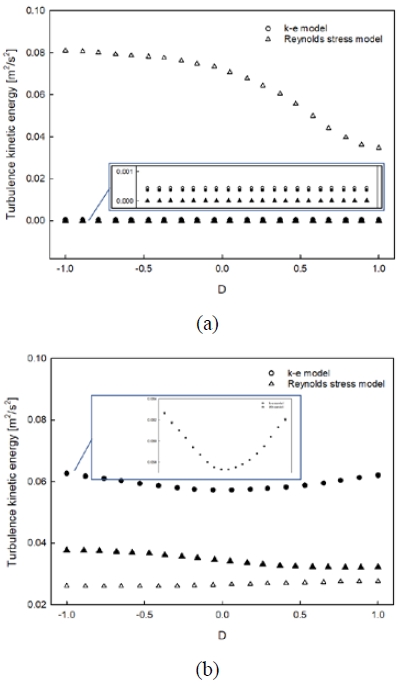
Turbulence kinetic energy profile with different disc openings (a) 20%, (b) 80% at two characteristic locations 300 mm (D is nondimensional unit of disc, Empty: 5 x/Y, filling: 10 x/Y)
At developing location x/Y = 5, the turbulence effect was well expressed by the RS model. However, at developed location x/Y = 10, the turbulence effect was expressed by the k – ε model rather than the RS model. Figure 6 shows the Reynolds normal stress for the RS model, showing higher normal stresses at location 5 x/Y. The RS model predicted anisotropic stresses better near the disc region; therefore, it was better expressed than the k–ε model that dealt with isotropic RS.
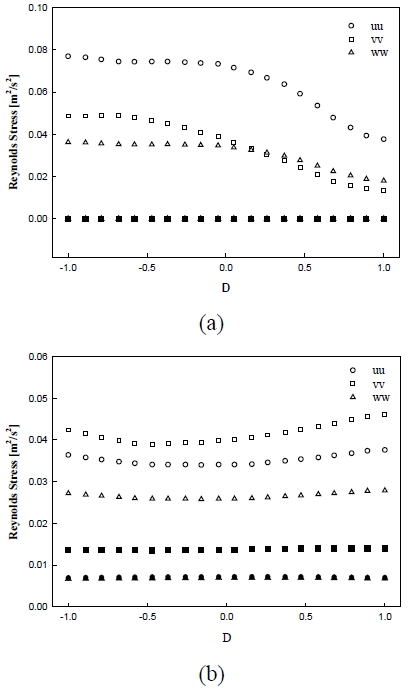
Reynolds stress behavior of uu, vv, and ww for the RS model (a) 20% disc opening, (b) 50% disc opening (D is nondimensional unit of disc, Empty: 5 x/Y, filling: 10 x/Y)
Figure 6 shows the Reynolds normal stress for the RS model, where uu, vv, and ww indicate the three components of the RS in the x, y, and z directions, respectively. The results indicated that the RS was isotropic. The RS was higher at x/Y = 5, indicating that excess values existed around the curved region.
The RS model typically predicts anisotropic stresses better near the disc region; therefore, it is better expressed than the k–ε model. The difference between the results of the turbulence models increased with decreasing disc opening angles. This can be attributed to the smaller effective flow region, where the relatively smaller area between the disc and the valve wall caused a large pressure drop and velocity increase, leading to increasing turbulence.
In summary, the RS model is a more accurate solution than the k–ε model for the valve and pipe flow problems; however, the k–ε model may be more powerful in terms of calculation time.
4. Conclusion
A numerical study of the flow behavior through the 300 mm sized TOBV was conducted with different turbulence models to examine the effect of the turbulence model of the k–ε and RS models. Different discrepancies between the numerical and experimental results were observed, and the RS model showed a considerably smaller discrepancy than the k – ε model. With a decreasing disc opening angle, a relatively smaller effective flow region between the disc and the wall caused a large pressure drop and velocity increase that could increase the turbulence. Higher turbulence owing to vortices was observed for the RS model, followed by the k – ε model expressed with higher turbulence kinetic energy. At developing location x/Y = 5, the turbulence effect was well expressed by the RS model. However, at developed location x/Y = 10, the turbulence effect was well expressed with the k–ε model rather than the RS model.
Nomenclatures
| ρ : | density (kg/m3) |
| P : | pressure (N/m2) |
| δij : | Kronecker delta tensor |
| τij : | turbulence Reynolds stress |
| k : | turbulent kinetic energy |
| μt : | turbulence viscosity |
| : | eddy viscosity |
| ui : | velocity components |
| Ui : | mean velocity component |
| : | velocity components of time average |
| x : | downstream location from the valve |
| Y : | nominal valve size |
| Φij : | pressure– strain term |
| ε : | dissipation rate |
| Sij : | mean velocity strain– rate tensor |
| ϕk, ϕε : | explicit wall term |
| Cij,C1ε,C2ε : | turbulence constant |
Acknowledgments
This work was supported by results of a study on the “Leaders in Industry-university Cooperation 3.0” Project, supported by the Ministry of Education and National Research Foundation of Korea, and in part by a grant from R&D Program (RP22139B) of the Korea Railroad Research Institute.
Author Contributions
Conceptualization, S. -W. Lee and S. -W. Choi; Methodology, S. -W. Lee and M. -S. Kim; Investigation, S. -W. Lee; Resources, M. -S. Kim; Data Curation, S. -W. Lee; Writing—Original Draft Preparation, M. -S. Kim; Writing—Review & Editing, S. -W. Choi; Visualization, S. -W. Choi; Supervision, M. -S. Kim.
References
- N. H. Kaartinen, and P. J. Juhala, “Fluid flow control device.” U.S. Patent No. 4,258,740. 31 Mar. 1981.
-
S. -W. Choi, H. -S. Seo, and H. -S. Kim, “Analysis of flow characteristics and effects of turbulence models for the butterfly valve,” Applied Sciences vol. 11, no. 14, p. 6319, 2021.
[https://doi.org/10.3390/app11146319]

-
P. Smith and R. W. Zappe, Valve selection handbook: engineering fundamentals for selecting the right valve design for every industrial flow application: Gulf Professional Publishing, 2004.
[https://doi.org/10.1016/B978-075067717-2/50002-X]

-
A. Del Toro, M. C. Johnson, and R. E. Spall, “Computational fluid dynamics investigation of butterfly valve performance factors,” Journal-American Water Works Association, vol. 107, no. 5, 2015.
[https://doi.org/10.5942/jawwa.2015.107.0052]

-
M. K. Sharma, M. K. Verma, and S. Chakraborty, “Anisotropic energy transfers in rapidly rotating turbulence,” Physics of Fluids, vol. 31, no. 8, 2019.
[https://doi.org/10.1063/1.5109856]

-
X. Wu, J. M. Wallace, and J. -P. Hickey, “Boundary layer turbulence and freestream turbulence interface, turbulent spot and freestream turbulence interface, laminar boundary layer and freestream turbulence interface,” Physics of Fluids, vol. 31, no. 4, 2019.
[https://doi.org/10.1063/1.5093040]

-
H. Li and Z. Yang, “Separated boundary layer transition under pressure gradient in the presence of free-stream turbulence,” Physics of Fluids, vol. 31, no. 10, 2019.
[https://doi.org/10.1063/1.5122889]

-
W. P. Jones and B. E. Launder. “The prediction of laminarization with a two-equation model of turbulence,” International Journal of Heat and Mass Transfer, vol. 15, no. 2, pp. 301-314, 1972.
[https://doi.org/10.1016/0017-9310(72)90076-2]

-
B. E. Launder and B. I. Sharma, “Application of the energy-dissipation model of turbulence to the calculation of flow near a spinning disc,” Letters in Heat and Mass Transfer, vol. 1, no. 2, pp. 131-137, 1974
[https://doi.org/10.1016/0094-4548(74)90150-7]

- Williams, S.; Trembley, J.; Miller, J.P. Flow Monitoring using Flow Control Device. U.S. Patent No. 7,092,797, 15 August 2006.
- ISA. Standard, Control Valve Sizing Equations for Compressible Fluids, ISA-S75; The International Society of Automation: Research Triangle Park, NC, USA, 2007.
- ISA. Standard, Control Valve Capacity Test Procedures, ISA-S75; The International Society of Automation: Research Triangle Park, NC, USA, 2007.
- KS B 2101; Test Procedures for Flow Coefficient Valves. Korean Standards Association: Seoul, Korea, 2003.
-
J. Lee, et al., “Analysis of hydraulic characteristics according to the cross-section changes in submerged rigid vegetation,” Journal of Ocean Engineering and Technology, vol. 36, no. 5, pp. 326-339, 2022.
[https://doi.org/10.26748/KSOE.2022.028]

-
T. -Y. Kim, G. -M. Jeon, and J. -C. Park, “CFD simulation of multiphase flow by mud agitator in drilling mud mixing system,” Journal of Ocean Engineering and Technology vol. 35, no. 2, pp. 121-130, 2021.
[https://doi.org/10.26748/KSOE.2021.010]

-
J. Kim, S. Heo, and W. Koo, “Analysis of dynamic response characteristics for 5 MW jacket-type fixed offshore wind turbine,” Journal of Ocean Engineering and Technology, vol. 35, no. 5, pp. 347-359, 2021.
[https://doi.org/10.26748/KSOE.2021.058]


