Measurement of flame temperature using silicon carbide and thermal imaging camera
Copyright © The Korean Society of Marine Engineering
This is an Open Access article distributed under the terms of the Creative Commons Attribution Non-Commercial License (http://creativecommons.org/licenses/by-nc/3.0), which permits unrestricted non-commercial use, distribution, and reproduction in any medium, provided the original work is properly cited.
Abstract
Recently, the diversification of fuels in the field of ship energy has been recognized as an essential market change in emission reduction regulations. In particular, the fuel blending of LNG ships is the most common technology that can reduce carbon dioxide emissions without replacing existing diesel engines. Precise measurement of the flame temperature is essential for connecting an existing diesel engine with a new fuel composition. This study verified the possibility of measuring flame temperature by using thermal imaging cameras with the advantages of non-contact measurement, wide-area measurement, and real-time measurement. Thin filament pyrometry (TFP) technology is applied according to the thermal imaging camera characteristics, and errors between measurement areas are minimized using the inverse square law. Bunsen premixed flames (equivalence ratios: 0.7, 1.0, and 1.3) and a counter-diffusion flame were adopted to measure the flame temperature by using 1D numerical calculations. The measurement distances between the flame and the camera were 40, 45, and 50 cm. The obtained results showed a maximum accuracy of 96% for the Bunsen premixed flame compared to the calculation. Based on these data, a verification test was conducted on the counter-diffusion flame, and an error rate of 1.3% was obtained using the method proposed in this study.
Keywords:
Inverse square law, Thin filament pyrometry, Bunsen flame, Counter-diffusion flame, Premixed flame1. Introduction
The response to air pollution is a global trend and is also critical in the shipping industry. In particular, in efforts to cope with greenhouse gases (GHG) such as CO2, various energy procedures, such as the energy efficiency design index (EEDI), energy efficiency existing ship index (EEXI), ship energy efficiency management plan (SEEMP), and carbon intensity indicator (CII), are closely related to energy efficiency management [1][2][3]. In other words, energy efficiency management goes beyond the purpose of optimal device efficiency and makes a significant contribution in terms of environmental protection through carbon emission reduction.
Recently, in the marine shipbuilding industry, the most prominent technology in energy efficiency management based on carbon emission reduction has focused on extending the use of existing diesel engines through fuel blending with LNG. To increase the synchronization between the new blending fuel and existing diesel engines, the gas expansion rate, which is related to gas explosions during the four-stroke process, must be similar to that of general diesel fuel. According to the ideal gas law, the gas expansion rate can be estimated in proportion to the temperature of the combustion reaction. Therefore, a precise measurement of the combustion temperature is essential for the use of new blending fuels [4][5].
Table 1 lists the characteristics of the methods used for the temperature measurement. The commonly used thermocouple method is the point measurement method, which has been studied for many years owing to its convenient device construction, and has the disadvantage of not being able to accurately measure a continuous temperature distribution. There are contactless technologies such as coherent anti-Stokes Raman spectroscopy (CARS) and tunable diode laser observation spectroscopy (TDRAS); however, they are not popular for non-real-time, expensive equipment [4][6][7].
Infrared thermal imaging technology has advantages such as non-contact measurement, wide-area measurement, and real-time measurement. Therefore, it is widely used in various industrial groups to measure continuous temperature distributions. It is used for non-destructive inspection and preventive maintenance in many fields, such as electrical, medical, aviation, railway, and composite materials, and is expanding to include structural design and manufacturing process control management [8][9]. However, because temperature measurement through thermal imaging technology is a method of measuring the infrared energy emitted from a solid surface, it is considerably difficult to measure the temperature of a gas, which emits significantly less infrared energy. Kim et al. [10] estimated the temperature fields of ultrasonic atomized slit-jet flames using a photograph with a thermal imaging camera and a high-speed camera. They confirmed that the thermal radiation energy of various wavelength bands is emitted from the combustion field; however, only a few visible wavelength areas are recognized as flames in high-speed cameras. Whereas, thermal imaging cameras can be visualized, including wide wavelength bands. Therefore, gas temperature measurement using a thermal imaging camera has the advantage of being able to visualize wide wavelength bands. However, it has the disadvantage of being unable to evaluate the exact temperature value.
Thin film pyrometry (TFP) is a technique for measuring temperature by using extremely thin filaments. Silicon carbide (SiC), which is mainly used as the filament material, has a thermal conductivity 40 times lower than that of R-type thermocouples. Furthermore, the error caused by soot was minimized. Many previous studies have reported temperature-correction relationships based on the intensity of SiC emission using intensified charge-coupled device (ICCD) cameras, digital cameras, and indium-gallium-arsenic detectors [11][12][13][14].
In this study, to precisely evaluate the gas temperature by using a thermal imaging camera, the temperature was measured in a counter-diffusion flame after performing temperature calibration with SiC. The results of the measured temperature can be guaranteed by conducting a validation with the 1D simulation results to ensure reliability.
2. Experimental method
2.1 Thermography measurement principle
A thermal imaging technique can be applied in the infrared region, which allows the measurement of the surface temperature of all objects [8][9][15]. The temperature measured by the thermal imaging camera can be expressed in terms of spectral colors. Equation (1) is the basis of the principle of infrared thermal imaging based on Stefan–Boltzmann’s law. The total radiant energy radiated from a black body as an abnormal substance is proportional to four squares of its absolute temperature, and the emissivity varies depending on the type, surface, and wavelength of the object based on the black body emissivity value of 1. If radiant energy is applied to an object, it is transmitted, reflected, absorbed, and emitted. If the object is black, the incident energy is completely absorbed by the object and then re-emitted [8][15][16][17].
| (1) |
The main specifications of the thermal imaging camera used in this study are listed in Table 2. The measurable range of temperature is +300 °C to +2000 °C, and it has a resolution that can be measured at intervals of emissivity of 0.01. In order to extract the relative RGB difference per pixel, the temperature spectrum was fixed with the widest possible emissivity. The main factors affecting the correction temperature are: emissivity, reflection temperature, relative humidity, atmospheric temperature, and object distance. In this study, the flame conditions and photographic distance were set as variables, whereas the other conditions remained constant.
2.2 Experiment setup
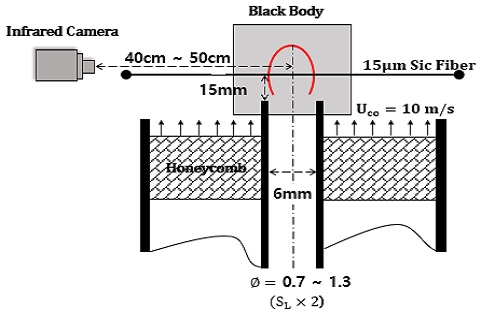
Figure 1 shows the configuration diagram of the Bunsen burner used in this experiment. The burner consisted of a 6 mm diameter main nozzle made of copper tubes and a ceramic honeycomb used to homogenize the flow around the nozzle.
Because soot formation affects radiative heat loss, methane, with the least amount of soot formation, was used as the main fuel. Moreover, air was premixed to conduct the experiment on a premixed flame with a uniform temperature compared to a diffusion flame.
By adjusting the air and composition ratio, the flame was photographed in three stages of rich and lean areas based on the stoichiometric ratio, with equivalence ratios of 0.7, 1.0, and 1.3. To minimize the external influence on the flame, N2, which is an inert gas, was supplied around the nozzle. To maintain a constant flow rate, it was controlled through the mass flow controller according to each gas, and the flow rate was set constant at twice the flame propagation speed, according to the standards set by CHEMKIN.
A SiC fiber with a diameter of 15 μm was installed 15 mm above the nozzle rim, which is the middle point of the three flame sizes, to minimize the effect of heat loss during flame propagation and that of change in flame size. The distance from the center of the flame to the center of the camera lens was adjusted to 40, 45, and 50 cm in three stages using the X—Z Stage, and the effect of the difference between the object and the camera position on the temperature measurement was confirmed. After calibration of the thermal imaging camera, the degree of damage to the SiC fiber was evaluated using an optical microscope (Nikon, LV150) provided by the Eco-friendly Shipbuilding Core Research Support Center. Based on the obtained results, it was confirmed that the damage to the SiC fiber was negligible under all experimental conditions used in the present study.
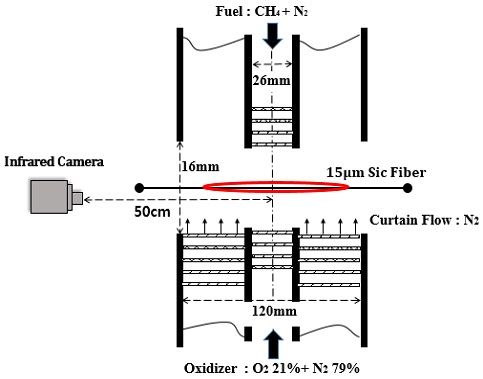
Figure 2 shows a configuration diagram of the counterflow burner used to verify the experimental results obtained in the case of Bunsen premixed flame. A gaseous mixture of methane and nitrogen was supplied as fuel to the upper nozzle, and oxygen and nitrogen were mixed by the lower nozzle to supply an oxidizing agent identical to the air component. Nitrogen was supplied around the fuel and oxidant nozzles to minimize the ambient effects. To maintain a uniform fluid flow, several layers of mesh were installed in the inner tube of the nozzle. The distance between the nozzle center and the camera lens was fixed at 50 cm.
In the case of diffusion flames, an error of radiation heat is generated due to soot particles. Therefore, in the case of the Bunsen burner corresponding to the calibration of the thermal imaging camera, a premixed flame was adopted to ignore the effects of radiation heat due to soot particles. In contrast, in the case of the counterflow burner, which was used to verify the corrected thermal imaging camera, diffusion flames were adopted. Most combustion environments used in engines, generators, and boilers in ships involve a diffusion process. Therefore, when measuring the temperature with a thermal imaging camera, soot particles generated from the actual diffusion flame may introduce errors that depend on their number density. Hence, it is necessary to avoid measuring the temperature of the flame with a relatively large amount of soot particles. Nevertheless, non-contact temperature measurement using a thermal imaging camera has the advantage of easy installation and obtaining a 2D temperature distribution; therefore, if the measurement error is minor, the error of radiation heat may be ignored. In addition, it would be difficult to correct every time owing to different emissivity values depending on the gas species; however, if the measuring target is limited to the combustion environment, most of the carbon dioxide of the burned gases is occupied, which allows us to treat it as a single chemical.
2.3 Data analysis
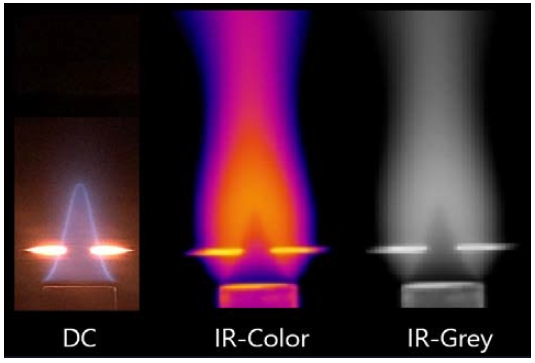
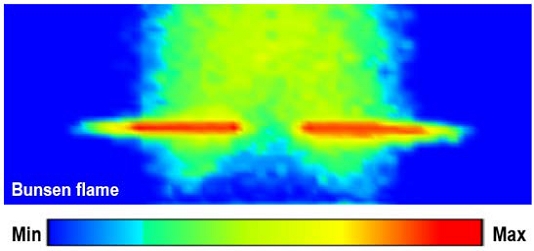
Figure 3 shows an image of the Bunsen premixed flame used in this experiment, where measurements were performed using a digital camera and a thermal imaging camera. Digital cameras have limitations in temperature correction because the intensity near SiC appears supersaturated regardless of the experimental case. IR cameras can expand the temperature spectrum during the process of converting radiant energy into temperature, thereby suppressing intensity supersaturation. The temperature spectrum range is set equal to 800–3000 °C by using software provided by the camera manufacturer so that the RGB value of a photographed image did not show a saturation value. Using Matlap code, RGB values were corrected to grey values for the 108 pixels × 48 pixels range up and down based on the SiC line, and the highest value was selected. Three or more images taken under the same conditions were analyzed, and excessive error values caused by sunburn, external light, etc., were ignored.
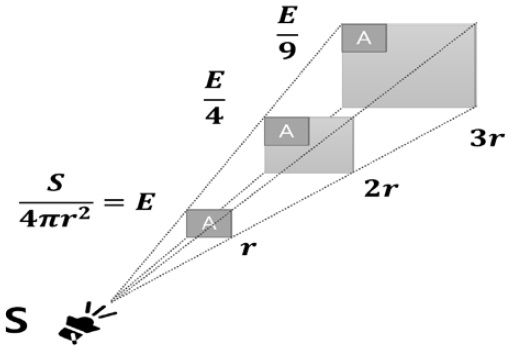
According to the inverse square law, physical quantities, such as light, electricity, sound, and radiant energy are inversely proportional to the square of the measured distance from the light source [18][19]. Figure 4 shows a schematic of the inverted square method, where S represents the light source and r represents the measured distance. The amount of divergent light source is constant, and the farther the measuring distance from the light source, the more diffused the area occupied by the light source becomes depending on the square of the radius. Meanwhile, because the density of the light source per unit area (A) decreases, the intensity of the light source decreases at the same rate. When the distance from the light source is short (6 cm or less), it shows an uneven dose distribution owing to mutual interference. However, the application of the law is considered appropriate because of the constant dose distribution over a long distance [20].
To match the change in size of the flame image according to the shooting distance based on the unit area per pixel, a correction operation was performed by applying the ratio of each image. An example of the final correction results is shown in Figure 5.
A correction operation was performed matching the highest value of the final corrected emission intensity with the flame maximum temperature value calculated using the CHEMKIN (GRI Mech 3.0 code) program, which is a combustion reaction simulation program. To verify this, the image captured with the counterflow diffusion flame was analyzed using the same procedure, and the accuracy of the linearized results was confirmed through the emitted emission values.
Accordingly, the temperature characteristics, which depend on the measured distance and equivalence ratio, were confirmed, and the applicability of the thermal imaging cameras to flame-temperature measurement was studied.
3. Results and discussion
3.1 Bunsen premixed flame
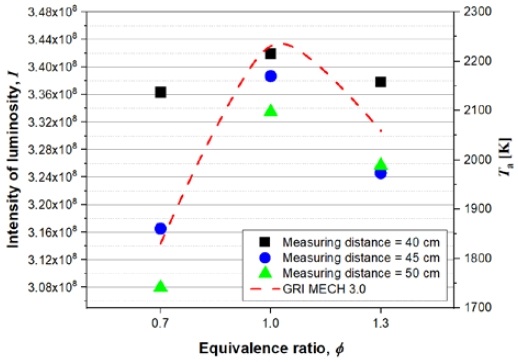
Figure 6 shows the intensity measurement results based on the equivalence ratio. Each symbol represents an experimental result based on the measured distance, and the dotted line shows the simulation results for comparison with the experimental results. All measurements, regardless of distance, showed a C-curve shape similar to the simulation results. The closer the distance from the lens in the same flame, the higher the intensity, and the difference between the maximum and minimum values was 5.607E+06, 2.214E+07, and 2.552E+07, on the order of 40, 45, and 50 cm, respectively. For 40 cm, this difference is more than four times lower than for 45 cm and 50 cm, which can lead to inaccurate results because temperature and correction distributions require a narrow range of temperature distribution.
As shown in Table 3, the difference in intensity results by equivalence ratio and measuring distance was confirmed to be 94%–103% in 0.7 flame, 99%–102% in 1.0 flame, and 96%–100% in 1.3 flame based on a measuring distance of 45 cm. This is more suitable for rich combustion than lean combustion. As mentioned above, the thermal imaging camera is a principle for measuring the radiation energy expressed as an object, it was confirmed that the intensity difference due to distance is small in a rich flame with a relatively high particle fuel ratio appearing in the mass concept.
However, the difference when the measuring distance is small can be attributed to the greater effect of interference between self-luminescence and radiation generated in the oxidation reaction.
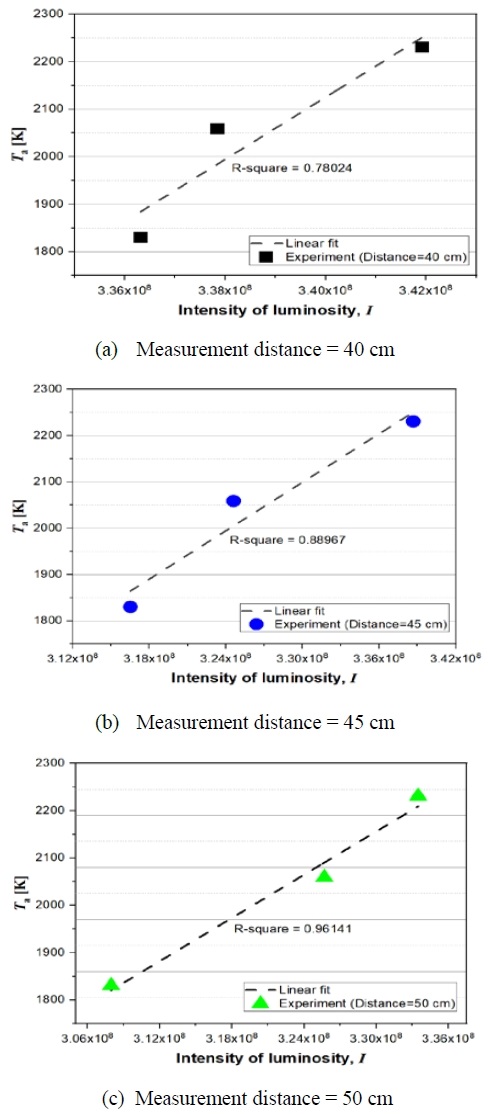
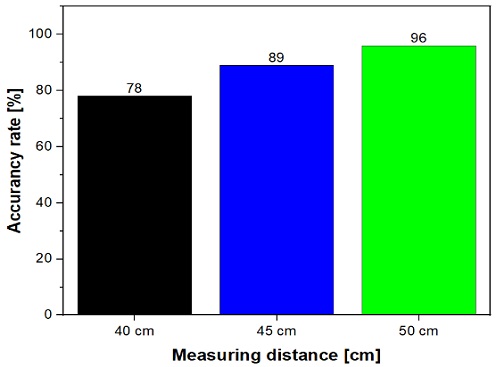
Figure 7 shows the linear representation of the experimental results and simulation values to match the intensity and temperature; the linear fit line is expressed as a dotted line. At measurement distances of 40 cm and 45 cm, the experimental results are similar to the linear line in the high-temperature region; however, relative errors appear in the low-temperature region, and the difference is larger at 40 cm than at 45 cm. In the case of 50 cm, the graph is almost identical in the low-temperature and high-temperature areas and shows a high accuracy of 96%, as shown in Figure 8.
As stated above, because the thermal imaging camera measures the radiant energy expressed by an object, it was confirmed that the difference in intensity according to the distance was small in a rich flame with a relatively high proportion of particulate fuel, which is represented by the concept of mass.
3.2 Counterflow diffusion flame
To verify the accuracy of the flame-temperature measurement, an experiment was conducted by applying the same procedure to a counterflow diffusion flame at a measurement distance of 50 cm, which showed the highest accuracy in Section 3.1.
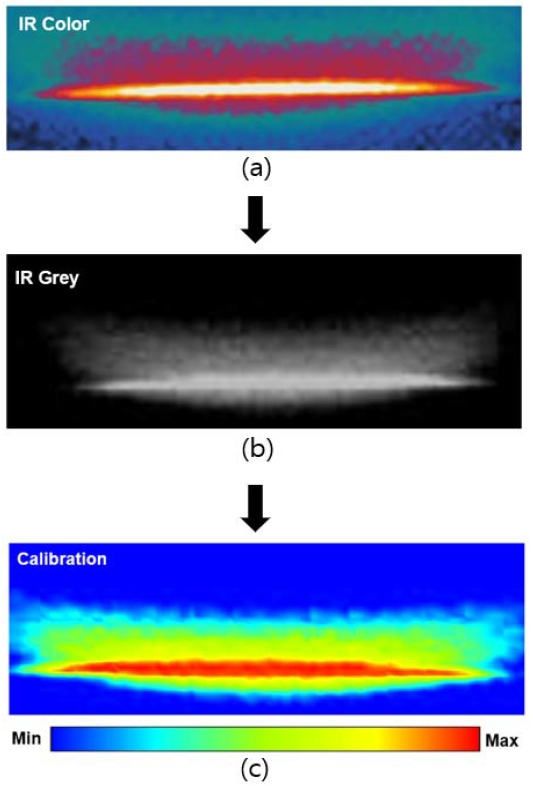
Figure 9 shows an image obtained by photographing a two-dimensional counterflow diffusion flame with a strain ratio of 25. The results of inserting SiC in the center of the flame and taking it at a distance of 50 cm are shown in Figure 10(a), and the RGB values, which are represented by three values, as shown in Figure 10(b), were converted into grey colors to change them to a single value.
The inverse square law was applied to correct the error according to the distance between pixels from the lens, and the highest value among these pixels was selected. This was compared and analyzed with the simulation results of counterflow diffusion flames under the same conditions.
Figure 10(c) shows the final corrected pixel result as a color spectrum. Table 4 shows the results of the comparison between the experimental and simulation data. As a result of substituting the intensity into the linear function extracted in Section 3.3, it was converted to a temperature of 1825.3 K, which was 24.1 K higher than the maximum temperature of 1801.4 K of the simulation, resulting in an error rate of 1.3%.
4. Conclusion
This study confirmed the possibility of measuring flame temperature by using a thermal imaging camera and SiC. The results are presented below:
- 1) The closer the measurement distance, the narrower the intensity gap in the same temperature spectrum.
- 2) The accuracy of the temperature measurement was highest at 50 cm, the longest distance among the cases in this study. It is judged that the accuracy increases as the distance increases because the effect of the self-luminescence generated in the oxidation reaction and the mutual interference of radiant light act more significantly at a short distance.
- 3) Based on the linear graph, the closer the measurement distance, the larger the error in the low-temperature region, and there is little effect on the measurement distance in the high-temperature region.
- 4) It was found that the rich flame was less affected by the measurement distance than the lean flame.
- 5) As a result of applying it to a counterflow diffusion flame, the error rate between the simulated and experimental temperatures was 1.3%.
As a result of this study, a linear function between the flame temperature and light emission was obtained through a thermal imaging camera and SiC in a premixed flame, which was quantitatively verified by substituting it with a diffused flame. These results indicate that the thermal imaging camera is suitable for flame-temperature measurements.
Based on these results, the possibility of application at an appropriate industrial site that considers the error rate is expected. In the future, because the influence of external radiant energy acts on the atmosphere, a study that expands the variable conditions will be conducted to expand its utilization.
These results indicate that the thermal imaging camera is suitable for flame-temperature measurements. Hence, the possibility of their application in appropriate industrial fields is improved. In particular, the non-contact temperature measurement method using a thermal imaging camera is considered to be effortless when checking the temperature distribution inside the diesel engine, boiler room, and in the fire caused by hydrogen leakage, which cannot be distinguished by the naked eye.
Acknowledgments
This work was supported by the Technology Innovation Program (20005750, Commercial Development of Combustion System Control Technology for Minimizing Pollutant with Multiple Analysis) funded by the Ministry of Trade, Industry & Energy (MOTIE, Republic of Korea).
Author Contributions
Conceptualization, J. S. Kim and S. H. Yoon; Methodology, J. S. Kim; Software, D. G. Park; Validation, J. S. Kim and S. H. Yoon; Formal Analysis, J. S. Kim; Resources, J. H. Choi and D. G. Park; Data Curation, J. S. Kim and D. G. Park; Writing—Original Draft Preparation, J. S. Kim; Writing—Review & Editing, J. H. Choi and D. G. Park; Visualization, J. S. Kim; Supervision, S. H. Yoon.
References
-
L. Bilgili, “Life cycle comparison of marine fuels for IMO 2020 Sulphur Cap,” Science of The Total Environment, vol. 774, p. 145719, 2021.
[https://doi.org/10.1016/j.scitotenv.2021.145719]

-
T. Chu Van, et al., “Global impacts of recent IMO regulations on marine fuel oil refining processes and ship emissions,” Transportation Research Part D: Transport and Environment, vol. 70, pp. 123-134, 2019.
[https://doi.org/10.1016/j.trd.2019.04.001]

-
Y. Shi, “Reducing greenhouse gas emissions from international shipping: Is it time to consider market-based measures?,” Marine Policy, vol. 64, pp. 123-134, 2016.
[https://doi.org/10.1016/j.marpol.2015.11.013]

-
T. Kamimoto, Y. Deguchi, and Y. Kiyota, “High temperature field application of two-dimensional temperature measurement technology using CT tunable diode laser absorption spectroscopy,” Flow Measurement and Instrumentation, vol. 46, pp. 51-57, 2015.
[https://doi.org/10.1016/j.flowmeasinst.2015.09.006]

-
K. Akihama, et al., Mechanism of the smokeless rich diesel combustion by reducing temperature,” Sae Transactions, pp. 648-662, 2001.
[https://doi.org/10.4271/2001-01-0655]

-
Z. Wang, et al., “Two-dimensional temperature measurement characteristics in pulverized coal combustion field by computed tomography-tunable diode laser absorption spectroscopy,” Applied Thermal Engineering, vol. 171, 2020.
[https://doi.org/10.1016/j.applthermaleng.2020.115066]

-
R. P. Lucht, et al., “Unburned gas temperatures in an internal combustion engine. I: CARS temperature measurements,” Combustion Science and Technology, vol. 55, no. 1-3, pp. 41-61, 1987.
[https://doi.org/10.1080/00102208708947070]

-
C. -S. Ro, K. -S. Kim, and H. -S. Chang, “Method for measuring weld temperature using an infrared thermal imaging camera,” Journal of the Korean Society for Nondestructive Testing, vol. 34, no. 4, pp. 299-304, 2014 (in Korean).
[https://doi.org/10.7779/JKSNT.2014.34.4.299]

-
S. Lee, et al., “Distortion correction of surface temperature measurement using an infrared camera,” Journal of the Korean Society for Aeronautical & Space Sciences, vol. 44, no. 7, pp. 545-551, 2016 (in Korean).
[https://doi.org/10.5139/JKSAS.2016.44.7.545]

-
M. S. Kim, et al., “Visualization of the combustion-field in ultrasonically-atomized slit-jet flame using a thermographic camera,” Journal of the Korean Society of Propulsion Engineers, vol. 20, no. 4, pp. 1-8, 2016 (in Korean).
[https://doi.org/10.6108/KSPE.2016.20.4.001]

-
W. M. Pitts, K. C. Smyth, and D. A. Everest, “Effects of finite time response and soot deposition on thin filament pyrometry measurements in time-varying diffusion flames,” Symposium (International) on Combustion, vol. 27, no. 1, 1998.
[https://doi.org/10.1016/S0082-0784(98)80447-5]

-
P. B. Kuhn, et al., “Soot and thin-filament pyrometry using a color digital camera,” Proceedings of the Combustion Institute, vol. 33, no. 1, pp. 743-750, 2011.
[https://doi.org/10.1016/j.proci.2010.05.006]

-
B. Ma, et al., “Intensity-ratio and color-ratio thin-filament pyrometry: Uncertainties and accuracy,” Combustion and Flame, vol. 161, no. 4, pp. 908-916, 2014.
[https://doi.org/10.1016/j.combustflame.2013.10.014]

-
L. G. Blevins, et al., “Experimental study of temperature and CH radical location in partially premixed CH4/air coflow flames,” Combustion and Flame, vol. 118, no. 4, pp. 684-696, 1999.
[https://doi.org/10.1016/S0010-2180(99)00023-1]

-
K. -W. Park and S.-H. Kim, “Analysis of plume radiant intensity using image output values of infrared cameras,” Journal of the Korean Institute of Illuminating and Electrical Installation Engineers, vol. 36, no. 8, pp. 1-7, 2022 (in Korean).
[https://doi.org/10.5207/JIEIE.2022.36.8.001]

-
C. -H. Kim and J. -Y. Lee, “A study of automatic recognition on target and flame based gradient vector field using infrared image,” Journal of the Korean Society for Aeronautical & Space Sciences, vol. 49, no. 1, pp. 63-73, 2021 (in Korean).
[https://doi.org/10.5139/JKSAS.2021.49.1.63]

-
D. -I. Kim, et al., “Responsivity and noise evaluation of infrared thermal imaging camera,” Journal of the Korean Society for Nondestructive Testing, vol. 33, no. 4, pp. 342-348, 2013 (in Korean).
[https://doi.org/10.7779/JKSNT.2013.33.4.342]

-
R. Newman, E. Berg, and P. Boynton, “Tests of the gravitational inverse square law at short ranges,” Space Science Reviews, vol. 148, no. 1, pp. 175-190, 2009.
[https://doi.org/10.1007/s11214-009-9540-7]

-
N. Voudoukis and S. Oikonomidis, “Inverse square law for light and radiation: A unifying educational approach,” European Journal of Engineering and Technology Research, vol. 2, no. 11, pp. 23-27, 2017.
[https://doi.org/10.24018/ejeng.2017.2.11.517]

-
S. Marcie, et al., “The inverse square law: A basic principle in brachytherapy,” Cancer Radiotheraphy, vol. 26, no. 8, pp. 1075-1077, 2022.
[https://doi.org/10.1016/j.canrad.2022.04.002]


