Variations of swirl center according to evaluation position in steady flow bench of SI engine
Copyright © The Korean Society of Marine Engineering
This is an Open Access article distributed under the terms of the Creative Commons Attribution Non-Commercial License (http://creativecommons.org/licenses/by-nc/3.0), which permits unrestricted non-commercial use, distribution, and reproduction in any medium, provided the original work is properly cited.
In this study, the variations of swirl center according to evaluating position have been investigated in a steady flow bench of SI engine. For the experiments, two engine heads with different intake valve angles (11°and 26°) were tested in the flow bench by varying the evaluating position (1.75~6.0B) and valve lift (2~10 mm). Particle image velocimetry was used to measure the velocity field inside the engine cylinder. The swirl center position is found with a critical point theory and the intensity of turbulence is calculated from PIV velocity data. The results show that the center of swirl is located closer to the center of cylinder and turbulence intensity is lower, when the intake valve angle is the smaller. It is conventional to evaluate the swirl ratio at 1.75B position in the steady flow bench of SI engine. At this position, however, the distance of swirl center from the cylinder center scatters significantly for the variation of valve lift, and the turbulence intensity is much stronger regardless of the valve angle. Thus, to estimate the flow at the end of compression stroke in a real engine from the data in the steady flow experiments, the evaluation position should be moved further downstream more than 4.5B.
Keywords:
SI Engine, Particle image velocimetry, Swirl center, Critical point theory, Steady flow bench1. Introduction
There are many design parameters in a SI (spark ignition) engine such as intake valve angle, valve shape, number of valves, valve timing, port angle, port shape, manifold length, plenum chamber volume and so on. These parameters affect the intake flow characteristics which govern the combustion in the SI engine chamber since the flow is confined by the cylinder wall and piston [1]-[7]. In a microscopic aspect, turbulence in the intake flow plays an important role in combustion and flame speed. Whereas, in a macroscopic aspect, vortex flows such as tumble and swirl flows formed throughout the intake and compression strokes determine the mixing of fuel and air before the spark ignition. Thus, how to control the macroscopic flow is the key-point in the design of SI engine [8]-[11].
Figure 1 shows the sequential formation of tumble and swirl flows in an engine [12]. At the end of intake stroke, there exists a strong vertical flow by the downward movement of the piston, which is called a primary tumble. As soon as the piston starts to move upward with the intake valve closed, a secondary tumble is formed. At the final stage of the compression stroke, the movement of the piston becomes so slow that the tumbles turn into swirl flow in a stable manner. The increase of swirl velocity can enhance the efficiency of combustion. The swirl flow formed inside the engine cylinder is affected by the intake valve angle and valve lift as well as the shape of engine head. To measure such properties, a steady cold flow bench is commonly used prior to test the engine performance in a real combustion status.
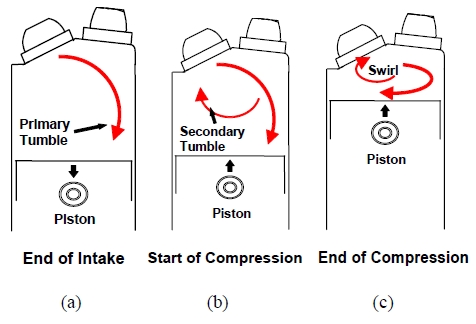
Tumble and swirl flows in an engine from intake to compression stroke, (a) primary tumble at the end of intake stroke, (b) secondary tumble at the start of compression, (c) swirl flow at the end of compression
In the steady flow bench, the swirl flow is evaluated at 1.75B (Bore) downstream from the intake valve in general [13]. This evaluation position has been conventionally determined by the assumption that the piston moves 1.0B during the intake stroke and 0.75B during the compression stroke, which gives rise to the total of 1.75B stroke before the spark ignition. However, there is a still question whether the evaluation position is sufficient for the vortex flow to be fully developed, or not [5]. Most of previous studies based on the steady flow bench have measured swirl ratio and flow coefficient at the position of 1.75B using an impulse swirl meter in order to match their quantities with the engine performance [5]-[8]. It is not reported yet how the swirl flow varies in the steady flow bench if the evaluation position moves downstream along the engine cylinder.
In this study, the variations of swirl center in a steady flow bench are investigated when the evaluating position of swirl is changed. At the cross-section of the engine cylinder, the velocity fields are measured by PIV (particle image velocimetry) technique [14]. After extracting the center of swirl flow, its variations are discussed for various intake valve angle and valve lift. In addition, the turbulence intensity is compared for the change of the evaluation position.
2. Experiments
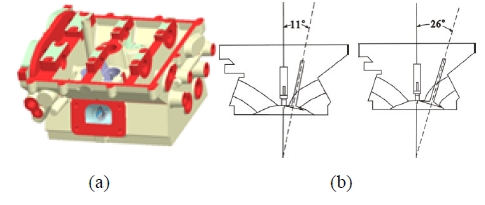
Figure 2 shows the test engine model used in this study. An engine model of 4-cylinder DOHC (double over head camshaft) SI engine head has two intake and exhaust ports. The length of bore (B) and stroke is 86 mm, and the swept volume is 499.5 cc. Two kinds of intake valve angle are used for the steady flow experiments. The present intake valve angles are 11° and 26°, respectively. The valve lift can be changed from 2~10 mm.
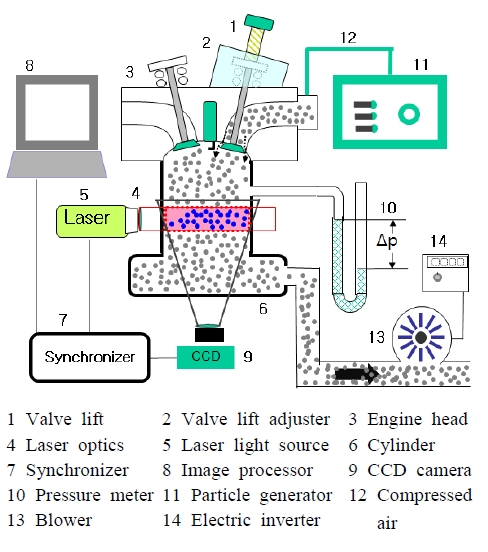
The setup of experimental system is shown in Figure 3. The steady flow bench consists of an engine head, a cylinder, an intake valve system and a blower controlled by an inverter. In order to make a similar condition with the intake flow in a real engine, the blower sucks air at the downstream of the cylinder, and thus atmospheric pressure condition is applied before the intake valve system. The difference between the pressure in the combustion chamber and atmospheric pressure is always kept constant as 3.73 kPa (15” H2O) by controlling the inverter of the blower.
For PIV measurements, a 30 mJ Nd:Yag laser with 532 nm wavelength (NewWave) and 1k × 1k CCD camera (Es1.0, Kodak) with a 85 mm lens are operated with a repetition time of 15Hz. As a seeding particle, an atomized olive oil with a mean diameter of 1 mm is seeded at the entrance of the intake valve using a particle generator (Six-jet Atomizer, TSI). The laser light source illuminates the streamwise plane and thus the time separation (25 ms) between the two laser pulses is applied as short as possible because of the strong out of plane motion of the seeded particles. To extract velocity vectors from the particle image, a commercial S/W (Insight, TSI) is used by setting the interrogation window as 32 × 32 pixels with a 50% overlap. To reduce the noise in images by the scattered light from the cylinder wall, a background image without particle is subtracted from the original images.
The measurement plane as an evaluation position of swirl flow is varied as 1.75B, 3.00B, 4.50B and 6.00B for the two valve angles. The valve lift is changed as 2, 3, 6, 8 and 10 mm. Thus the experiments are conducted for a total of 40 cases. In each case, a total of 200 velocity fields are acquired to give the mean and turbulent flow motions. From the PIV data, the vortex center or focus is extracted based on a critical point theory [15]. The critical point is defined as a point where the streamline slope is indeterminate and the absolute velocity is zero. There are several kinds of critical point such as focus, saddle and node. Among these points, focus is found when the eigenvalues of the velocity gradient tensor are complex numbers.
3. Results and Discussion
In this study, the cross-sectional flow fields are measured by changing the evaluation position of the steady flow bench for various intake valve angles and valve lifts. Figure 4 and Figure 5 show the velocity field according to the evaluation position at the valve lift 6 mm and the valve angle 11° and 26°, respectively. The swirl centers marked by cross (+) symbols are obtained from the critical point theory. The streamlines and swirl centers vary significantly as the evaluation position moves from 1.75B to 6.00B. When the evaluation position is located closer to the cylinder head (1.75~3.0B), the vortex pattern is more eccentric and thus the swirl center is located far from the cylinder center. As the evaluation position moves downstream, the vortex flow gets stable and fully developed. The location of swirl center is also affected by the valve lift. As the valve lift goes higher, the flow rate injected into the engine cylinder increases, which means the increase of axial and angular momentum of the intake flow. By the confined wall of the engine cylinder, the variation in the ratio of axial and angular momentum gives rise to different vortex patterns according to the valve lift as shown in Figure 6. Thus, the quadrant where the swirl center is located, is not fixed. Especially, at the upstream evaluation position, the quadrant is more scattered and no systematic feature can be found. However, at the downstream evaluation position, the swirl center exists closer to the cylinder center.
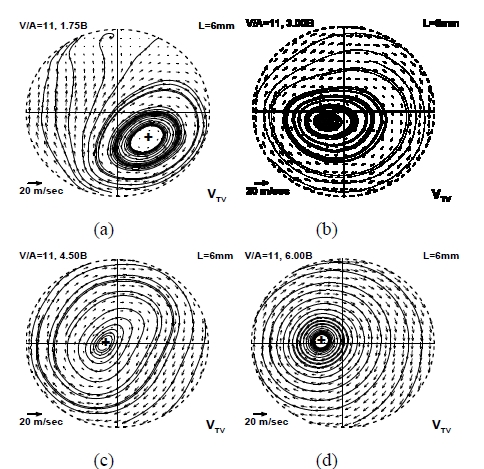
Streamline and swirl center according to the evaluation position at the valve lift 6 mm and the valve angle 11°; (a) 1.75B, (b) 3.0B, (c) 4.5B, (d) 6.0B
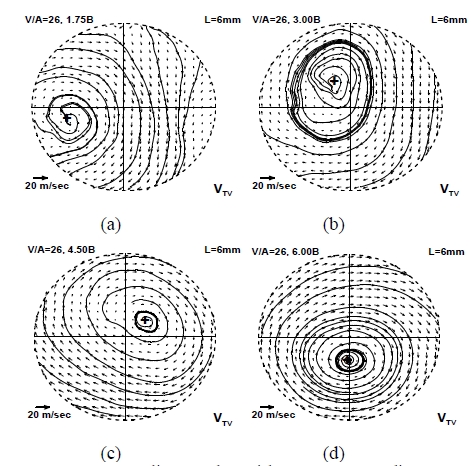
Streamline and swirl center according to the evaluation position at the valve lift 6 mm and the valve angle 26°; (a) 1.75B, (b) 3.0B, (c) 4.5B, (d) 6.0B
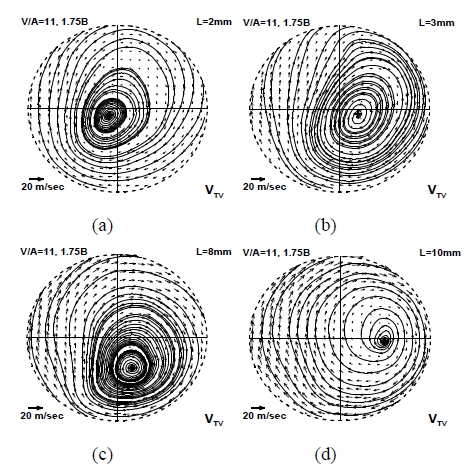
Streamline and swirl center according to the valve lift at the evaluation position 1.75B and the valve angle 11°; (a) 2 mm, (b) 3 mm, (c) 8 mm, (d) 10 mm
Figure 7 and Figure 8 show the absolute distance of swirl center measured from the cylinder center according to the evaluation position at valve angle 11° and 26°, respectively. On the whole, the center of swirl is located nearer to the center of cylinder at the smaller valve angle, since the injecting flow from the valve is more straightforward to the cylinder axis. At the evaluation position 1.75B, regardless of the valve angle, the distance of swirl center scatters significantly depending on the valve lift. If the valve lift increases, the distance of swirl center increases due to unstable tumble and swirl motions. Thus, the swirl flow measured at 1.75B, which is the conventional evaluation position, is strongly affected by the intake valve angle and lift. To measure the swirl ratio in the steady flow bench of SI engine, stable vortex flow is required, and thus the evaluation position of swirl needs to be moved further downstream.
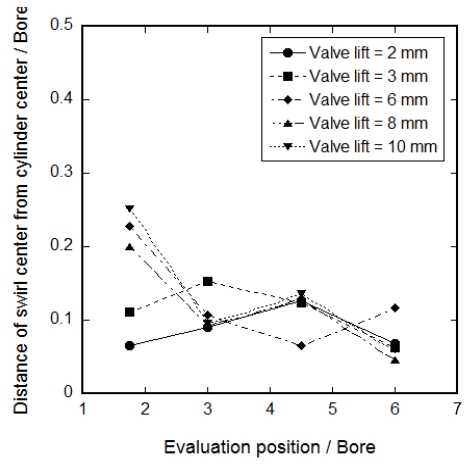
Absolute distance of swirl center from the cylinder center according to the evaluation position at valve angle 11°
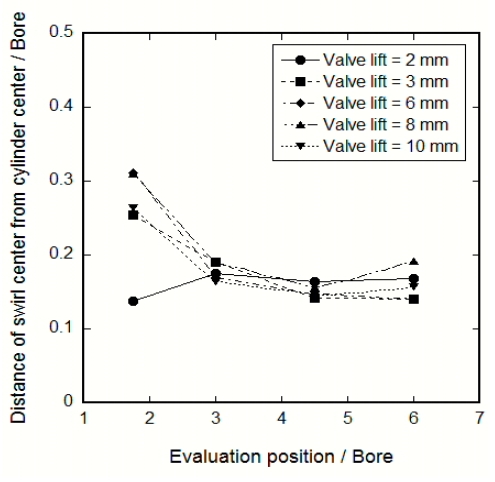
Absolute distance of swirl center from the cylinder center according to the evaluation position at valve angle 26°
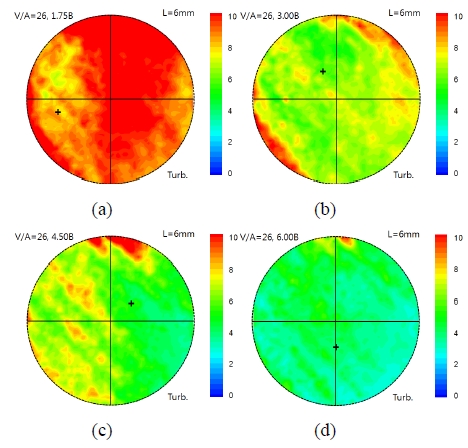
Figure 9 and Figure 10 show the distribution of turbulence intensity according to the evaluation position at the valve angle 11° and 26°, respectively. The swirl centers are marked by cross (+) symbols. At the evaluation position of 1.75B, the turbulence intensity is much stronger than that measured at the further downstream position. It means that the intake flow is not fully developed at 1.75B. The ejected flow through the intake valve is asymmetric because of the valve angle and the shape of valve seat. Axial and angular momentum of the flow are competitive in this region, which produces swirl and tumble flows, coincidently. The mixing of swirl and tumble gives rise to unsteady three-dimensional flows. If the flow is fully developed, only one helical vortex is formed. In the developing region, the variation of swirl center observed in cross-sectional plane is so significant that the turbulence intensity increases.
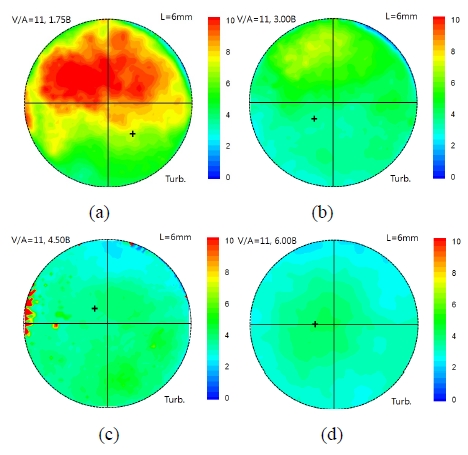
Turbulence intensity according to the evaluation position at the valve lift 6 mm and the valve angle 11°; (a) 1.75B, (b) 3.0B, (c) 4.5B, (d) 6.0B
4. Conclusions
The variations of swirl center have been investigated in the steady flow bench of SI engine. For various evaluation positions of swirl, the velocity fields were measured by PIV technique. The intake valve angle and lift were also varied to see the effect of them. At the small valve angle (11°), the center of swirl is located closer to the center of cylinder, and turbulence intensity is lower than those at the large valve angle (26°). At the conventional measurement position (1.75B), the distance of swirl center from the cylinder center scatters significantly for the variation of valve lift, and the turbulence intensity is much stronger regardless of the valve angle. Therefore, the evaluation of swirl ratio might be uncertain at 1.75B. Further downstream position more than 4.5B is required to evaluate the swirl in the steady flow experiments.
Acknowledgments
This subject is supported by Korea Ministry of Environment (MOE) as “Advanced Industrial Technology Development”.
This paper is extended and updated from the short version that appeared in the Proceedings of the International symposium on Marine Engineering and Technology (ISMT 2014), held at Paradise Hotel, Busan, Korea on September 17-19, 2014.
References
- A. A. Quader, “The axially-stratified-charge engine”, Society of Automotive Engineers, (820131), (1982).
-
I. Y. Ohm, and C. J. Park, “Effect of fuel stratification on initial flame development: Part 3-High swirl condition”, Journal of International Automotive Technology, 12(5), p653-660, (2011).
[https://doi.org/10.1007/s12239-011-0076-y]

- K. Horie, K. Nishizawa, T. Ogawa, S. Akazaki, and K. Miura, “The development of a high fuel economy and high performance four valve lean burn engine”, Journal of Society of Automotive Engineers, (920455), (1992).
- T. Inoue, S. Matsushita, K. Nakanishi, and H. Okano, “Toyota lean combustion system - The third generation system”, Journal of Society of Automotive Engineers, (930873), (1993).
- I. Y. Ohm, and C. J. Park, “In-cylinder compression flow characteristics according to inlet valve angle”, Transactions of Korean Society of Automotive Engineers, 14(4), p77-83, (2006).
-
I. Y. Ohm, and C. J. Park, “In-cylinder compression flow characteristics of helical port engines with wide valve angle”, Transactions of Korean Society of Mechanical Engineers, 32(1), p9-16, (2009).
[https://doi.org/10.3795/KSME-B.2009.33.1.9]

- I. Y. Ohm, and C. J. Park, “Effect of inlet valve angle on in-cylinder swirl generation characteristics (II)”, Transactions of Korean Society of Automotive Engineers, 17(1), p42-48, (2009).
- I. Y. Ohm, H.-S. Ahn, W.-J. Lee, W.-T. Kim, S.-S. Park, and D.-U. Lee, “Development of HMC axially stratified lean combustion engine”, Society of Automotive Engineers Transactions, 103(3), p1298-1311, (1994).
- I. Y. Ohm, K. S. Jeong, Y. Yoon, and I. S. Jeung, “Initial flame development under fuel stratified condition”, Society of Automotive Engineers Transactions, 107(3), p1796-1807, (1999).
- I. Y. Ohm, and Y. S. Cho, “Mechanism of axial stratification and its effect in an SI engine”, Society of Automotive Engineers Transactions, 109(4), (2001).
- I. Y. Ohm, and Y. Cho, “In-cylinder fuel behavior according to fuel injection timing and port characteristics in an SI engine: Part III-with high swirl”, Transactions of Korean Society of Automotive Engineers, 9(3), p18-26, (2001).
- I. Y. Ohm, Characteristics of Mixture Distribution and Flame Propagation in an SI Engine according to Intake Flow, Ph. D. Dissertation, Seoul National University, Seoul, (1997).
- Superflow Corporation, Superflow 600 Instructions, Colorado Springs, (1988).
-
J. Sung, and J. Y. Yoo, “Three-dimensional phase-averaging of time-resolved PIV measurement data”, Journal of Measurement Science and Technology, 12(6), p655-662, (2001).
[https://doi.org/10.1088/0957-0233/12/6/301]

-
A. E. Perry, and M. S. Chong, “A description of eddying motions and flow patterns using critical-point concepts”, Journal of Annual Review of Fluid Mechanics, 19, p125-155, (1987).
[https://doi.org/10.1146/annurev.fluid.19.1.125]


