Analysis on the performance and internal flow of a tubular type hydro turbine for vessel cooling system
Copyright © The Korean Society of Marine Engineering
This is an Open Access article distributed under the terms of the Creative Commons Attribution Non-Commercial License (http://creativecommons.org/licenses/by-nc/3.0), which permits unrestricted non-commercial use, distribution, and reproduction in any medium, provided the original work is properly cited.
The temperature of the main engine cabin of commercial vessel is very high. The material SS-316L undergoes creep damage at temperatures exceeding 450°C. It is essential to maintain the highly stressed engine cabin below the creep regime. Hence, seawater is employed in this kind of maritime vehicles as cooling liquid. It obtains the thermal energy at the cooling pipe line after passing through main engine cooling system. To harness the energy in the seawater, a turbine can be installed to absorb the energy in the seawater before being released into the sea. In this study, a cooling pipe line is selected to apply the tubular type hydro turbine for transferring the energy. Numerical analysis for investigating the performance and the internal flow characteristics of the tubular turbine is conducted. The results show that the maximum efficiency of 85.8% is achieved although the efficiency drops rapidly at partial flow rate condition. The efficiency descends slowly at the condition of excess flow rate. There is a relatively wide operating range of flow rate of this turbine to keep high efficiency at the excess flow rate condition. For the internal flow of the turbine, there is uniform streamline on the suction and pressure sides of the blade at the design point. However, the secondary flow appears at the suction and pressure sidesat the excess flow rate.In addition, it appears only at pressure side at the partial flow rate condition.
Keywords:
Small hydro power, Tubular type turbine, Performance, Internal flow, Cooling pipe line1. Introduction
The temperature of the main engine cabin of the commercial vessel is very high. The material of SS-316L undergoes creep damage at the temperatures exceeding 450°C. It is essential to maintain the highly stressed engine cabin below the creep regime [1]. Hence, seawater is employed in this kind of maritime vehicles as cooling liquid.
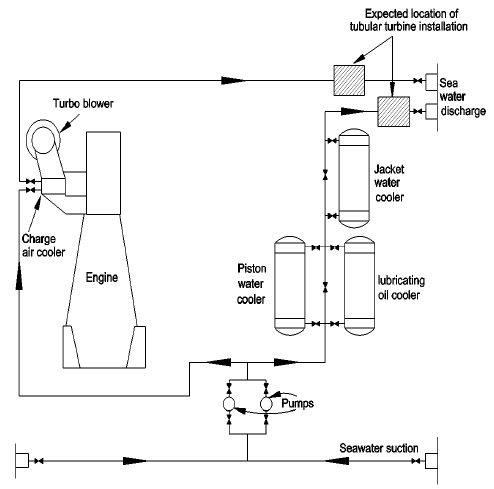
Figure 1 shows an example of the vessel seawater cooling system. From the seawater suction, one part of the seawater circulating pumps provides seawater to circulate the lubricating oil cooler, the jacket water cooler and the piston water cooler before discharging overboard. Another branch of the seawater mainly provides to directly cool the charge air.
The cold seawater is sucked into the cooling pipe line system from the bottom of the vessel and obtains the thermal energy after passing through main engine cooling system. Before releasing the working liquid into the sea, there is a pressure-reducing valve installed at the end of the cooling pipe line to control the seawater pressure at the cooling pipe line.
This kind of system wastes energy because the seawater consists of pressure and kinetic energy. To harness the energy in the seawater, a turbine can be installed instead of a pressure reducing valve. In this way, the turbine can absorb the energy in the seawater before being released into the sea, as shown in Figure 1.
In this study, a cooling pipe line is selected to apply the tubular type hydro turbine for transferring the energy because of its simple structure and inline type shape that are suitable for the inline pipe flow. From the numerical analysis on the tubular turbine, the performance and internal flow characteristics ofthe turbine can be clearly predicted, and also acquire the basic design data of the turbine.
Nam et al. [2] studied a tubular type small hydroturbine by different runner vane angles to investigate the internal flow characteristics by numerical analysis. Motycak et al. [3] studied a Kaplan turbine by numerical analysis and experiment analysis. The effect of the draft tube was investigated. These studies provide good understanding by using numerical analysis to predict the performance and internal flow characteristics of similar turbines.
2. Turbine Model and Numerical Methods
2.1 Turbine model
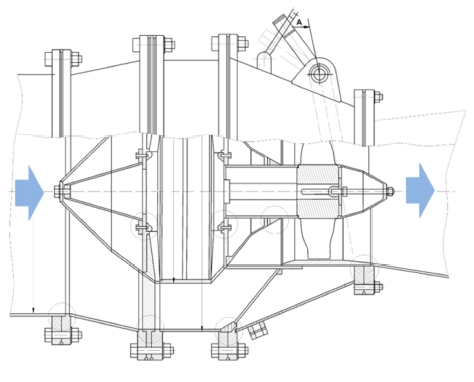
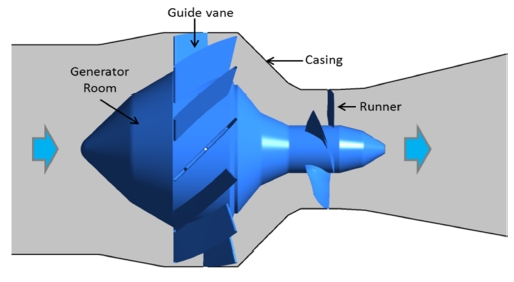
The two-dimensional schematic view of tubular type turbine, which is be used instead of the pressure-reducing valve in the cooling pipe line, is shown in Figure 2. Figure 3 shows the three-dimensional modeling view of the tubular type hydro turbine for vessel cooling system. The guide vane is installed before the runner. The fluid flow indicates a correct flow direction after passing through the guide vane passage to accommodate the runner blade.
The number of the runner blade is Z=4. The outer diameter of the runner is D=400 mm, and the inner diameter of the runner is d=160 mm, which mean that the diameter ratio is d/D=0.4. The number of the guide vane is Zg=12. The gap-to-chord ratio (cascade solidity) is l:t=1:1.05. The design point of the tubular type hydro turbine at the best efficiency point is H=5.5 m for the effective head, Q=0.45 m3/s for the water flow rate and rotational speed is n=800 min-1.
In this study, 7 cases with different flow rates are conducted to investigate the performance and internal flow characteristics of the tubular type hydro turbine as shown in Table 1. From Cases 1 to 7, the flow rate of the turbine increases gradually. The flow rate condition of Case 3 is the same with design point of the turbine.
2.2 Numerical methods
Computational Fluid Dynamic (CFD) analysis is a very useful tool for predicting hydraulic machinery performance, especially of hydro turbines, at various operating conditions [4]-[9]. For designer, prediction of operating characteristic is the one of the most important task. A commercial code of ANSYS CFX [11] is employed as a solver to conduct CFD analysis. The numerical methods and the boundary condition are set as shown in Table 2. The general connectionis set as the frozen rotor condition between the rotational domain and the fixed domain in the flow field for steady state calculation. The total pressure boundary condition is applied at the inlet of the calculation domain, and mass flow rate is set for the outlet of the domain.
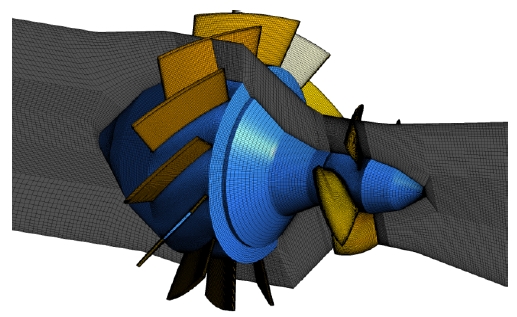
Figure 4 shows fine hexahedral numerical grids of the flow field around the guide vane and runner passage. The total numerical grids are composed by approximately 6.0×10⁶ elements number and about 6.2×10⁶ nodes, including the fluid domains of inlet extended pipe, guide vane, runner and draft tube extended pipe.
Table 3 shows the y+ values of the main domain. It can be seen that the y+ distribution at the runner surface and guide vane surface is low, which means that the mesh quality is good enough for the numerical calculation by this mesh.
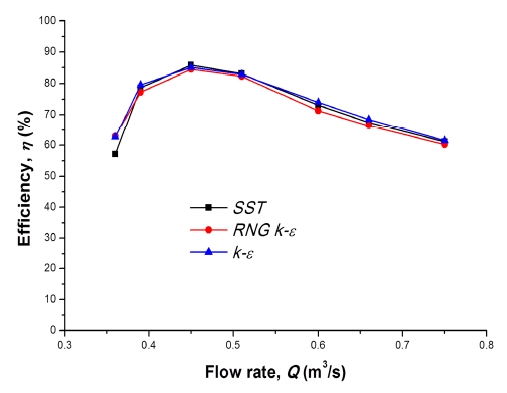
A suitable turbulence model is required for the complex flow phenomena that occur on the domain surface. Therefore, the turbulence analysis is carried out by applying different turbulence models to validate the results of this study. Figure 5 shows the turbulence model dependence test results. Three turbulence models of SST (Shear stress transport), k-epsilon (k-ε), RNG k-ε were tested with same boundary conditions and numerical methods. In general, the SST turbulence model shows relatively gradual change of efficiency by different flow rate. Moreover, the SST turbulence model has been well known to estimate both separation and vortex occurrence on the wall of a complicated blade shape. Therefore, the SST turbulence model is adopted in this study.
3. Results and Discussion
3.1 Numerical methods
When the water flows through the turbine, hydraulic losses may occur due to eddy formation in different components, such as change in flow direction as well as due to loss in kinetic energy at the exit of the turbine.
Considering only the hydraulic loss, the turbine efficiency is calculated by the following Equation (1):

where η is the turbine efficiency; P is the output power; ρ is the water density; g is the gravitational acceleration; Q is the flow rate and H is the effective head of the turbine.
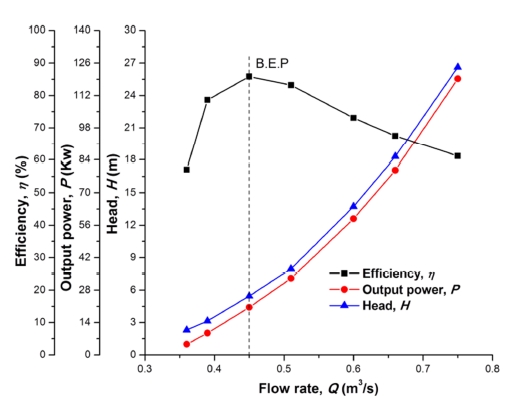
Figure 6 shows the performance curves of the tubular type hydro turbine model by CFD analysis. The best efficiency point (B.E.P) reaches 85.8% by flow rate of 0.45m3/s (Case 3). The efficiency drops rapidly at partial flow rate condition. However, the efficiency descends slowly at the excess flow rate condition. By increasing the water flow rate, the effective head and output power of the turbine rise effectively.
3.2 Pressure distribution
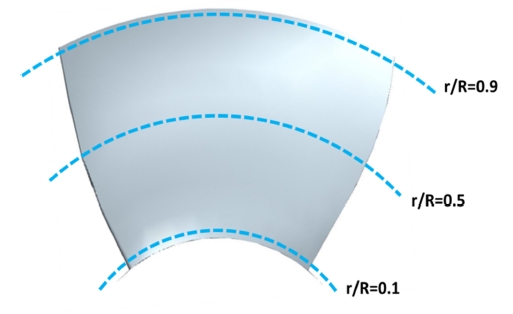
In order to investigate the internal flow characteristics, the pressure distribution was examined. There are three locations around the runner blade for pressure measurement as shown in Fig.ure 7. The location of r/R=0.1 is the position around the blade surface near the hub. The location of r/R=0.5 is the position at the middle of blade in radial direction, and the location of r/R=0.9 is the position near the tip of the blade.
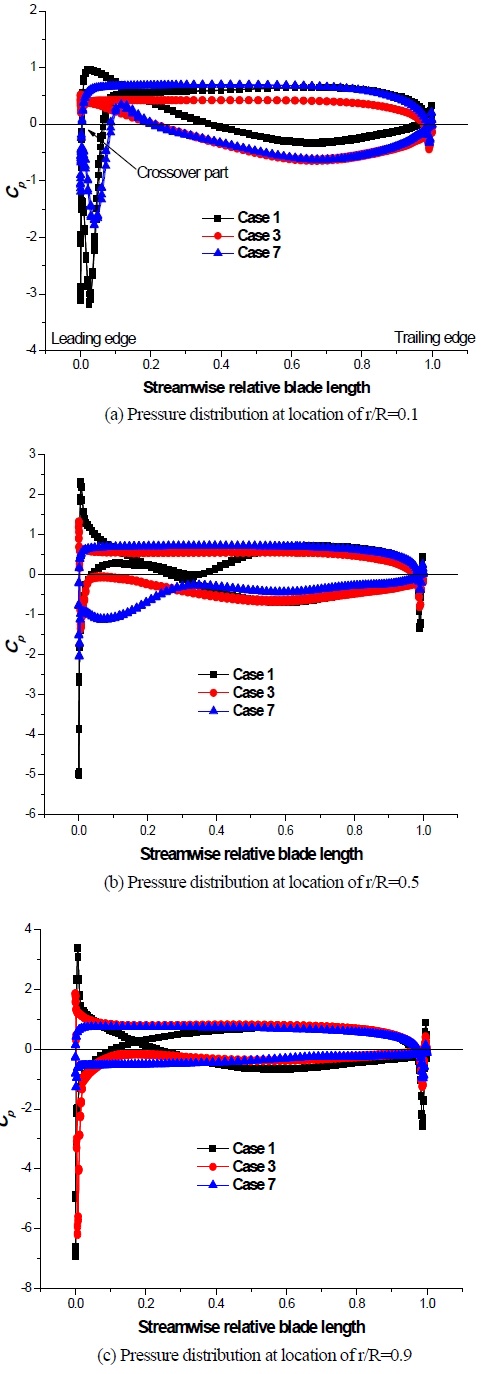
Figure 8 shows the pressure distribution at the three locations around the blade surface. The pressure coefficient (Cp) is calculated by the following Equation (2):

where p is the local pressure, p is the averaged reference pressure.
For streamwise relative blade length, value of 0 is the leading edge of the blade, and 1 is the trailing edge of the blade. From Figure 8 (a), it can be seen that the pressure near the leading edge of Case 1 with crossover part by the pressure and suction sides, which means that the pressure of suction side is larger than that of pressure side at the leading edge for the condition of partial flow rate.
The crossover part almost disappears at the flow rate condition of Case 3. From Figure 8 (b) and (c), it can be seen that there is only Case 1 with crossover part at leading edge of blade, and the crossover part is suppressed at Cases 3 and 7.
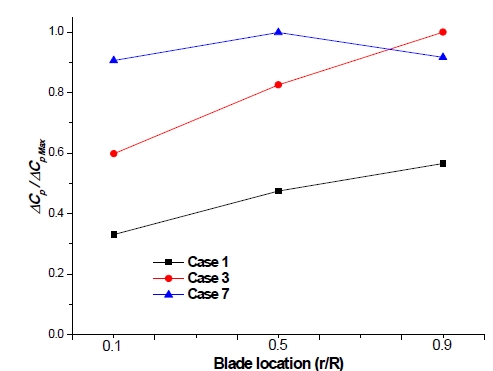
Figure 9 shows the pressure difference ratio (ΔCp/ΔCpMax) distribution by the three cases at those three locations. The ΔCp is the pressure difference between pressure side and suction side. The ΔCpMax is the maximum pressure difference among all the values. The result shows that with increasing water flow, the pressure difference ratio (ΔCp/ΔCpMax) becomes larger. The pressure difference ratio (ΔCp/ΔCpMax) increases as the blade location r/R moves away from the runner hub. However, there is a slight drop in the pressure coefficient of Case 7 at the tip of blade.
3.3 Velocity distribution
Even the tubular type hydro turbine is a kind of reaction turbine, but the velocity distribution is very important before and after the guide vane and runner.
The output power (P) achieved from the runner blades are calculated by the following Equation (3):

where, Tc is the output torque from CFD analysis, Tt is the output torque from theoretical analysis, ω is the angular velocity, r is the runner radius,
 is the mass flow rate per second and Vtis the tangential flow velocity. The equation indicates that the tangential velocity is directly transformed to output torque.
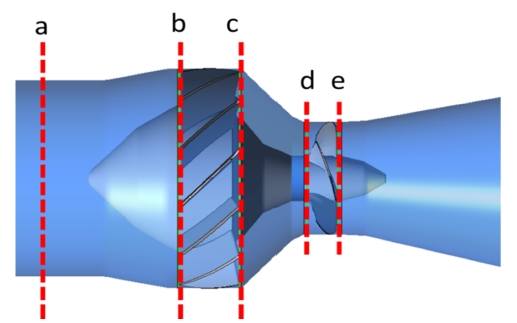
In this study, there are five locations selected for investigating the velocity distribution as shown in Figure 10. The location of “a” is located at inlet side. Location of “b” is a cross section before the guide vane and that of “c” is after the guide vane. Those of “d” and “e” are before and after the runner, respectively.
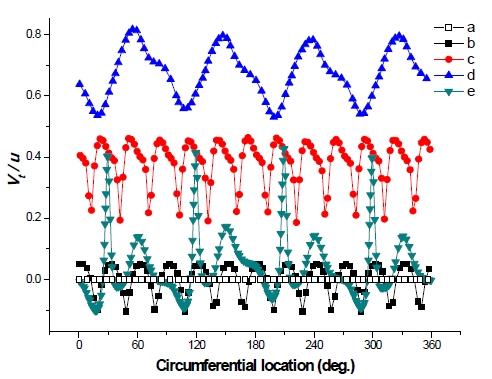
Figure 11 shows the tangential velocity distribution at those five locations at the best efficiency point. The tangential velocity is 0 at the inlet pipe. The tangential velocity becomes fluctuant at the inlet of the guide vane (b), because the waterseparates by the guide vane. The water flow obtains the tangential velocity after it passes through the guide vane passage. The guide vane gives an effect to correct the flow direction to tangential velocity, which are velocity components that affects output power of the runner.
To increase the flow velocity, a narrow flow passage is designed. The water flow obtains tangential velocity again after the flow leaves from the outlet of guide vane (c) to the runner inlet (d). Moreover, the tangential velocity decreases rapidly and reaches around 0 after the flow passes through the runner passage. The kinetic energy from tangential velocity is absorbed by the runner to give the output power.
3.4 Pressure contour and velocity vectors
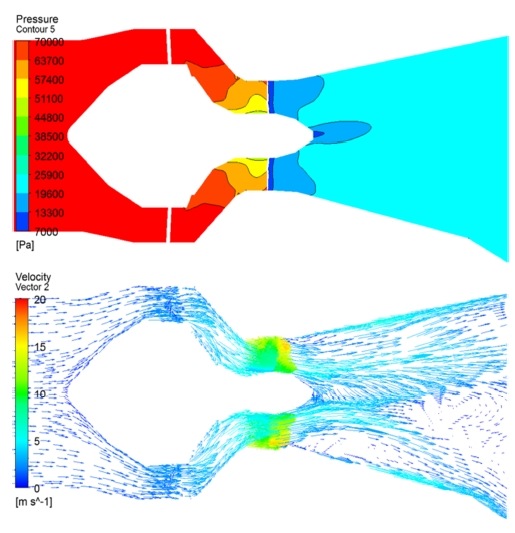
Figure 12 shows the pressure contour and velocity vectors at the case of best efficiency point. They are plotted at the middle cross section of the turbine model.
The pressure contour shows that the pressure decreases before the flow enters into the runner passage. The narrow flow passage causes increase in flow velocity, which reduces the pressure. The pressure decreases rapidly after the flow passes though the runner passage. The pressure energy is absorbed effectively as output power by the runner. Moreover, there is a low pressure area at the central draft tube region after the cone region, which causes the secondary flow at the region as shown in the velocity vectors of Figure 12. Therefore, the performance of the turbine can get improvement by suppressing the secondary flow at the draft tube.
3.5 Streamline distribution on the blade surface
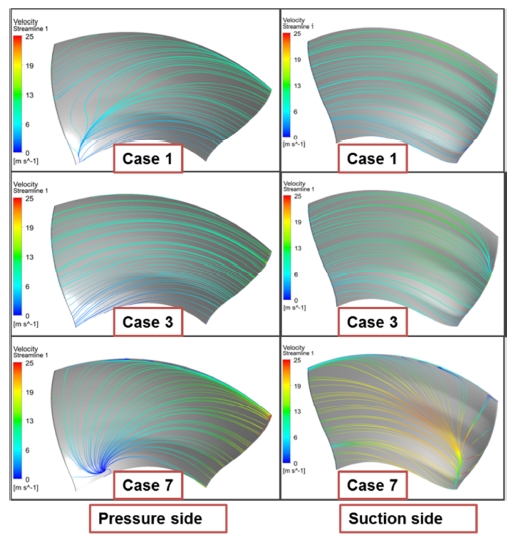
The streamline distribution on the runner blade surface clearly reveals the internal flow characteristics on the blade passage. In this study, Case 1 is selected to represent the operation condition of the partial flow rate, and the Case 7 is selected to represent the operation condition of the excessive flow rate.
Figure 13 shows the streamline distribution on the runner blade surface. The result shows that the streamline of Case 3 at the pressure side has the smoothest streamline with comparison to the partial (Case 1) and excessive (Case 7) flow rates. The secondary flow occurs at the pressure side at the partial and excessive flow rates. Especially for excessive (Case 7) flow rate operating condition, the secondary flow at the leading edge of pressure side becomes to a large extent. However, the streamline distribution at the suction side is uniform at the partial (Case 1) flow rate operation condition. There is slight occurrence of secondary flow at the tip of the suction side.
4. Conclusions
The maximum efficiency of 85.8% is achieved although the efficiency drops rapidly at partial flow rate condition. The efficiency decreases slowly at the condition of excess flow rate with increasing the flow rate.
From the pressure coefficient curves, it can be conjectured that the crossover part at the leading edge appears when the turbine operates at the partial flow rate condition. This factor reduces the efficiency to a large extent.
The tangential velocity and pressure in the turbine passage are absorbed by the runner effectively at the best efficiency point. However, there still remain some secondary flows at the draft tube.
There is uniform streamline on the suction and pressure sides of the blade at the design point. However, the secondary flow appears at the suction and pressure side at the excessive flow rate and it appears only at pressure side at partial flow rate condition.
Acknowledgments
This study was supported by a grant of the components and materials Global collaborative R&D Project, Korea Institute for Advancement of Technology, Republic of Korea (N0000583).
This paper is extended and updated from the short version that appeared in the Proceedings of the International symposium on Marine Engineering and Technology (ISMT 2014), held at Paradise Hotel, Busan, Korea on September 17-19, 2014.
References
-
V. Vivek, Sharma Anil Kumar, and C. Balaji, “A CFD based approach for thermal hydraulic design of main vessel cooling system of pool type fast reactors,”, Annals of Nuclear Energy, 57, p269-279, (2013).
[https://doi.org/10.1016/j.anucene.2013.01.059]

- Bright Hub Engineering, http://www.brighthubengineering.com/marine-enginesmachinery/41043-procedure-of-sw-pump-sea-chest-cleaning/ Accessed October 1, 2014.
-
S. H. Nam, Y.T. Kim, Y.D Choi, and Y.H. Lee, “Internal flow analysis of a tubular-type small hdroturbine by runner vane angle,”, Journal of the Korean Society of Marine Engineering, 32(7), p1044-1050, (2008).
[https://doi.org/10.5916/jkosme.2008.32.7.1044]

-
L. Motycak, A. Skotak, and J. Obrovsky, “Analysis of the kaplan turbine draft tube effect,”, Proceedings of 25th IAHR Symposium on Hydraulic Machinery and Systems, 12, (2010).
[https://doi.org/10.1088/1755-1315/12/1/012038]

- W. Jingchun, S. Katsunasa, T. Kiyohito, N. Kazuo, and S. Joushirou, “CFD-based design optimization for hydro turbines,”, Journal of Fluids Engineering, 129(2), p159-168, (2007).
- M. K. Shukla, and R. Jain, “CFD analysis of 3-D flow for francis turbine,”, MIT International Journal of Mechanical Engineering, 1(2), p93-100, (2011).
- R. R. Navthar, J. TejasPrasad, D. Saurabh, D. Nitish, and A. Anand, “CFD analysis of francis turbine,”, International Journal of Engineering Science and Technology, 4(7), p3194-3199, (2012).
- A. Mishra, R. P. Saini, and M. K. Singhal, “CFD based performance analysis of kaplan turbine for micro hydro power,”, International Conference on Mechanical and Industrial Engineering, p9-13.
- D. Jost, A. Skerlavaj, and A. Lipej, “Numerical flow simulation and efficiency prediction for axial turbines by advanced turbulence models,”, Proceeding of 26th IAHR Symposium on Hydraulic Machinery and Systems, 15, (2012).
-
H. Wu, J. J. Feng, G. K. Wu, X. Q. Luo, “Numerical investigation of hub clearance flow in a kaplan turbine,”, Proceedings of 26th IAHR Symposium on Hydraulic Machinery and Systems, 15, (2012).
[https://doi.org/10.1088/1755-1315/15/7/072026]

- ANSYS Inc, (2013), “ANSYS CFX Documentation” Ver. 12, http://www.ansys.com Accessed November 1, 2013.

