
A study on the performance and internal flow of inline Francis turbine

Copyright © The Korean Society of Marine Engineering
This is an Open Access article distributed under the terms of the Creative Commons Attribution Non-Commercial License (http://creativecommons.org/licenses/by-nc/3.0), which permits unrestricted non-commercial use, distribution, and reproduction in any medium, provided the original work is properly cited.
This paper presents the performance characteristic of a Francis hydro turbine with an inline casing. This turbine is designed for city water supply system. Due to large changes in ground elevation with high points and low points, some systems may experience larger-than-normal required pressures in areas with low ground elevations. One way to dissipate these excess pressures is by the use of an inline-turbine instead of an inline-pressure reducing valve. For best applicability and minimal space consumption, the turbine is designed with an inline casing instead of the common spiral casing. As a characteristic of inline casing, the flow accesses to the runner in the radial direction, showing a low efficiency. The installation of vanes improves the internal flow and gives the positive encouragement to the output power. For the power transmission to the outside of the turbine casing from the runner axis, a belt passage is designed in the inline casing, as its influence, the region after the belt passage shows a relatively low output power. The clearance gap in the runner side space is considered, in which a small volume of flow is contracted into the clearance gap, forming the leakage flow. The leakage flow leads to a decrease in the efficiency.
Keywords:
Francis turbine, Inline casing, Stay and guide vanes, Performance, Internal flow1. Introduction
Energy can be acquired from the water which is always in motion. In the 19th century, turbine was designed as an energy collector capturing the energy from the fluid flow. Today Francis turbines are primarily used in the world, ascribing to the wide range of head and flow rate. Besides, the most important fact is that its efficiency can be as high as over 90%.
For this study, the Francis turbine is designed for city water supply system. Generally speaking, a pressure relief valve is normally used in the system as jet flow with high pressure will be formed when water is directly supplied to the citizen. In the meantime, large amount of available energy is wasted. A new type of Francis turbine is suggested to be applied in this situation to recycle the energy and decrease the pressure.
In general, spiral casing is preferred used in a Francis turbine to supply water from the penstock to the vanes and through its unique shape of continual cross sectional area reduction, it maintains a near uniform velocity of water around the vanes.
However, due to the simplicity of the water supply piping system, an inline flow passage is required. Therefore, the turbine is designed with an inline casing to meet the demand of a compact size and simple structure. With the absence of the spiral casing, the flow accesses to the runner in the radial direction, which leads to a low efficiency.
The guide vane and stay vane have been proved of outstanding performance in the Francis turbine with spiral casing [1][2]. In order to improve internal flow and efficiency of the turbine in this study, guide vanes and stay vanes are suggested to be used, and the variation of internal flow by vanes will be analyzed with the modification of casing from spiral to inline type.
The performance prediction considers the influence of the belt passage and clearance gap, simulating the real operating condition of the turbine. Leakage flows are inherent to turbo-machinery as they form the presence of technological clearances between the fixed and rotating parts of the machine. It gives a significant influence to the performance of the turbo-machinery.
2. Inline Francis hydro turbine model
This inline Francis Turbine is designed with 5 main hydraulic components: inline casing, stay vanes, guide vanes, runner and draft tube as shown in Figure 1. The rotating speed of runner, effective head and flow rate at the design point are N=1800min-1, H=20m and Q=0.02m3/s, respectively.

Schematic view of inline Francis turbine model
For the best applicability and minimal space consumption, the Francis turbine is designed with an inline casing instead of the spiral casing. A belt passage is designed in the column form body, used for the power transmission to the outside of the turbine casing from the runner axis.
The purpose of adding stay vanes is to direct the flow towards the adjustable guide vanes with an optimal incidence angle. The adjustable guide vanes are available to control the flow and to improve the output power. The guide vane shape and number are chosen from a previous study of a francis turbine [3].
The runner consists of 13 three-dimensional blades, with the crown and shaft supporting. Figure 2 shows the clearance gap in the runner side space, a component of flow is contracted into the clearance gap, forming the leakage flow. The structure of clearance gap is narrow at the both ends, and the thickness of the clearance gap entrance is T=0.5mm.

Cross sectional view of turbine flow passage and clearance gap of leakage flow
In order to observe the influence of vane on the performance, three models with the different layout of vane are designed, as shown in Figure 3. Turbine flow rate operating range varies to the guide vane opening as shown in Table 1.

Front view of turbine passage layout (a) runner only(case I); (b) runner and guide vanes(case II); (c) runner , guide vanes and stay vanes(case III)

Operating conditions for several cases
3. Numerical methods
Computational Fluid Dynamic (CFD) analysis is a very useful tool for predicting hydraulic machinery performance at various operating conditions [4]-[7]. For the designer, prediction of operating characteristics performance is the most important task. This study employs a commercial CFD code of ANSYS CFX [8] to conduct CFD analysis. The grid is constituted by approximately 9 million element numbers and 3 million element nodes, including the domains of inline casing, stay vanes, guide vanes, runner and draft tube.
The non-dimensional wall distance [9][10] (y+ value) for all domains are listed in Table 2. Due to the complex structure, tetrahedral grids are applied for the inlet domain. The other domains are meshed with hexahedral grids and the high density Hexahedral grid is applied in the region of runner blades, as shown in Figure 4.
Non-dimensional Wall Distance

Numerical mesh for the runner
A suitable turbulence model is required for the complex flow phenomenon that occurs in the domains.
The turbulence model dependence test is carried out by using three turbulence models: k-ε, k-ω, SST. Figure 5 shows the efficiency curve of the three turbulence models. Three turbulence models show almost similar efficiency curve, except the k-ε model shows a little lower efficiency in small guide vane opening. The k-ω model is substantially more accurate than k- ε near the wall layers, and successful for flows with moderately adverse pressure gradients, but falls for flows with pressure induced separation. Considering all the turbulence models, the shear stress transport (SST) turbulence model is utilized, which has been well known to estimate both separation and vortex occurring on the wall of a complicated blade shape.

Performance curves by turbulence dependence test (case Ⅲ)
4. Results and discussion
In order to examine the performance and internal flow characteristics of the Francis turbine with an inline casing, CFD analysis is carried out for the flow field of turbine passage. Three cases with different layout of the vanes present those features in changing the internal flow. For the performance variation of the inline Francis turbine by the existence of vanes, the belt passage and the clearance gap is investigated in detail.
4.1 Influence of guide and stay vanes
When water flows through the turbine, hydraulic losses may occur due to leakage flow, eddy formation in different components, change in flow direction as well as due to loss in kinetic energy at the exit. The turbine efficiency is calculated by Equation (1):
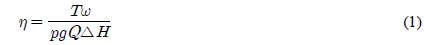
Where ŋ is the efficiency; T is the torque on the runner; ω is the angular speed of runner rotating on its own axis; ρ is the water density; g is the gravitational acceleration; Q is the flow rate; ΔH is head.
Figure 6 presents a comparison between the efficiency of case I, II and III, which have different passage layout. The perform ance tested by CFD shows that the inline casing supplies quite poor guiding function to the flow, approximately 9% of efficiency, when the inline casing used without any guide vanes or stay vanes. As anticipated, a high efficiency of 81.5% is gained with the inline casing and guide vanes. A higher efficiency of case III is shown in Figure 6 indicating that the stay vanes give an improvement to the internal flow.

Comparison of efficiencies by passage layout
The poor ability of inline casing in flow circumference direction guidance reduces the turbine hydraulic performance. However, the vanes give a significant improvement to the flow condition and direction (discussed in the following chapters), making up the deficiency in hydraulic performance.
Figure 7 shows the test plane and locations in the turbine. Figure 7(b) shows the circumferential position for checking the circumferential velocity at runner, a view frame is set to observe the velocity vector.

(a) Test plane of pressure and velocity; (b) Test locations.
The influence of vane on the internal flow of the inline Francis turbine is analyzed by the three modeling with the different installation of vanes. Case I is designed without guide vanes and stay vanes, case II is designed with only the guide vanes and case III is designed with guide vanes and stay vanes.
As the shape of casing is designed similar to a cylinder, the flow comes to the runner in the radial direction, and vortex appears on the runner blade surface as shown in case I in Figure 8. The flow in the runner passage is shown as a diffusion flow, which is centered in the vortex. By the vortex influence, the flow is not uniform in the runner exit. It is conjectured that the vortex in the runner passage gives negative effect to the turbine performance.

Velocity vectors of case I, II and III
With the addition of guide vane in case II, a significant guidance is attached to the flow. The passage between the guide vanes and runner inlet shows quite uniform flow with effective circumferential direction. With the influence of guide vane, the fluid flows to the runner with an appropriate inflow angle, with no shock entry contributing minimum energy lose. The vortex in the runner passage is also eliminated and the flow in the runner passage becomes close to the runner blade shape. Case III with stay vanes shows slightly further improvement of flow to the runner, giving a slight rise to the efficiency.
Figures 9 and 10 show the pressure and circumferential velocity distributions from Locations 1 to 6 at case III. The test locations are shown in Figure 7(b).

Pressure distributions of the design point (Case III)

Circumferential velocity distributions of the design point (Case III)
The pressure distributions at each location show gradual decrease of static pressure from 1 to 6. The decreased static pressure changes to the output torque in the runner passage. The circumferential velocity in the runner passage directly influences the angular momentum of the runner. At location 1, without the effect of guide vane, fluid comes in the radial direction. As a result of guide vane effect, the absolute value of circumferential velocity increases rapidly as presented in Figure 10 at locations 2 to 4.
As a characteristic of inline casing, the flow enters the runner in the radial direction. In case I, without any vanes distribution, the flow jets to the runner with a minimum loss of energy, shown as a maximum pressure at the runner inlet in Figure 11. The vanes play a role in changing the flow direction from radial to circumferential, accompanying with a pressure decrease and normalization.

Pressure distribution of case I, II and III at runner inlet
The circumferential velocity distribution is shown for the case I in Figure 12, which is operated with a low circumferential velocity at the runner inlet and high fluctuation, it gives low contribution to the rotation of the runner and power produced, reflecting on the low efficiency presented in Figure 6.

The circumferential velocity of case I, II and III at runner inlet
The guide vanes give a significant improvement to the flow condition and efficiency. The velocity vector between the guide vanes and runner passage shows a uniform flow, and the circumferential velocity increases rapidly as presented in Figure 12. The cases II and III show almost the same circumferential velocity, while the stay vanes give suppression to the fluctuation in case III. A higher efficiency of Case III shown in Figure 6 indicates that the stay vane gives an improvement to the internal flow.
Cases 1, 5 and 7 are chosen as typical cases to analyze the internal flow characteristics in the inline Francis turbine influenced by the guide vane opening, respectively. Figure 13 shows the averaged pressure distributions in the Francis turbine by the pressure coefficient Equation (2) [11]:

Averaged pressure coefficient distributions in the turbine by guide vane opening
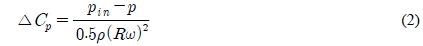
Where pin is the static pressure at the inlet of turbine casing and p is the local static pressure of test location, R is the radius of runner inlet.
In the case 1, the amount of pressure decrease is considerably larger than the other cases. The larger amount of pressure decrease at the guide vane passage may lead to the low efficiency. Therefore, the pressure decrease is reflected on the efficiency curve and thus, the tendency of efficiency decreases with the decrease of guide vane opening as shown in Figure 5.
Figure 14 shows the averaged circumferential velocity distributions in the three cases. With the decrease of guide vane opening, the flow passing through the passage becomes crowded, reflecting on the high averaged circumferential velocity that appears at small guide vane opening. However, the rapid circumferential velocity causes more hydraulic loss in the passage.

Averaged circumferential velocity distributions in the turbine by guide vane opening
4.2 Influence of belt passage
A belt passage is designed in the inline casing as a passageway of power transmission. The flow characteristic is influenced by the belt passage, especially the streamline and torque distribution in the region which is located behind the belt passage.
Figure 15 shows the 3D streamline distribution in the inline casing, a relatively sparse streamline is presented after the flow passes the belt passage structure.

3D streamline distribution in the inline casing
A further influence caused by the belt passage is non-uniform distribution of torque in the runner. Figure 16 shows the torque and average torque of the runner varying to the circumferential position, a relatively low torque occurs on the region which corresponds to the position behind belt passage. The torque of turbine is restrained due to the relatively low torque. Therefore, the modification of belt passage is required by considering the shape and location of the belt passage.

Torque distribution in the runner
4.3 Influence of clearance gap
The performance of turbine is also influenced by the clearance gap between the rotating runner and fixed casing. Before the flow enters the runner passage, it divided into two components: main flow and leakage flow, as presented in Figure 2.
Figure 17 shows the pressure gradient along the gap passage and flow characteristics. Flow is injected into the clearance gap by the driving of high pressure in the upstream, and the pressure drop gives negative effect to the runner torque. There are two flow conditions in the clearance gap: the flow which is close to the rotating side is endowed with a rotating tendency by the rotating runner; and the flow which is close to the fixed side moves as the pressure gradient.

Pressure and flow condition in the clearance gap
Figure 18 shows the influence of the leakage on the turbine performance characteristic: the leakage flow rate through the gap between the runner front wall and casing inner wall reaches almost 6% decrease by comparing the leakage and no leakage results, while the efficiency shows a 3% to 7% decrease for all operating points. The decreasing flow passes across the gap in the runner side space and leads to a flow loss in the runner passage. This loss contributes to the loss of efficiency in the turbine.

Efficiency and flow rate comparison
5. Conclusions
This paper presents the characteristic of a Francis turbine with an inline casing, the performance and internal flow improvement by the installation of vanes.
For the best application and minimal space consumption, the shape of casing is designed similar to an inline pipe, instead of the spiral casing. The radial direction flow guided by the inline casing gives quite low contribution to the power generation of the runner.
Furthermore, the belt passage in the casing reduces the turbine performance reflecting on the non-uniform distribution of the runner torque.
The installation of guide vanes causes a change in the internal flow and rapidly increases the efficiency of the turbine. More uniform flow in the turbine runner passage occurs when guide vane are used, the flow accesses to the runner with an appropriate inflow angle, no shock entry contributes to the minimum energy lose. The vortex in the runner passage is also eliminated. Stay vane also gives improvement on the efficiency increase and fluctuation decrease.
The clearance gap in the runner side space is considered in the performance analysis, and the leakage flow leads to a 3% to 7% efficiency decrease.
References
- A. Alnaga, and J. L. Kueny, “Optimal design of hydraulic turbine distributor”, Journal of World Scientific and Engineering Academy and Society Transactions on Fluid Mechanics, 3(2), p175-185, (2008).
-
P. Drtina, and M. Sallaberger, “Hydraulic turbines-basic principle and state-of-the-art computational fluids dynamic applications”, Proceedings of the Institution of Mechanical Engineers—Part C, 213, p85-102, (1999).
[https://doi.org/10.1243/0954406991522202]

-
Q. Wei, and Y. D. Choi, “The influence of guide vane opening on the internal flow of a Francis turbine”, Journal of the Korean Society of Marine Engineering, 37(3), p274-281, (2013).
[https://doi.org/10.5916/jkosme.2013.37.3.274]
- M. K. Shukla, R. Jain, V. Prasad, and S. N. Shukla, “CFD analysis of 3-D flow for Francis turbine”, MIT International Journal of Mechanical Engineering, 1(2), p93-100, (2011).
-
H. J. Choi, M. A. Zullah, H. W. Roh, P. S. Ha, S. Y. Oh, and Y. H. Lee, “CFD validation of performance improvement of a 500 kw Francis turbine”, Journal of Renewable Energy, 51, p111-123, (2013).
[https://doi.org/10.1016/j.renene.2012.08.049]
-
J. C. Wu, K. Shimmei, K. Tani, K. Niikura, and J. Sato, “CFD-based design optimization for hydro turbines”, Journal of Fluids Energy, 129(2), p159-168, (2007).
[https://doi.org/10.1115/1.2409363]
- R. Khare, V. Prasad, and S. Kumar, “CFD approach for flow characteristics of hydraulic Francis turbine”, International Journal of Engineering Science and Technol, 2(8), p3824-3831, (2010).
- ANSYS Inc, CFX Documentation: ANSYS CFX-Solver Theory Guide, http://www.ansys.com Accessed November 10, 2013.
- ANSYS Inc, ANSYS CFX Documentation, ver. 13, http://www.ansys.com Accessed November 12, 2013.
- M. Ariff, S. M. Salim, and S. C. Cheah, “Wall Y+approach for dealing with turbulent flow over a surface mounted cube: Part 2 - high reynolds number”, Proceedings of Seventh International Conference on CFD in the Minerals and Process Industries, p1-6, (2009).
- A. Zobeiri, J. L. Kueny, M. Farhat, and F. Avellan, “Pump-turbine rotor-stator interactions in generating mode : Pressure fluctuation in distributor channel”, Proceedings of the 23th IAHR Symposium-Yokohama, p1-10, (2006).